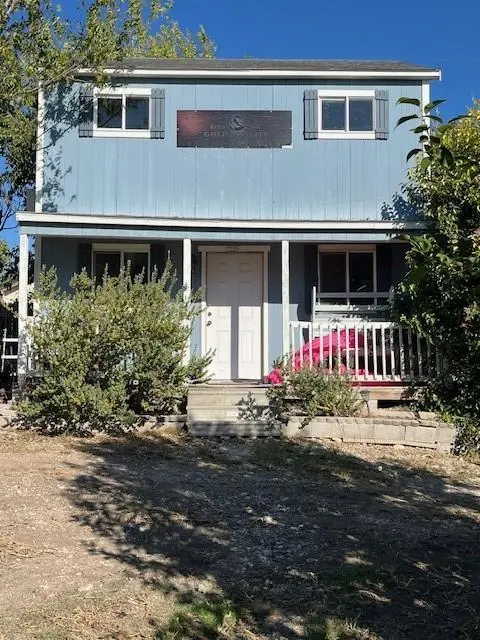
1210 Second St · Goldthwaite, TX
Flood risk 1/10 · Minimal
- FEMA flood zone
- —
- Chance of flooding over 30 yrs
- 0.0%
- Est. flood insurance / yr
- —
Fire risk 4/10 · Minor
- Est. fire insurance / yr
- $1,222 – $2,270
Heat risk 7/10 · Major
- Hot days now (above 103°F)
- 7 days/yr
- Hot days in 30 yrs
- 23 days/yr
Wind risk 6/10 · Moderate
- Chance of severe wind over 30 yrs
- 27.0%
Air-quality risk 1/10 · Minimal
- Unhealthy air days now
- 0 days/yr
- Unhealthy air days in 30 yrs
- 0 days/yr
Risk factors via First Street. Map © Google.
Why this score? — see what drove the A- grade
The composite is a weighted blend of 9 inputs, each scored 0–100. Each bar is that input's sub-score; the figure is the points it added to the 100-point composite (weight × sub-score).
- Cash flow +30.0/30.0
- 1% rule +10.0/10.0
- DSCR +10.0/10.0
- Appreciation +9.1/10.0
- ARV discount +7.5/15.0
- Schools +5.4/10.0
- Livability +3.2/5.0
- Rent growth +2.5/5.0
- Condition / age +2.5/5.0
$24,000
🖨 Deal sheet 📄 Offer letter ✓ Due diligence
Listing remarks
This is a small 2 story cabin that is no longer needed for the sellers. The home consists of 640 square feet with a shingled roof and a covered front porch. Inside you will find the lower level has USB walls, laminate flooring, window unit, ceiling fan and staircase leading to 2nd level. On this floor there is a sink and a water closet with commode, ceiling fan. Floors and walls are USB. The seller has included a moving fee in the list price for a location in Mills County. Any thing other than Mills County would be at buyers expense. This would make a great hunters cabin to place on your property. Come take a look.
Key facts
- Covered front porch
- Laminate flooring
- Ceiling fan
Tags
Property features AI
Finance
- Other: Cash and conventional financing considered; Listing is for sale and marked active
- Financial info: Treat as clear loan status; No second mortgage
- HOA & community: No association
Exterior
- Parking: No garage; No covered or carport spaces; No dedicated parking features
- Utilities: City water; City sewer; Not in a municipal utility district
- Home design: Single-family residence; Residential property; Not attached to other units; Preowned (built in 2019); Located in the town of Goldthwaite
- Construction: Wood construction; Built in 2019
- Exterior features: Irregular lot; Hunters cabin on the property; No fencing
Interior
- Kitchen: No appliances included
- Bedrooms: 1 bedroom on the second level (Primary bedroom)
- Bathrooms: 1 bathroom (includes one half-bath count listed)
- Heating & cooling: Ceiling fan(s); Window unit(s)
- Interior features: Built-in features; Two levels; 2 total rooms; 2 living areas
- Laundry & utility: No laundry appliances listed
Neighborhood map
What this means for you Summary
Snapshot
- This is a 1-bed/0.5-bath single-family listed at $24k.
Deal economics
- At list price, monthly cash flow is $565 ($7k/yr) — positive.
- The deal already cash-flows at list — no discount required.
- Meets the 1% rule at list price ($925 rent vs $24k).
- Recommended offer: $24k (1.5% below list) — sets the bar for market timing.
- Cap rate 34.6% vs local median 1.7% in Goldthwaite — top-decile yield for the area; either an underpriced asset or a hidden risk that comps aren't pricing in. Stress-test before assuming the spread holds.
Location & tenants
- Location reads 65/100 on livability (#725 in TX) — a middle-class / working-renter tenant base. Strengths: crime A+, cost of living A+, housing B+; Watch: employment D, amenities F, commute F.
- Goldthwaite ISD (rural): math 65% / reading 63% proficiency, ranked #50 of 826 in TX (top 6%) — acceptable for families but not a draw, mixed tenant base, ~2y average lease.
- Zoned schools: Goldthwaite El (math 67% / reading 62%, grade B, #257 of 4,322 statewide, top 6%, 242 students, 52% FRL).
- Market conditions: 77 active listings in the ZIP.
Forward outlook
- In year one you build about $2k of equity ($166 loan paydown + $2k appreciation (8.2% local appreciation)).
- Mills County population projected to shrink 9% by 2050 — rents likely to lag national; underwrite the cash flow, not the appreciation.
- At projected returns (8.2% appreciation + 3.0% rent growth), your $7k cash investment doubles in ~1 year — after that, you're playing with house money.
Negotiation context
- It's been on market 17 days — a 2% lower offer ($24k) is reasonable based on typical stale-listing flexibility.
Risks & watch-outs
- Climate carrying-cost: major wind risk, 27% chance of damaging wind over 30y; extreme-heat days projected 7→23/yr by 2055 (HVAC capex compounding) — expect insurance premiums to compound above CPI over the hold.
Questions for the listing agent
- Is there a deadline driving the sale (1031 exchange, divorce, estate, relocation)? That informs how much negotiation room exists.
- What's the average days-on-market for RENTAL listings here right now (not sales)? A rising rental-DOM trend means longer vacancies and softer asking-rent achievability than the comps imply.
- What's the recent tenant-quality profile in this submarket — average credit score on applications, eviction rate, late-payment / NSF rate, and stable-employment percentage? A property-management company in the area should have these aggregated.
- How much new for-sale + rental construction is in the pipeline within 1–3 miles? Heavy new supply typically softens prices + rents 12–24 months out; constrained supply supports both.
Investment metrics
- 1% rule
- 3.86% ✓
- Cap rate
- 34.55%
- Cash-on-cash
- 100.93%
- DSCR
- 5.49
- GRM
- 2.2
CMA / ARV
- ARV (on-the-fly)
- $258,160
- Comps found
- 1
Show comp detail 1 sale within ~0.75 mi
| Address | Dist | Beds/Ba | Sqft | Sold | Price | $/sf | Match |
|---|---|---|---|---|---|---|---|
| 1403 N Parker St | 0.11mi | 2/2.0 (+1) | 1,715 (-7%) | 23mo | $239,500 | $140 | 52 |
Match score weights: distance 35% · size 25% · config 20% · recency 20%. Top-matched comps best support the ARV.
Projected returns pro-forma
8.21% appreciation · 3.0% rent growth · sell at horizon
- IRR
- —
- Equity multiple
- 7.88×
- Total profit
- $46,218
- Equity at exit
- $18,573
- IRR
- —
- Equity multiple
- 16.98×
- Total profit
- $107,397
- Equity at exit
- $37,196
Cash invested: $6,720 (down + closing). Projections, not guarantees.
Landlord ↔ Tenant lean methodology
- Overall (STATE)
- 87 Strongly Landlord-Friendly
- State Texas
- 87 Strongly Landlord-Friendly · R+5
- County
- — inherits STATE
- City
- — inherits STATE
ZIP-level market 76844
- Home prices YoY
- 4.2%
- Active inventory
- 77
- Price-to-rent
- 2.2×
Monthly cashflow live
- Estimated rent
- $925 medium interval (Pro) →
- Mortgage (P&I)
- −$126
- Tax est. 1.5%
- −$30 /mo · $360/yr
- Insurance
- −$10
- HOA
- −$0
- Vacancy / Maint / Mgmt
- −$194
- Net cashflow
- $565
Break-even live
UW: 25.0% down · 7.5% · 30yr · 1.5% tax · 5.0% vac · 8.0% maint · 8.0% mgmt
Financing live
Cash to close
- Down payment
- $6,000
- Closing costs
- $720
- Reserves months
- —
- Total cash needed
- —
Loan-product check · same deal, 3 products live
Conventional
25% down · 7.5% · 30yr
- Down + closing
- —
- Monthly P&I
- —
- Monthly cashflow
- —
- DSCR
- —
- Eligible?
- —
Personal DTI + credit; lowest rate.
DSCR
20% down · 8.5% · 30yr
- Down + closing
- —
- Monthly P&I
- —
- Monthly cashflow
- —
- DSCR
- —
- Eligible?
- —
No personal income docs; deal must DSCR.
Hard money
10% down · 12.0% · 12mo
- Down + closing
- —
- Monthly P&I
- —
- Monthly cashflow
- —
- DSCR
- —
- Eligible?
- —
Short-term bridge; refi at stabilization.
Listing history 15 events
-
2026-06-18days on market $24,000 Active 17 DOM
-
2026-06-17days on market $24,000 Active 16 DOM
-
2026-06-16days on market $24,000 Active 15 DOM
-
2026-06-15days on market $24,000 Active 14 DOM
-
2026-06-13days on market $24,000 Active 12 DOM
-
2026-06-12days on market $24,000 Active 11 DOM
-
2026-06-09days on market $24,000 Active 8 DOM
-
2026-06-08days on market $24,000 Active 7 DOM
-
2026-06-08days on market $24,000 Active 6 DOM
-
2026-06-03days on market $24,000 Active 2 DOM
-
2026-06-02pricedays on market $24,000 Active 1 DOM
-
2026-05-31days on market $29,000 Active 193 DOM
-
2026-01-05price $29,000
-
2025-11-18$33,000 Active
-
1993-03-17soldstatus
ⓘ Source: listings_history table (triggers on properties + properties_extension) + one-shot
backfill from property_details.listing_events for pre-trigger history.
Climate risk First Street
- Flood 1/10 Low 0% chance over 30 yrs
- Wildfire 4/10 Moderate
- Heat 7/10 Severe 7 d/yr ≥103°F today · 23 d/yr by 30 yrs out
- Wind 6/10 Major 27% chance of damaging wind over 30 yrs
- Air quality 1/10 Low 0 unhealthy d/yr today · 0 by 30 yrs out
Nearby sold comps map
Loading sold comps map…
Walkable amenities ~0.75 mi
Loading nearby amenities…
Taxation est. · year 1
- Rental income
- $11,105
- − Mortgage interest
- −$1,344
- − Property taxes
- −$360
- − Insurance
- −$120
- − Repairs & maintenance
- −$888
- − Management
- −$888
- − Depreciation
- −$698
- Taxable income
- $6,805
- Est. tax owed @ 24.0%
- −$1,633
- After-tax cash flow
- $5,149/yr
For passive investors: Depreciation is non-cash, so a rental often shows a tax loss while cash-flowing — sheltering income. Rental losses are passive: they offset passive income freely, and up to $25,000/yr can offset ordinary (W-2) income if you actively participate and your MAGI is under $100k (phasing out to $0 by $150k); unused losses carry forward. On sale, claimed depreciation is recaptured at up to 25%, and gains may owe capital-gains tax (a 1031 exchange can defer both). Figures are a year-1 estimate at your 24.0% rate — not tax advice; consult a CPA.
Schools (NCES district)
- District
- Goldthwaite ISD
- NCES district ID
- 4821000
- Math proficiency
- 65% ▼ -5.00%
- Reading proficiency
- 63% ▬ 0.00%
- Median HH income
- $40,846
- Composite
- 53.53/100
- National rank
- #1447
- State rank
- #50 of 826 in TX
Livability — Goldthwaite
- Score
- 65/100
- State rank
- #725
- US rank
- #13478
Category grades
Schools grade is shown separately in the Schools card above.
Census & demographics
- Census place
- Goldthwaite, TX
- Population (ZIP)
- 3,202
Population outlook (Mills County) Hauer SSP2
- Today (2025)
- 4,793 people
- By 2030
- 4,723 · -1.5%
- By 2040
- 4,562 · -4.8%
- By 2050
- 4,366 · -8.9%
- By 2075
- 4,053 · -15.4%
- By 2100
- 3,628 · -24.3%
Race, ethnicity, and origin ACS 2023
- Neighborhood character
- Predominantly White (73%)
- Race & ethnicity
- White 73% Hispanic / Latino 22% Two or more races 15%
- Hispanic origin (detail)
- Mexican 19%
- Common ancestry
- Italian 8% Slovak 3% Iranian 1%
- Foreign-born
- 4% · Canada
- Languages at home
- 86% English-only · Spanish 14%
Political lean MEDSL · Mills
- 2024 margin
- Solid R (+76.9) · D 11.3% · R 88.2%
- 2008→2024 swing
- -14.7pp toward R · 2008: -62.2pp · 2024: -76.9pp
- All cycles
- 2024: R+76.9 2020: R+77.7 2016: R+76.3 2012: R+73.0 2008: R+62.2
Not yet ingested
- Civics
- —
Market trends
- HPI YoY
- ▲ 8.21%
- Current HPI
- 205.1126
- Rent YoY
- —
- Metro
- —
- State GDP YoY
- ▲ 3.95%
- F500 in state
- 110
Industry mix (Fortune 500 HQ in TX)
| Industry | F500 HQs | Revenue |
|---|---|---|
| Energy | 16 | $1,198B |
|
||
| Technology | 5 | $198B |
|
||
| Engineering / Construction | 4 | $72B |
|
||
| Energy Services | 3 | $60B |
|
||
| Utilities | 3 | $41B |
|
||
| Healthcare | 2 | $330B |
|
||
Price history
-12.1% since first listed3 events — show timeline
- 2026-01-05 Price Changed $29,000 NTREIS
- 2025-11-18 Listed $33,000 NTREIS
- 1993-03-17 Sold (Public Records) — Public Records
Property tax history
+9.9%/yrLatest (2025): $2,011 · +6.1% YoY. Source: county tax records.
Cash-flow waterfall
monthlySold comps — $/sqft
last 12 mo · ≤1 miLoading sold comps…