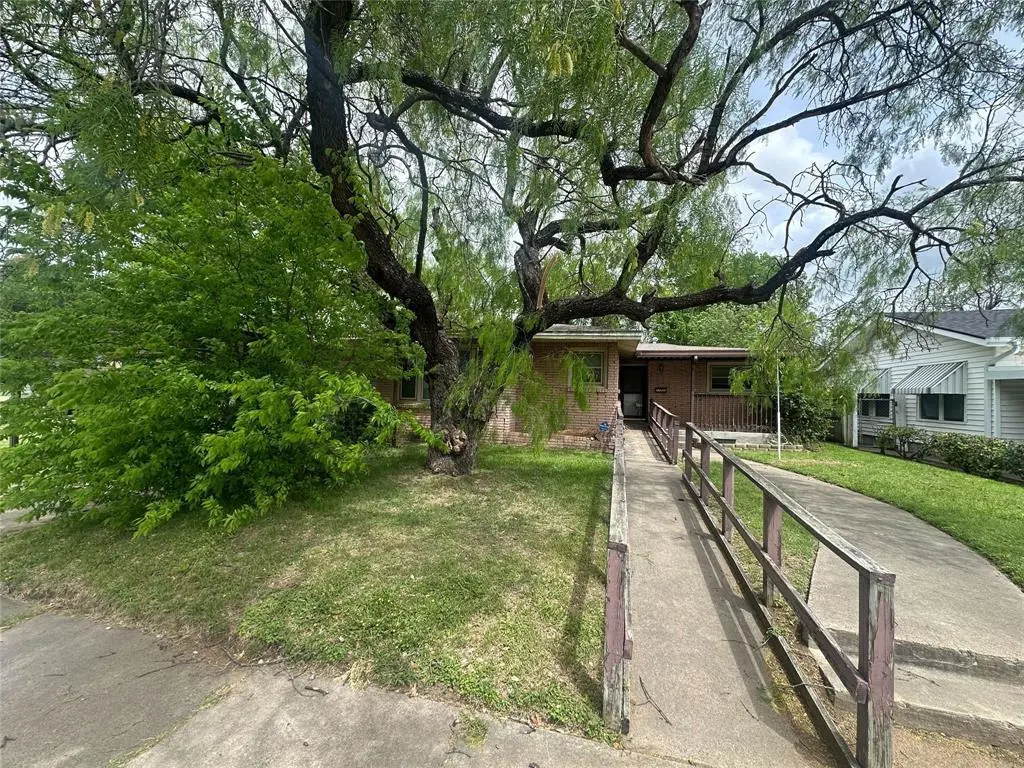
2220 Joey Dr · Waco, TX
Flood risk 1/10 · Minimal
- FEMA flood zone
- X (unshaded)
- Chance of flooding over 30 yrs
- 0.0%
- Est. flood insurance / yr
- $507 – $1,088
Fire risk 2/10 · Minimal
- Est. fire insurance / yr
- $1,222 – $2,270
Heat risk 7/10 · Major
- Hot days now (above 109°F)
- 7 days/yr
- Hot days in 30 yrs
- 24 days/yr
Wind risk 6/10 · Moderate
- Chance of severe wind over 30 yrs
- 60.0%
Air-quality risk 1/10 · Minimal
- Unhealthy air days now
- 0 days/yr
- Unhealthy air days in 30 yrs
- 0 days/yr
Risk factors via First Street. Map © Google.
Why this score? — see what drove the A- grade
The composite is a weighted blend of 9 inputs, each scored 0–100. Each bar is that input's sub-score; the figure is the points it added to the 100-point composite (weight × sub-score).
- Cash flow +30.0/30.0
- ARV discount +15.0/15.0
- 1% rule +10.0/10.0
- DSCR +10.0/10.0
- Appreciation +6.8/10.0
- Livability +3.7/5.0
- Rent growth +3.2/5.0
- Condition / age +2.5/5.0
- Schools +1.8/10.0
$99,900
🖨 Deal sheet 📄 Offer letter ✓ Due diligence
Listing remarks MLS
INVESTOR SPECIAL!! Prime opportunity for seasoned and new investors alike. This well-positioned 3-bedroom, 2-bath property features a wheelchair ramp for added accessibility and sits just minutes from I-35, offering exceptional convenience for future tenants. Its proximity to Central Texas Marketplace, H-E-B, and major commuter routes makes it a high-demand rental location with strong occupancy potential. The property is being SOLD AS IS, presenting a favorable opportunity to renovate, force appreciation, and elevate returns. With its strategic location and solid upside, this is a valuable addition to any investor’s portfolio, whether you're looking to flip, hold, or expand your rental income stream.
Key facts
- Wheelchair ramp
- Proximity to h-e-b
- 7,200 sq ft lot
Tags
Neighborhood map
What this means for you Summary
Snapshot
- This is a 3-bed/2.0-bath single-family listed at $100k.
Deal economics
- At list price, monthly cash flow is $503 ($6k/yr) — positive.
- The deal already cash-flows at list — no discount required.
- Meets the 1% rule at list price ($2k rent vs $100k).
- Recommended offer: $94k (6.0% below list) — sets the bar for market timing.
- Cap rate 12.3% vs local median 3.9% in Waco — top-decile yield for the area; either an underpriced asset or a hidden risk that comps aren't pricing in. Stress-test before assuming the spread holds.
Location & tenants
- Location reads 74/100 on livability (#166 in TX, #4,378 nationally) — a middle-class / working-renter tenant base. Strengths: cost of living A+, housing A+, health & safety A+; Watch: schools D, crime D, commute F.
- Waco ISD (urban): math 20% / reading 24% proficiency, ranked #773 of 826 in TX (top 94%) — low school quality limits family demand, transient renter base, plan for 1-2y turnover; 81% free/reduced lunch — lower-income household profile, screen leases tightly.
- Market conditions: Rents rising (+2.6%/yr); 43 active listings in the ZIP; 14 comparable units currently listed for rent nearby; rentals at typical pace (median 21d on market — plan ~3-4 weeks tenant-placement turnaround); 1,014 units permitted in McLennan County in 2024 (200 in 5+ unit buildings).
- This rent runs 38% of the median local income ($53k/yr) — at the standard rent-burdened threshold; future hikes will face affordability resistance.
Forward outlook
- In year one you build about $4k of equity ($691 loan paydown + $4k appreciation (3.6% local appreciation)).
- McLennan County population projected at +17% by 2050 — long-run rental-demand tailwind backs the buy-and-hold thesis.
- At projected returns (3.6% appreciation + 2.6% rent growth), your $28k cash investment doubles in ~3 years — after that, you're playing with house money.
- By year 8, paydown + projected appreciation supports a ~$32k cash-out refi (75% LTV) — recoverable capital for the next deal without selling this one.
Negotiation context
- It's been on market 76 days — a 6% lower offer ($94k) is reasonable based on typical stale-listing flexibility.
Risks & watch-outs
- Watch-outs: property tax is 3.3% of price; built in 1954 — expect roof / HVAC / electrical / plumbing capex.
- Climate carrying-cost: major wind risk, 60% chance of damaging wind over 30y; extreme-heat days projected 7→24/yr by 2055 (HVAC capex compounding) — expect insurance premiums to compound above CPI over the hold.
Questions for the listing agent
- It's been on market 76 days. Have you received any prior offers? Is the seller open to a 6% concession, seller financing, or rate buy-down credit?
- Built in 1954 — when were the roof, HVAC, electrical panel, plumbing, and water heater last replaced?
- Property tax is high relative to price — has the assessment been appealed recently, and will the sale trigger a re-assessment?
- Why hasn't it sold? Are there any deal-killer items the seller is aware of (foundation, flood, title, zoning, code violations)?
- Is there a deadline driving the sale (1031 exchange, divorce, estate, relocation)? That informs how much negotiation room exists.
- Schools are D-rated, which usually means shorter tenancies and higher turnover. Who's the typical renter profile here, and what's been the actual vacancy rate?
- Crime grade is D in this area — have there been break-ins, vandalism, or insurance claims at this property in the last 3 years? What carrier currently insures it and at what premium?
- What's the average days-on-market for RENTAL listings here right now (not sales)? A rising rental-DOM trend means longer vacancies and softer asking-rent achievability than the comps imply.
- What's the recent tenant-quality profile in this submarket — average credit score on applications, eviction rate, late-payment / NSF rate, and stable-employment percentage? A property-management company in the area should have these aggregated.
- How much new for-sale + rental construction is in the pipeline within 1–3 miles? Heavy new supply typically softens prices + rents 12–24 months out; constrained supply supports both.
Investment metrics
- 1% rule
- 1.71% ✓
- Cap rate
- 12.33%
- Cash-on-cash
- 21.56%
- DSCR
- 1.96
- GRM
- 4.9
CMA / ARV
- ARV (median comp)
- $183,246
- List price
- $99,900
- Delta
- -45.48%
- Verdict
- UNDERPRICED
- Comps
- 20 within 1.0 mi
Show comp detail 12 sales within ~0.75 mi
| Address | Dist | Beds/Ba | Sqft | Sold | Price | $/sf | Match |
|---|---|---|---|---|---|---|---|
| 3400 Daughtrey Ave | 0.25mi | 3/2.0 | 1,448 (-6%) | 9mo | $254,900 | $176 | 71 |
| 3401 James Ave | 0.47mi | 3/2.5 | 1,536 (-0%) | 8mo | $249,000 | $162 | 69 |
| 1709 Nelva St | 0.52mi | 3/2.0 | 1,513 (-2%) | 6mo | $225,000 | $149 | 68 |
| 3216 Wynmore Dr | 0.71mi | 3/2.0 | 1,526 (-1%) | 4mo | $279,999 | $183 | 62 |
| 3501 Bagby Ave | 0.39mi | 3/2.0 | 1,351 (-12%) | 1mo | $204,000 | $151 | 61 |
| 2711 Old Robinson Rd | 0.45mi | 3/2.0 | 1,356 (-12%) | 2mo | $179,000 | $132 | 58 |
| 3629 Wingate Dr | 0.72mi | 3/1.5 | 1,556 (+1%) | 5mo | $199,000 | $128 | 58 |
| 2213 Autumn Woods Dr | 0.36mi | 3/2.0 | 1,308 (-15%) | 1mo | $249,900 | $191 | 58 |
| 3419 Alta Vista Dr | 0.51mi | 2/2.0 (-1) | 1,753 (+14%) | 0mo | $249,900 | $143 | 48 |
| 3820 James Ave | 0.50mi | 3/1.0 | 1,339 (-13%) | 4mo | $200,000 | $149 | 47 |
| 3205 Belmont Dr | 0.38mi | 3/1.0 | 1,344 (-13%) | 13mo | $219,900 | $164 | 46 |
| 3505 Ferndale Dr | 0.62mi | 3/3.5 | 1,309 (-15%) | 9mo | $185,000 | $141 | 33 |
Match score weights: distance 35% · size 25% · config 20% · recency 20%. Top-matched comps best support the ARV.
Projected returns pro-forma
3.57% appreciation · 2.62% rent growth · sell at horizon
- IRR
- 28.7%
- Equity multiple
- 2.66×
- Total profit
- $46,540
- Equity at exit
- $48,135
- IRR
- 28.5%
- Equity multiple
- 5.16×
- Total profit
- $116,442
- Equity at exit
- $76,786
Cash invested: $27,972 (down + closing). Projections, not guarantees.
Landlord ↔ Tenant lean methodology
- Overall (STATE)
- 87 Strongly Landlord-Friendly
- State Texas
- 87 Strongly Landlord-Friendly · R+5
- County
- — inherits STATE
- City
- — inherits STATE
ZIP-level market 76711
- Home prices YoY
- 1.4%
- Rents YoY
- 2.6%
- Active inventory
- 43
- Price-to-rent
- 4.9×
Monthly cashflow live
- Estimated rent
- $1,704 high interval (Pro) →
- Mortgage (P&I)
- −$524
- Tax from tax record
- −$278 /mo · $3,340/yr
- Insurance
- −$42
- HOA
- −$0
- Vacancy / Maint / Mgmt
- −$358
- Net cashflow
- $503
Break-even live
UW: 25.0% down · 7.5% · 30yr · 1.5% tax · 5.0% vac · 8.0% maint · 8.0% mgmt
Financing live
Cash to close
- Down payment
- $24,975
- Closing costs
- $2,997
- Reserves months
- —
- Total cash needed
- —
Loan-product check · same deal, 3 products live
Conventional
25% down · 7.5% · 30yr
- Down + closing
- —
- Monthly P&I
- —
- Monthly cashflow
- —
- DSCR
- —
- Eligible?
- —
Personal DTI + credit; lowest rate.
DSCR
20% down · 8.5% · 30yr
- Down + closing
- —
- Monthly P&I
- —
- Monthly cashflow
- —
- DSCR
- —
- Eligible?
- —
No personal income docs; deal must DSCR.
Hard money
10% down · 12.0% · 12mo
- Down + closing
- —
- Monthly P&I
- —
- Monthly cashflow
- —
- DSCR
- —
- Eligible?
- —
Short-term bridge; refi at stabilization.
Rent comps 14 comps
| Address | Beds | Baths | Sqft | Rent | $/sqft | DOM | Units | Dist |
|---|---|---|---|---|---|---|---|---|
| 3743 Vista Cove Dr Waco, TX | 3.0 | 2.0 | 1509 | $1,850 | $1.23 | 20d | 1 | 0.27mi |
| 4009 James Ave Waco, TX | 3.0 | 1.0 | 1056 | $1,495 | $1.42 | 20d | 1 | 0.65mi |
| 3300 Wynmore Dr Waco, TX | 3.0 | 2.0 | 1678 | $1,850 | $1.10 | 43d | 1 | 0.66mi |
| 3300 Wynmore Dr Waco, TX | 3.0 | 2.0 | 1678 | $1,850 | $1.10 | 20d | 1 | 0.66mi |
| 3001 S New Rd Waco, TX | 1.0–3.0 | 1.0–2.0 | 885 | $1,645 | $1.86 | 13d | 15 | 0.72mi |
| 2201 Creekview Dr Waco, TX | 1.0–3.0 | 1.0–2.0 | 990 | $2,094 | $2.12 | 13d | 20 | 1.00mi |
| 3812 Hiland Dr Waco, TX | 3.0 | 1.0 | 1124 | $995 | $0.89 | 13d | 1 | 1.06mi |
| 4900 Bagby Ave Waco, TX | 3.0 | 1.0–2.0 | 1026 | $1,650 | $1.61 | 20d | 1 | 1.21mi |
| 2601 Flint Ave Waco, TX | 3.0 | 2.0 | 1356 | $1,720 | $1.27 | 43d | 1 | 1.25mi |
| 2500 Marketplace Dr Waco, TX | 1.0–2.0 | 1.0–2.0 | 921 | $1,560 | $1.69 | 13d | 10 | 1.30mi |
| 1800 Primrose Dr Waco, TX | 1.0–4.0 | 1.0–2.0 | 942 | $1,133 | $1.20 | 13d | 33 | 1.30mi |
| 5210 Bagby Ave Waco, TX | 1.0–3.0 | 1.0–2.0 | 1014 | $1,695 | $1.67 | 13d | 12 | 1.32mi |
| 2021 Gurley Ave Waco, TX | 3.0 | 2.0 | 1320 | $1,500 | $1.14 | 20d | 1 | 1.45mi |
| 1925 S 17th St Unit 1 Waco, TX | 4.0 | 4.0 | 1856 | $2,100 | $1.13 | 20d | 1 | 1.46mi |
Listing history 19 events
-
2026-06-18days on market $99,900 Active 76 DOM
-
2026-06-17days on market $99,900 Active 75 DOM
-
2026-06-16days on market $99,900 Active 74 DOM
-
2026-06-15days on market $99,900 Active 73 DOM
-
2026-06-14days on market $99,900 Active 71 DOM
-
2026-06-13days on market $99,900 Active 70 DOM
-
2026-06-10days on market $99,900 Active 68 DOM
-
2026-06-09days on market $99,900 Active 67 DOM
-
2026-06-08days on market $99,900 Active 66 DOM
-
2026-06-07days on market $99,900 Active 65 DOM
-
2026-06-05days on market $99,900 Active 62 DOM
-
2026-06-03days on market $99,900 Active 61 DOM
-
2026-06-02days on market $99,900 Active 60 DOM
-
2026-06-01days on market $99,900 Active 59 DOM
-
2026-05-31days on market $99,900 Active 58 DOM
-
2026-05-30days on market $99,900 Active 57 DOM
-
2026-04-18price $110,000 718-char remark
Show marketing remark (718 chars)
INVESTOR SPECIAL!! Prime opportunity for seasoned and new investors alike. This well-positioned 3-bedroom, 2-bath property features a wheelchair ramp for added accessibility and sits just minutes from I-35, offering exceptional convenience for future tenants. Its proximity to Central Texas Marketplace, H-E-B, and major commuter routes makes it a high-demand rental location with strong occupancy potential. The property is being SOLD AS IS, presenting a favorable opportunity to renovate, force appreciation, and elevate returns. With its strategic location and solid upside, this is a valuable addition to any investor’s portfolio, whether you're looking to flip, hold, or expand your rental income stream.
-
2026-04-03$140,000 Active 718-char remark
Show marketing remark (718 chars)
INVESTOR SPECIAL!! Prime opportunity for seasoned and new investors alike. This well-positioned 3-bedroom, 2-bath property features a wheelchair ramp for added accessibility and sits just minutes from I-35, offering exceptional convenience for future tenants. Its proximity to Central Texas Marketplace, H-E-B, and major commuter routes makes it a high-demand rental location with strong occupancy potential. The property is being SOLD AS IS, presenting a favorable opportunity to renovate, force appreciation, and elevate returns. With its strategic location and solid upside, this is a valuable addition to any investor’s portfolio, whether you're looking to flip, hold, or expand your rental income stream.
-
2018-08-14soldstatus
ⓘ Source: listings_history table (triggers on properties + properties_extension) + one-shot
backfill from property_details.listing_events for pre-trigger history.
Tax reassessment forecast TX · Resets to sale price
- Current annual tax
- $3,340 · $278/mo
- Projected year-2 tax
- $3,340 · $278/mo
- Expected delta
- $0/yr ($0/mo · 0.0%)
ⓘ Screening estimate from a state-policy table — verify with the county assessor before closing.
Climate risk First Street
- Flood 1/10 Low FEMA zone X (unshaded) · 0% chance over 30 yrs
- Wildfire 2/10 Low
- Heat 7/10 Severe 7 d/yr ≥109°F today · 24 d/yr by 30 yrs out
- Wind 6/10 Major 60% chance of damaging wind over 30 yrs
- Air quality 1/10 Low 0 unhealthy d/yr today · 0 by 30 yrs out
Nearby sold comps map
Loading sold comps map…
Walkable amenities ~0.75 mi
Loading nearby amenities…
Taxation est. · year 1
- Rental income
- $20,452
- − Mortgage interest
- −$5,596
- − Property taxes
- −$3,340
- − Insurance
- −$500
- − Repairs & maintenance
- −$1,636
- − Management
- −$1,636
- − Depreciation
- −$2,906
- Taxable income
- $4,838
- Est. tax owed @ 24.0%
- −$1,161
- After-tax cash flow
- $4,870/yr
For passive investors: Depreciation is non-cash, so a rental often shows a tax loss while cash-flowing — sheltering income. Rental losses are passive: they offset passive income freely, and up to $25,000/yr can offset ordinary (W-2) income if you actively participate and your MAGI is under $100k (phasing out to $0 by $150k); unused losses carry forward. On sale, claimed depreciation is recaptured at up to 25%, and gains may owe capital-gains tax (a 1031 exchange can defer both). Figures are a year-1 estimate at your 24.0% rate — not tax advice; consult a CPA.
Schools (NCES district)
- District
- Waco ISD
- NCES district ID
- 4844280
- Math proficiency
- 20% ▼ -14.00%
- Reading proficiency
- 24% ▼ -6.00%
- Median HH income
- $29,208
- Composite
- 17.57/100
- National rank
- #9043
- State rank
- #773 of 826 in TX
Livability — Waco
- Score
- 74/100
- State rank
- #166
- US rank
- #4378
Category grades
Schools grade is shown separately in the Schools card above.
Census & demographics
- Census place
- Waco, TX
- County
- McLennan County · 213,088 people
- City population
- 125,319
- Metro
- Waco, TX
- Population (ZIP)
- 9,676
- Household income
- $53,185
- Rent vs Own
- Severe rent burden
- 424.0
Population outlook (McLennan County) Hauer SSP2
- Today (2025)
- 264,191 people
- By 2030
- 273,578 · +3.6%
- By 2040
- 291,506 · +10.3%
- By 2050
- 308,044 · +16.6%
- By 2075
- 349,648 · +32.3%
- By 2100
- 364,779 · +38.1%
Race, ethnicity, and origin ACS 2023
- Neighborhood character
- Diverse neighborhood (Simpson 0.56)
- Race & ethnicity
- Hispanic / Latino 61% Two or more races 43% White 23% Black 12% Native American 3% Asian 2%
- Hispanic origin (detail)
- Mexican 56%
- Common ancestry
- Lithuanian 1% Italian 1% Portuguese 1%
- Foreign-born
- 27% · Canada, China
- Languages at home
- 53% English-only · Spanish 45% Tagalog/Filipino 1% Other Indo-European 1%
Political lean MEDSL · McLennan
- 2024 margin
- Solid R (+30.9) · D 34.0% · R 64.9% · Other 1.0%
- 2008→2024 swing
- -7.0pp toward R · 2008: -23.9pp · 2024: -30.9pp
- All cycles
- 2024: R+30.9 2020: R+23.4 2016: R+27.1 2012: R+29.8 2008: R+23.9
Not yet ingested
- Civics
- —
Market trends
- HPI YoY
- ▲ 3.57%
- Current HPI
- 261.7166
- Rent YoY
- ▲ 2.62%
- Metro
- Waco, TX
- State GDP YoY
- ▲ 3.95%
- F500 in state
- 110
Industry mix (Fortune 500 HQ in TX)
| Industry | F500 HQs | Revenue |
|---|---|---|
| Energy | 16 | $1,198B |
|
||
| Technology | 5 | $198B |
|
||
| Engineering / Construction | 4 | $72B |
|
||
| Energy Services | 3 | $60B |
|
||
| Utilities | 3 | $41B |
|
||
| Healthcare | 2 | $330B |
|
||
Price history
-21.4% since first listed3 events — show timeline
- 2026-04-18 Price Changed $110,000 NTREIS
- 2026-04-03 Listed $140,000 NTREIS
- 2018-08-14 Sold (Public Records) — Public Records
Property tax history
+3.5%/yrLatest (2025): $3,340 · +11.8% YoY. Source: county tax records.
Cash-flow waterfall
monthlySold comps — $/sqft
last 12 mo · ≤1 miLoading sold comps…