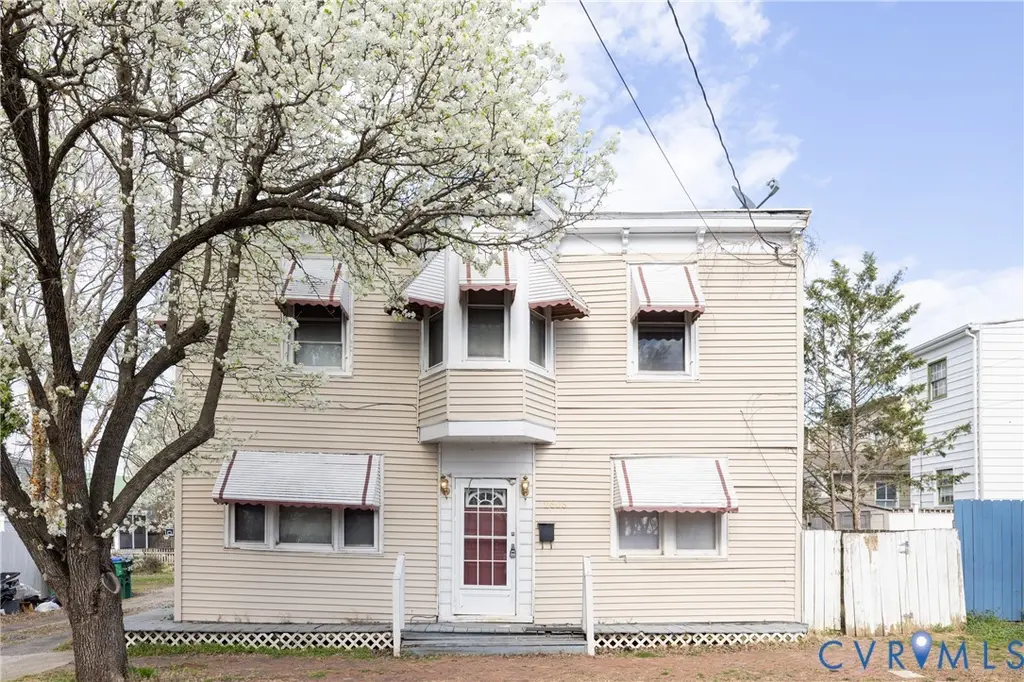
2606 Cedar St · Richmond, VA
Flood risk 1/10 · Minimal
- FEMA flood zone
- X (unshaded)
- Chance of flooding over 30 yrs
- 0.0%
- Est. flood insurance / yr
- $507 – $1,088
Fire risk 1/10 · Minimal
- Est. fire insurance / yr
- $666 – $1,236
Heat risk 8/10 · Major
- Hot days now (above 105°F)
- 7 days/yr
- Hot days in 30 yrs
- 16 days/yr
Wind risk 6/10 · Moderate
- Chance of severe wind over 30 yrs
- 27.0%
Air-quality risk 2/10 · Minimal
- Unhealthy air days now
- 1 days/yr
- Unhealthy air days in 30 yrs
- 2 days/yr
Risk factors via First Street. Map © Google.
Why this score? — see what drove the C- grade
The composite is a weighted blend of 9 inputs, each scored 0–100. Each bar is that input's sub-score; the figure is the points it added to the 100-point composite (weight × sub-score).
- Cash flow +15.5/30.0
- ARV discount +15.0/15.0
- DSCR +4.8/10.0
- Livability +4.2/5.0
- Rent growth +4.1/5.0
- 1% rule +3.7/10.0
- Schools +3.3/10.0
- Condition / age +2.5/5.0
- Appreciation +0.0/10.0
$239,999
🖨 Deal sheet 📄 Offer letter ✓ Due diligence
Listing remarks MLS
Charming two-story home located in Richmond’s East End, just minutes from Church Hill and downtown. This property offers a great opportunity for a buyer to add their personal touch and build equity. The home features a traditional layout with spacious living areas, abundant natural light, and generously sized bedrooms. The kitchen offers ample cabinet space, and the home provides solid functionality throughout. Situated on a corner lot with outdoor space and off-street parking potential. Updates needed, this home is ideal for a primary residence or investment property. Conveniently located near major highways, local amenities, and downtown Richmond. Sold as-is.
Key facts
- Outdoor space
- Local amenities
- Off-street parking
Tags
Neighborhood map
What this means for you Summary
Snapshot
- This is a 3-bed/1.0-bath single-family listed at $240k.
Deal economics
- At list price, monthly cash flow is $96 ($1k/yr) — positive.
- The deal already cash-flows at list — no discount required.
- To meet the 1% rule (rent ≥ 1% of price), the offer needs to be $209k (12.9% below list).
- Recommended offer: $209k (12.9% below list) — sets the bar for 1% rule.
- Cap rate 6.8% vs local median 3.3% in Richmond — top-decile yield for the area; either an underpriced asset or a hidden risk that comps aren't pricing in. Stress-test before assuming the spread holds.
Location & tenants
- Location reads 84/100 on livability (#33 in VA, #793 nationally) — a professional / high-income tenant draw. Strengths: amenities A+, commute A+, health & safety A+; Watch: crime D-.
- Richmond City Public School District (urban): math 32% / reading 47% proficiency, ranked #123 of 131 in VA (top 94%) — families likely to look elsewhere, expect single-tenant / working-renter base with shorter leases; 74% free/reduced lunch — lower-income household profile, screen leases tightly.
- Market conditions: Rents rising fast (+6.4%/yr); 337 active listings in the ZIP; 40 comparable units currently listed for rent nearby; rentals at typical pace (median 15d on market — plan ~3-4 weeks tenant-placement turnaround); 2,540 units permitted in Richmond city in 2024 (2,077 in 5+ unit buildings).
- This rent runs 45% of the median local income ($56k/yr) — at the standard rent-burdened threshold; future hikes will face affordability resistance.
Forward outlook
- Local home prices are declining (-3.0%/yr); year-one equity from $2k of loan paydown is wiped out by about $7k of value loss. Plan a longer hold.
- Richmond County population projected at +40% by 2050 — long-run rental-demand tailwind backs the buy-and-hold thesis.
Negotiation context
- It's been on market 90 days — a 6% lower offer ($226k) is reasonable based on typical stale-listing flexibility.
Risks & watch-outs
- Watch-outs: built in 1895 — expect roof / HVAC / electrical / plumbing capex.
- Climate carrying-cost: major wind risk, 27% chance of damaging wind over 30y; extreme-heat days projected 7→16/yr by 2055 (HVAC capex compounding) — expect insurance premiums to compound above CPI over the hold.
Questions for the listing agent
- It's been on market 90 days. Have you received any prior offers? Is the seller open to a 13% concession, seller financing, or rate buy-down credit?
- Built in 1895 — when were the roof, HVAC, electrical panel, plumbing, and water heater last replaced?
- Why hasn't it sold? Are there any deal-killer items the seller is aware of (foundation, flood, title, zoning, code violations)?
- Is there a deadline driving the sale (1031 exchange, divorce, estate, relocation)? That informs how much negotiation room exists.
- Schools are A-rated — typically a magnet for longer-tenancy family renters. What's the average tenant stay here, and is there a school-zone premium baked into asking?
- Crime grade is D in this area — have there been break-ins, vandalism, or insurance claims at this property in the last 3 years? What carrier currently insures it and at what premium?
- What's the average days-on-market for RENTAL listings here right now (not sales)? A rising rental-DOM trend means longer vacancies and softer asking-rent achievability than the comps imply.
- What's the recent tenant-quality profile in this submarket — average credit score on applications, eviction rate, late-payment / NSF rate, and stable-employment percentage? A property-management company in the area should have these aggregated.
- How much new for-sale + rental construction is in the pipeline within 1–3 miles? Heavy new supply typically softens prices + rents 12–24 months out; constrained supply supports both.
Investment metrics
- 1% rule
- 0.87% ✗
- Cap rate
- 6.77%
- Cash-on-cash
- 1.71%
- DSCR
- 1.08
- GRM
- 9.6
CMA / ARV
- ARV (median comp)
- $443,088
- List price
- $239,999
- Delta
- -45.83%
- Verdict
- UNDERPRICED
- Comps
- 20 within 1.0 mi
Show comp detail 12 sales within ~0.75 mi
| Address | Dist | Beds/Ba | Sqft | Sold | Price | $/sf | Match |
|---|---|---|---|---|---|---|---|
| 2012 Venable St | 0.43mi | 3/2.5 | 1,472 (-3%) | 0mo | $410,000 | $279 | 68 |
| 615 N 37th St | 0.67mi | 3/1.0 | 1,518 (-0%) | 1mo | $375,000 | $247 | 68 |
| 3316 Q St | 0.50mi | 3/2.5 | 1,564 (+3%) | 0mo | $365,000 | $233 | 66 |
| 510 N 28th St | 0.21mi | 3/2.5 | 1,320 (-13%) | 0mo | $435,000 | $330 | 62 |
| 1110 N 23rd St | 0.35mi | 3/2.5 | 1,670 (+10%) | 0mo | $382,500 | $229 | 61 |
| 615 N 38th St | 0.74mi | 3/1.0 | 1,484 (-2%) | 1mo | $365,000 | $246 | 61 |
| 1313 N 31st St | 0.50mi | 3/2.5 | 1,624 (+7%) | 0mo | $390,000 | $240 | 59 |
| 220 N 20th St Unit U4 | 0.59mi | 3/2.5 | 1,464 (-4%) | 1mo | $400,000 | $273 | 59 |
| 517 N 33rd St | 0.46mi | 3/2.5 | 1,658 (+9%) | 1mo | $680,000 | $410 | 57 |
| 1319 N 28th St | 0.41mi | 3/2.5 | 1,682 (+10%) | 1mo | $420,000 | $250 | 57 |
| 708 N 21st St | 0.39mi | 2/2.5 (-1) | 1,400 (-8%) | 1mo | $392,000 | $280 | 56 |
| 509 Mosby St | 0.43mi | 3/1.5 | 1,744 (+15%) | 1mo | $360,000 | $206 | 53 |
Match score weights: distance 35% · size 25% · config 20% · recency 20%. Top-matched comps best support the ARV.
Projected returns pro-forma
-3.0% appreciation · 6.38% rent growth · sell at horizon
- IRR
- -10.1%
- Equity multiple
- 0.62×
- Total profit
- $-25,467
- Equity at exit
- $35,785
- IRR
- 3.2%
- Equity multiple
- 1.27×
- Total profit
- $17,874
- Equity at exit
- $20,751
Cash invested: $67,200 (down + closing). Projections, not guarantees.
Landlord ↔ Tenant lean methodology
- Overall (STATE)
- 55 Moderately Landlord-Leaning
- State Virginia
- 55 Moderately Landlord-Leaning · D+2
- County
- — inherits STATE
- City
- — inherits STATE
ZIP-level market 23223
- Rents YoY
- 6.4%
- Active inventory
- 337
- Price-to-rent
- 9.6×
Monthly cashflow live
- Estimated rent
- $2,089 high interval (Pro) →
- Mortgage (P&I)
- −$1,259
- Tax from tax record
- −$196 /mo · $2,352/yr
- Insurance
- −$100
- HOA
- −$0
- Vacancy / Maint / Mgmt
- −$439
- Net cashflow
- $96
Break-even live
UW: 25.0% down · 7.5% · 30yr · 1.5% tax · 5.0% vac · 8.0% maint · 8.0% mgmt
Financing live
Cash to close
- Down payment
- $60,000
- Closing costs
- $7,200
- Reserves months
- —
- Total cash needed
- —
Loan-product check · same deal, 3 products live
Conventional
25% down · 7.5% · 30yr
- Down + closing
- —
- Monthly P&I
- —
- Monthly cashflow
- —
- DSCR
- —
- Eligible?
- —
Personal DTI + credit; lowest rate.
DSCR
20% down · 8.5% · 30yr
- Down + closing
- —
- Monthly P&I
- —
- Monthly cashflow
- —
- DSCR
- —
- Eligible?
- —
No personal income docs; deal must DSCR.
Hard money
10% down · 12.0% · 12mo
- Down + closing
- —
- Monthly P&I
- —
- Monthly cashflow
- —
- DSCR
- —
- Eligible?
- —
Short-term bridge; refi at stabilization.
Rent comps 40 comps
| Address | Beds | Baths | Sqft | Rent | $/sqft | DOM | Units | Dist |
|---|---|---|---|---|---|---|---|---|
| 803 N 26th St Unit A Richmond, VA | 2.0 | 2.0 | 1188 | $1,849 | $1.56 | 44d | 1 | 0.04mi |
| 901 N 27th St Apt 1 Richmond, VA | 4.0 | 1.0 | 1240 | $2,000 | $1.61 | 17d | 1 | 0.09mi |
| 1107 N 27th St Richmond, VA | 3.0 | 3.5 | 1792 | $2,600 | $1.45 | 4d | 1 | 0.24mi |
| 2820 Q St Richmond, VA | 3.0 | 2.0 | 1523 | $2,195 | $1.44 | 4d | 1 | 0.25mi |
| 3102 P St Unit B Richmond, VA | 2.0 | 2.5 | 1313 | $1,995 | $1.52 | 4d | 1 | 0.32mi |
| 1221 N 26th St Richmond, VA | 3.0 | 2.5 | 1900 | $2,700 | $1.42 | 23d | 1 | 0.33mi |
| 2914 R St Richmond, VA | 2.0 | 1.0 | 1250 | $1,500 | $1.20 | 23d | 1 | 0.35mi |
| 517 N 21st St Unit 517B Richmond, VA | 2.0 | 1.0 | 1447 | $1,884 | $1.30 | 17d | 1 | 0.38mi |
| 307 N 29th St Richmond, VA | 3.0 | 3.0 | 1992 | $2,900 | $1.46 | 4d | 1 | 0.38mi |
| 507 N 32nd St Unit A Richmond, VA | 2.0 | 1.0 | 1200 | $1,995 | $1.66 | 23d | 1 | 0.40mi |
| 811 N 33rd St Unit A Richmond, VA | 3.0 | 2.0 | 1315 | $1,900 | $1.44 | 4d | 1 | 0.40mi |
| 811 N 33rd St Unit A Richmond, VA | 3.0 | 2.0 | 1315 | $1,900 | $1.44 | 17d | 1 | 0.40mi |
| 1004 1/2 N 21st St Unit A Richmond, VA | 3.0 | 2.0 | 1248 | $2,195 | $1.76 | 17d | 1 | 0.42mi |
| 2003 Cedar St Richmond, VA | 3.0 | 2.0 | 1420 | $2,200 | $1.55 | 44d | 1 | 0.44mi |
| 2209 Fairmount Ave Richmond, VA | 3.0 | 2.0 | 1652 | $2,500 | $1.51 | 44d | 1 | 0.45mi |
| 3018 S St Richmond, VA | 3.0 | 2.5 | 1786 | $2,645 | $1.48 | 44d | 1 | 0.46mi |
| 1308 N 23rd St Richmond, VA | 3.0 | 2.5 | 2052 | $2,900 | $1.41 | 17d | 1 | 0.48mi |
| 1920 Princess Anne Ave Richmond, VA | 3.0 | 2.0 | 2000 | $2,595 | $1.30 | 4d | 1 | 0.49mi |
| 1404 N 30th St Richmond, VA | 3.0 | 2.5 | 1700 | $2,195 | $1.29 | 4d | 1 | 0.49mi |
| 1408 N 29th St Richmond, VA | 2.0 | 1.0 | 1528 | $1,150 | $0.75 | 20d | 1 | 0.50mi |
| 1903 E Marshall St Richmond, VA | 3.0 | 1.0–2.0 | 723 | $1,799 | $2.49 | 1d | 57 | 0.56mi |
| 3508 E Clay St Unit A Richmond, VA | 2.0 | 2.0 | 1188 | $1,899 | $1.60 | 14d | 1 | 0.58mi |
| 1427 N 22nd St Richmond, VA | 3.0 | 2.5 | 1764 | $2,700 | $1.53 | 44d | 1 | 0.59mi |
| 1313 N 20th St Richmond, VA | 3.0 | 2.0 | 2000 | $2,045 | $1.02 | 12d | 1 | 0.59mi |
| 3503 E Marshall St Unit 2 Richmond, VA | 2.0 | 1.0 | 1100 | $1,400 | $1.27 | 12d | 1 | 0.61mi |
| 2525 E Main St Richmond, VA | 2.0 | 1.0–2.0 | 736 | $1,895 | $2.57 | 1d | 10 | 0.61mi |
| 2201 E Franklin St Richmond, VA | 1.0–3.0 | 1.0–3.0 | 905 | $2,349 | $2.59 | 3d | 7 | 0.61mi |
| 2213 E Franklin St Richmond, VA | 1.0–2.0 | 1.0–2.0 | 862 | $2,049 | $2.38 | 4d | 6 | 0.62mi |
| 16 N 22nd St Richmond, VA | 1.0–2.0 | 1.0–2.0 | 844 | $1,675 | $1.98 | 3d | 7 | 0.64mi |
| 2 S 25th St Richmond, VA | 1.0–3.0 | 1.0–2.0 | 1050 | $2,360 | $2.25 | 2d | 69 | 0.67mi |
| 1901 E Franklin St Apt 5 Richmond, VA | 3.0 | 3.0 | 1530 | $1,850 | $1.21 | 23d | 1 | 0.72mi |
| 11 S 21st St Unit 106 Richmond, VA | 2.0 | 2.0 | 1709 | $2,148 | $1.26 | 44d | 1 | 0.72mi |
| 1617 N 21st St Richmond, VA | 3.0 | 1.0 | 1157 | $1,825 | $1.58 | 4d | 1 | 0.74mi |
| 6 N 18th St Apt 301 Richmond, VA | 2.0 | 2.0 | 1300 | $1,695 | $1.30 | 20d | 1 | 0.80mi |
| 10 Walnut Aly Unit A3 Richmond, VA | 2.0 | 2.0 | 1217 | $1,575 | $1.29 | 16d | 1 | 0.80mi |
| 1817 E Main St Richmond, VA | 2.0 | 1.0–2.0 | 846 | $1,955 | $2.31 | 2d | 40 | 0.83mi |
| 1614 N 19th St Richmond, VA | 4.0 | 2.0 | 1584 | $2,395 | $1.51 | 4d | 1 | 1.01mi |
| 100 S 15th St Richmond, VA | 1.0–2.0 | 1.0–2.0 | 825 | $1,749 | $2.12 | 4d | 4 | 1.03mi |
| 2106 Newbourne St Richmond, VA | 3.0 | 2.0 | 1172 | $1,875 | $1.60 | 44d | 1 | 1.03mi |
| 117 S 14th St Richmond, VA | 2.0 | 1.0–2.0 | 944 | $2,333 | $2.47 | 2d | 19 | 1.06mi |
Listing history 15 events
-
2026-06-18days on market $239,999 Active 90 DOM
-
2026-06-17days on market $239,999 Active 89 DOM
-
2026-06-16days on market $239,999 Active 88 DOM
-
2026-06-15days on market $239,999 Active 87 DOM
-
2026-06-13days on market $239,999 Active 85 DOM
-
2026-06-10days on market $239,999 Active 82 DOM
-
2026-06-09days on market $239,999 Active 81 DOM
-
2026-06-08days on market $239,999 Active 80 DOM
-
2026-06-07days on market $239,999 Active 79 DOM
-
2026-06-03days on market $239,999 Active 75 DOM
-
2026-06-02days on market $239,999 Active 74 DOM
-
2026-06-01days on market $239,999 Active 73 DOM
-
2026-05-31days on market $239,999 Active 72 DOM
-
2026-04-28price $239,999 675-char remark
Show marketing remark (675 chars)
Charming two-story home located in Richmond’s East End, just minutes from Church Hill and downtown. This property offers a great opportunity for a buyer to add their personal touch and build equity. The home features a traditional layout with spacious living areas, abundant natural light, and generously sized bedrooms. The kitchen offers ample cabinet space, and the home provides solid functionality throughout. Situated on a corner lot with outdoor space and off-street parking potential. Updates needed, this home is ideal for a primary residence or investment property. Conveniently located near major highways, local amenities, and downtown Richmond. Sold as-is.
-
2026-03-18$249,999 Active 675-char remark
Show marketing remark (675 chars)
Charming two-story home located in Richmond’s East End, just minutes from Church Hill and downtown. This property offers a great opportunity for a buyer to add their personal touch and build equity. The home features a traditional layout with spacious living areas, abundant natural light, and generously sized bedrooms. The kitchen offers ample cabinet space, and the home provides solid functionality throughout. Situated on a corner lot with outdoor space and off-street parking potential. Updates needed, this home is ideal for a primary residence or investment property. Conveniently located near major highways, local amenities, and downtown Richmond. Sold as-is.
ⓘ Source: listings_history table (triggers on properties + properties_extension) + one-shot
backfill from property_details.listing_events for pre-trigger history.
Tax reassessment forecast VA · Resets to sale price
- Current annual tax
- $2,352 · $196/mo
- Projected year-2 tax
- $2,352 · $196/mo
- Expected delta
- $0/yr ($0/mo · 0.0%)
ⓘ Screening estimate from a state-policy table — verify with the county assessor before closing.
Climate risk First Street
- Flood 1/10 Low FEMA zone X (unshaded) · 0% chance over 30 yrs
- Wildfire 1/10 Low
- Heat 8/10 Severe 7 d/yr ≥105°F today · 16 d/yr by 30 yrs out
- Wind 6/10 Major 27% chance of damaging wind over 30 yrs
- Air quality 2/10 Low 1 unhealthy d/yr today · 2 by 30 yrs out
Nearby sold comps map
Loading sold comps map…
Walkable amenities ~0.75 mi
Loading nearby amenities…
Taxation est. · year 1
- Rental income
- $25,071
- − Mortgage interest
- −$13,444
- − Property taxes
- −$2,352
- − Insurance
- −$1,200
- − Repairs & maintenance
- −$2,006
- − Management
- −$2,006
- − Depreciation
- −$6,982
- Taxable loss
- −$2,918
- Est. tax savings @ 24.0%
- +$700
- After-tax cash flow
- $1,851/yr
For passive investors: Depreciation is non-cash, so a rental often shows a tax loss while cash-flowing — sheltering income. Rental losses are passive: they offset passive income freely, and up to $25,000/yr can offset ordinary (W-2) income if you actively participate and your MAGI is under $100k (phasing out to $0 by $150k); unused losses carry forward. On sale, claimed depreciation is recaptured at up to 25%, and gains may owe capital-gains tax (a 1031 exchange can defer both). Figures are a year-1 estimate at your 24.0% rate — not tax advice; consult a CPA.
Schools (NCES district)
- District
- Richmond City Public School District
- NCES district ID
- 5103240
- Math proficiency
- 32% ▼ -24.00%
- Reading proficiency
- 47% ▼ -9.00%
- Median HH income
- $40,276
- Composite
- 33.09/100
- National rank
- #5564
- State rank
- #123 of 131 in VA
Livability — Richmond
- Score
- 84/100
- State rank
- #33
- US rank
- #793
Category grades
Schools grade is shown separately in the Schools card above.
Census & demographics
- Census place
- Richmond, VA
- County
- Henrico County · 334,490 people
- City population
- 287,109
- Metro
- Richmond, VA
- Population (ZIP)
- 54,659
- Household income
- $55,731
- Rent vs Own
- Severe rent burden
- 3530.0
Population outlook (Richmond County) Hauer SSP2
- Today (2025)
- 262,263 people
- By 2030
- 284,503 · +8.5%
- By 2040
- 327,353 · +24.8%
- By 2050
- 367,946 · +40.3%
- By 2075
- 449,560 · +71.4%
- By 2100
- 500,301 · +90.8%
Race, ethnicity, and origin ACS 2023
- Neighborhood character
- Predominantly Black (71%)
- Race & ethnicity
- Black 71% White 19% Two or more races 5% Hispanic / Latino 5%
- Common ancestry
- Romanian 1% Lithuanian 1% Slovak 1%
- Foreign-born
- 4% · Canada
- Languages at home
- 93% English-only · Spanish 4% French/Haitian/Cajun 1% Other Indo-European 1%
Political lean MEDSL · Richmond
- 2024 margin
- Solid D (+66.3) · D 82.0% · R 15.8% · Other 2.2%
- 2008→2024 swing
- +7.2pp toward D · 2008: 59.1pp · 2024: 66.3pp
- All cycles
- 2024: D+66.3 2020: D+68.0 2016: D+63.8 2012: D+55.7 2008: D+59.1
Not yet ingested
- Civics
- —
Market trends
- HPI YoY
- ▼ -257.81%
- Current HPI
- 324.0589
- Rent YoY
- ▲ 6.38%
- Metro
- Richmond, VA
- State GDP YoY
- ▲ 2.40%
- F500 in state
- 50
Industry mix (Fortune 500 HQ in VA)
| Industry | F500 HQs | Revenue |
|---|---|---|
| Aerospace / Defense | 4 | $236B |
|
||
| Technology / Defense | 3 | $32B |
|
||
| Financial Services | 2 | $176B |
|
||
| Utilities | 2 | $27B |
|
||
| Insurance | 2 | $25B |
|
||
| Technology | 2 | $15B |
|
||
Price history
-4.0% since first listed2 events — show timeline
- 2026-04-28 Price Changed $239,999 CVRMLS
- 2026-03-18 Listed $249,999 CVRMLS
Property tax history
+1.7%/yrLatest (2022): $2,352 · +38331.4% YoY. Source: county tax records.
Cash-flow waterfall
monthlySold comps — $/sqft
last 12 mo · ≤1 miLoading sold comps…