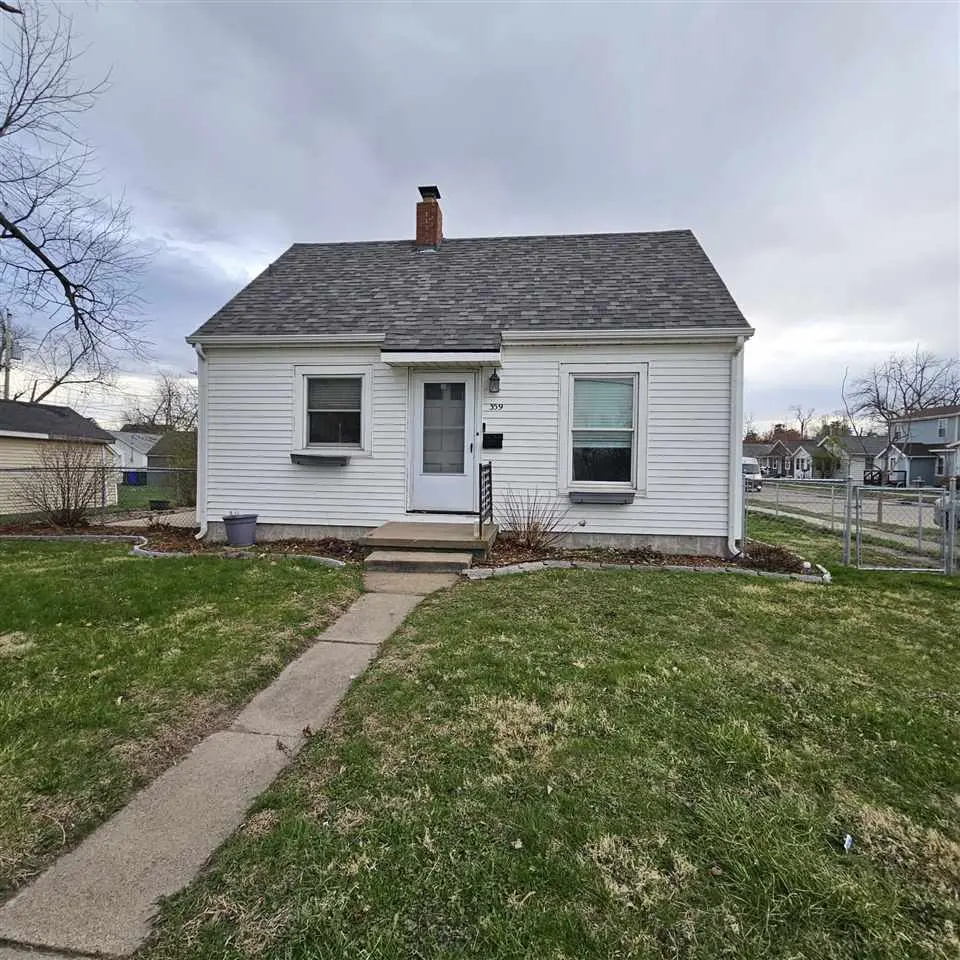
359 15th Ave Ave SW · Cedar Rapids, IA
Flood risk 1/10 · Minimal
- FEMA flood zone
- X (unshaded)
- Chance of flooding over 30 yrs
- 0.0%
- Est. flood insurance / yr
- $473 – $860
Fire risk 1/10 · Minimal
- Est. fire insurance / yr
- $902 – $1,676
Heat risk 3/10 · Minor
- Hot days now (above 103°F)
- 7 days/yr
- Hot days in 30 yrs
- 15 days/yr
Wind risk 2/10 · Minimal
- Chance of severe wind over 30 yrs
- —
Air-quality risk 2/10 · Minimal
- Unhealthy air days now
- 0 days/yr
- Unhealthy air days in 30 yrs
- 1 days/yr
Risk factors via First Street. Map © Google.
Why this score? — see what drove the D+ grade
The composite is a weighted blend of 9 inputs, each scored 0–100. Each bar is that input's sub-score; the figure is the points it added to the 100-point composite (weight × sub-score).
- Cash flow +18.8/30.0
- DSCR +5.9/10.0
- 1% rule +4.9/10.0
- Rent growth +4.7/5.0
- Schools +4.7/10.0
- ARV discount +4.4/15.0
- Livability +3.9/5.0
- Condition / age +2.5/5.0
- Appreciation +0.0/10.0
$122,900
🖨 Deal sheet 📄 Offer letter ✓ Due diligence
Listing remarks MLS
* * UNDER CONTRACT - ENTERTAINING BACK UP CONTRACTS UNTIL RELEASE OF CONTINGENCIES Newer kitchen (Gas Stove, new Refrigerator, table top dishwasher), newer washer/dryer, Updated Bath, LVP flooring throughout, finished attic space with carpet and plenty of storage, bedroom or office, fenced back yard 2022, roof 2020, exterior maintenance free-vinyl and covered soffit/fascia, patio, new shed, vinyl windows - most screens in basement, Security ADT/ Ring Camera to transfer 2020 Water heater, 2008 – Furnace/Central Air.
Key facts
- Newer kitchen
- Updated bath
- Fenced back yard
Tags
Property features AI
Finance
- HOA & community: Association fee paid annually
Exterior
- Parking: On-street parking
- Utilities: Public water; Public sewer; Cable available
- Home design: Single-family residence; 2 stories; Residential zoning
- Construction: Vinyl siding and frame construction
- Exterior features: Patio; Sidewalks; Street lights
Interior
- Kitchen: Dishwasher; Refrigerator; Trash compactor
- Flooring: Carpet
- Bathrooms: 1 full bathroom
- Heating & cooling: Central air conditioning; Forced air heating; Natural gas heating
- Interior features: Other interior features; In-basement laundry; Full concrete basement
- Laundry & utility: Washer; Dryer
Neighborhood map
What this means for you Summary
Snapshot
- This is a 2-bed/1.0-bath single-family listed at $123k.
Deal economics
- At list price, monthly cash flow is $123 ($1k/yr) — positive.
- The deal already cash-flows at list — no discount required.
- To meet the 1% rule (rent ≥ 1% of price), the offer needs to be $121k (1.2% below list).
- Recommended offer: $121k (1.5% below list) — sets the bar for market timing.
- Cap rate 7.5% vs local median 3.5% in Cedar Rapids — top-decile yield for the area; either an underpriced asset or a hidden risk that comps aren't pricing in. Stress-test before assuming the spread holds.
Location & tenants
- Location reads 78/100 on livability (#134 in IA, #2,474 nationally) — a middle-class / working-renter tenant base. Strengths: cost of living A+, housing A+, health & safety A+; Watch: crime C-, commute F.
- Cedar Rapids Community School District (urban): math 50% / reading 59% proficiency, ranked #265 of 289 in IA (top 92%) — acceptable for families but not a draw, mixed tenant base, ~2y average lease.
- Zoned schools: Cedar River Academy At Taylor (math 22% / reading 27%, grade F, #613 of 616 statewide, top 100%, 296 students, 78% FRL); Wilson Middle School (math 42% / reading 49%, grade D+, #231 of 246 statewide, top 94%, 395 students, 72% FRL); Thomas Jefferson High School (math 41% / reading 62%, grade D+, #307 of 336 statewide, top 91%, 1,543 students, 56% FRL) — zoned schools average 69% FRL vs 43% district-wide (26 pts higher); higher-poverty schools than district average — tighter screening recommended.
- Zoned-school proficiency averages 40% at this address vs 54% district-wide (-14 pts) — the specific schools serving this property underperform the Cedar Rapids Community School District average; the district grade overstates school quality for this exact location.
- Market conditions: Rents rising fast (+8.8%/yr); 415 active listings in the ZIP; 4 comparable units currently listed for rent nearby; rentals at typical pace (median 21d on market — plan ~3-4 weeks tenant-placement turnaround); 1,023 units permitted in Linn County in 2024 (456 in 5+ unit buildings).
Forward outlook
- Local home prices are declining (-3.0%/yr); year-one equity from $850 of loan paydown is wiped out by about $4k of value loss. Plan a longer hold.
- Linn County population projected at +16% by 2050 — long-run rental-demand tailwind backs the buy-and-hold thesis.
- At projected returns (-3.0% appreciation + 8.0% rent growth), your $34k cash investment doubles in ~10 years — after that, you're playing with house money.
Negotiation context
- It's been on market 18 days — a 2% lower offer ($121k) is reasonable based on typical stale-listing flexibility.
- 4 sale attempts since 11y ago with the ask held roughly flat each time — persistent listings suggest the price (not the market) is what's stuck; bring a comps-based counter.
- Current owner paid $60k; list at $123k implies a 105% gain — meaningful room to come down on a strong offer.
Risks & watch-outs
- Watch-outs: built in 1945 — expect roof / HVAC / electrical / plumbing capex.
Questions for the listing agent
- Built in 1945 — when were the roof, HVAC, electrical panel, plumbing, and water heater last replaced?
- Is there a deadline driving the sale (1031 exchange, divorce, estate, relocation)? That informs how much negotiation room exists.
- Schools are B-rated — typically a magnet for longer-tenancy family renters. What's the average tenant stay here, and is there a school-zone premium baked into asking?
- The area grade is low — what's the realistic commute time and amenity access for the typical tenant pool here? Any planned neighborhood developments (good or bad) we should know about?
- What's the average days-on-market for RENTAL listings here right now (not sales)? A rising rental-DOM trend means longer vacancies and softer asking-rent achievability than the comps imply.
- What's the recent tenant-quality profile in this submarket — average credit score on applications, eviction rate, late-payment / NSF rate, and stable-employment percentage? A property-management company in the area should have these aggregated.
- How much new for-sale + rental construction is in the pipeline within 1–3 miles? Heavy new supply typically softens prices + rents 12–24 months out; constrained supply supports both.
Investment metrics
- 1% rule
- 0.99% ✗
- Cap rate
- 7.50%
- Cash-on-cash
- 4.30%
- DSCR
- 1.19
- GRM
- 8.4
CMA / ARV
- ARV (on-the-fly)
- $115,063
- Comps found
- 12
Show comp detail 12 sales within ~0.75 mi
| Address | Dist | Beds/Ba | Sqft | Sold | Price | $/sf | Match |
|---|---|---|---|---|---|---|---|
| 1811 SW K St | 0.29mi | 2/1.0 | 720 (+4%) | 14mo | $173,000 | $240 | 67 |
| 944 L St St SW | 0.27mi | 2/1.0 | 636 (-8%) | 9mo | $118,500 | $186 | 67 |
| 925 21st Ave SW | 0.58mi | 2/1.0 | 648 (-6%) | 1mo | $108,000 | $167 | 62 |
| 702 8th St SW | 0.57mi | 2/1.0 | 720 (+4%) | 5mo | $83,000 | $115 | 62 |
| 620 15th Ave SW | 0.24mi | 2/1.0 | 616 (-11%) | 12mo | $90,000 | $146 | 61 |
| 620 22nd Ave SW | 0.47mi | 2/1.0 | 600 (-13%) | 1mo | $48,092 | $80 | 56 |
| 1116 21st Ave SW | 0.66mi | 2/1.0 | 668 (-3%) | 12mo | $80,000 | $120 | 54 |
| 259 25th Ave SW | 0.68mi | 2/1.0 | 640 (-7%) | 9mo | $124,000 | $194 | 49 |
| 938 18th Avenue Ave SW | 0.50mi | 2/1.0 | 760 (+10%) | 13mo | $92,500 | $122 | 49 |
| 522 8th St St SW | 0.62mi | 2/1.0 | 791 (+15%) | 1mo | $135,000 | $171 | 46 |
| 1137 15th Ave | 0.61mi | 2/1.0 | 763 (+11%) | 10mo | $97,000 | $127 | 45 |
| 945 19th Ave SW | 0.55mi | 2/1.0 | 792 (+15%) | 13mo | $136,900 | $173 | 39 |
Match score weights: distance 35% · size 25% · config 20% · recency 20%. Top-matched comps best support the ARV.
Projected returns pro-forma
-3.0% appreciation · 8.0% rent growth · sell at horizon
- IRR
- -4.2%
- Equity multiple
- 0.84×
- Total profit
- $-5,626
- Equity at exit
- $18,325
- IRR
- 10.5%
- Equity multiple
- 2.00×
- Total profit
- $34,479
- Equity at exit
- $10,626
Cash invested: $34,412 (down + closing). Projections, not guarantees.
Landlord ↔ Tenant lean methodology
- Overall (STATE)
- 83 Strongly Landlord-Friendly
- State Iowa
- 83 Strongly Landlord-Friendly · R+6
- County
- — inherits STATE
- City
- — inherits STATE
ZIP-level market 52404
- Rents YoY
- 8.8%
- Active inventory
- 415
- Price-to-rent
- 8.4×
Monthly cashflow live
- Estimated rent
- $1,215 medium interval (Pro) →
- Mortgage (P&I)
- −$645
- Tax from tax record
- −$140 /mo · $1,686/yr
- Insurance
- −$51
- HOA
- −$0
- Vacancy / Maint / Mgmt
- −$255
- Net cashflow
- $123
Break-even live
UW: 25.0% down · 7.5% · 30yr · 1.5% tax · 5.0% vac · 8.0% maint · 8.0% mgmt
Financing live
Cash to close
- Down payment
- $30,725
- Closing costs
- $3,687
- Reserves months
- —
- Total cash needed
- —
Loan-product check · same deal, 3 products live
Conventional
25% down · 7.5% · 30yr
- Down + closing
- —
- Monthly P&I
- —
- Monthly cashflow
- —
- DSCR
- —
- Eligible?
- —
Personal DTI + credit; lowest rate.
DSCR
20% down · 8.5% · 30yr
- Down + closing
- —
- Monthly P&I
- —
- Monthly cashflow
- —
- DSCR
- —
- Eligible?
- —
No personal income docs; deal must DSCR.
Hard money
10% down · 12.0% · 12mo
- Down + closing
- —
- Monthly P&I
- —
- Monthly cashflow
- —
- DSCR
- —
- Eligible?
- —
Short-term bridge; refi at stabilization.
Rent comps 4 comps
| Address | Beds | Baths | Sqft | Rent | $/sqft | DOM | Units | Dist |
|---|---|---|---|---|---|---|---|---|
| 640 16th Ave SW Cedar Rapids, IA | 1.0 | 1.0 | 595 | $850 | $1.43 | 43d | 2 | 0.30mi |
| 612 4th Ave SW Unit 612 Upper Cedar Rapids, IA | 2.0 | 1.0 | 616 | $2,000 | $3.25 | 20d | 1 | 0.64mi |
| 400 2nd St SW Cedar Rapids, IA | 1.0 | 1.0 | 615 | $1,195 | $1.94 | 20d | 1 | 0.69mi |
| 906 10th St SE Cedar Rapids, IA | 1.0–2.0 | 1.0–2.0 | 890 | $1,300 | $1.46 | 13d | 6 | 1.44mi |
Listing history 9 events
-
2026-04-29status Pending 528-char remark
Show marketing remark (528 chars)
* * UNDER CONTRACT - ENTERTAINING BACK UP CONTRACTS UNTIL RELEASE OF CONTINGENCIES Newer kitchen (Gas Stove, new Refrigerator, table top dishwasher), newer washer/dryer, Updated Bath, LVP flooring throughout, finished attic space with carpet and plenty of storage, bedroom or office, fenced back yard 2022, roof 2020, exterior maintenance free-vinyl and covered soffit/fascia, patio, new shed, vinyl windows - most screens in basement, Security ADT/ Ring Camera to transfer 2020 Water heater, 2008 – Furnace/Central Air.
-
2026-04-29status Pending
Show marketing remark (528 chars)
* * UNDER CONTRACT - ENTERTAINING BACK UP CONTRACTS UNTIL RELEASE OF CONTINGENCIES Newer kitchen (Gas Stove, new Refrigerator, table top dishwasher), newer washer/dryer, Updated Bath, LVP flooring throughout, finished attic space with carpet and plenty of storage, bedroom or office, fenced back yard 2022, roof 2020, exterior maintenance free-vinyl and covered soffit/fascia, patio, new shed, vinyl windows - most screens in basement, Security ADT/ Ring Camera to transfer 2020 Water heater, 2008 – Furnace/Central Air.
-
2026-04-11$122,900 Active
-
2026-04-09$122,900 Active 528-char remark
Show marketing remark (528 chars)
* * UNDER CONTRACT - ENTERTAINING BACK UP CONTRACTS UNTIL RELEASE OF CONTINGENCIES Newer kitchen (Gas Stove, new Refrigerator, table top dishwasher), newer washer/dryer, Updated Bath, LVP flooring throughout, finished attic space with carpet and plenty of storage, bedroom or office, fenced back yard 2022, roof 2020, exterior maintenance free-vinyl and covered soffit/fascia, patio, new shed, vinyl windows - most screens in basement, Security ADT/ Ring Camera to transfer 2020 Water heater, 2008 – Furnace/Central Air.
-
2017-07-05soldstatus $60,000
-
2017-07-03soldstatus $60,000
-
2016-12-05$60,000
-
2015-10-06$56,900
-
2005-05-05soldstatus $65,000
ⓘ Source: listings_history table (triggers on properties + properties_extension) + one-shot
backfill from property_details.listing_events for pre-trigger history.
Tax reassessment forecast IA · Partial reset (capped growth)
- Current annual tax
- $1,686 · $140/mo
- Projected year-2 tax
- $1,808 · $151/mo
- Expected delta
- +$122/yr (+$10/mo · 7.2%)
ⓘ Screening estimate from a state-policy table — verify with the county assessor before closing.
Climate risk First Street
- Flood 1/10 Low FEMA zone X (unshaded) · 0% chance over 30 yrs
- Wildfire 1/10 Low
- Heat 3/10 Moderate 7 d/yr ≥103°F today · 15 d/yr by 30 yrs out
- Wind 2/10 Low
- Air quality 2/10 Low 0 unhealthy d/yr today · 1 by 30 yrs out
Nearby sold comps map
Loading sold comps map…
Walkable amenities ~0.75 mi
Loading nearby amenities…
Taxation est. · year 1
- Rental income
- $14,576
- − Mortgage interest
- −$6,884
- − Property taxes
- −$1,686
- − Insurance
- −$614
- − Repairs & maintenance
- −$1,166
- − Management
- −$1,166
- − Depreciation
- −$3,575
- Taxable loss
- −$516
- Est. tax savings @ 24.0%
- +$124
- After-tax cash flow
- $1,605/yr
For passive investors: Depreciation is non-cash, so a rental often shows a tax loss while cash-flowing — sheltering income. Rental losses are passive: they offset passive income freely, and up to $25,000/yr can offset ordinary (W-2) income if you actively participate and your MAGI is under $100k (phasing out to $0 by $150k); unused losses carry forward. On sale, claimed depreciation is recaptured at up to 25%, and gains may owe capital-gains tax (a 1031 exchange can defer both). Figures are a year-1 estimate at your 24.0% rate — not tax advice; consult a CPA.
Schools (NCES district)
- District
- Cedar Rapids Community School District
- NCES district ID
- 1906540
- Math proficiency
- 50% ▼ -12.00%
- Reading proficiency
- 59% ▼ -6.00%
- Median HH income
- $53,568
- Composite
- 46.82/100
- National rank
- #2378
- State rank
- #265 of 289 in IA
Livability — Cedar Rapids
- Score
- 78/100
- State rank
- #134
- US rank
- #2474
Category grades
Schools grade is shown separately in the Schools card above.
Census & demographics
- Census place
- Cedar Rapids, IA
- County
- Linn County · 179,860 people
- City population
- 137,154
- Metro
- Cedar Rapids, IA
- Population (ZIP)
- 42,958
- Household income
- $61,870
- Rent vs Own
- Severe rent burden
- 1041.0
Population outlook (Linn County) Hauer SSP2
- Today (2025)
- 239,589 people
- By 2030
- 248,587 · +3.8%
- By 2040
- 264,817 · +10.5%
- By 2050
- 278,685 · +16.3%
- By 2075
- 311,754 · +30.1%
- By 2100
- 336,773 · +40.6%
Race, ethnicity, and origin ACS 2023
- Neighborhood character
- Predominantly White (74%)
- Race & ethnicity
- White 74% Black 10% Two or more races 10% Hispanic / Latino 7%
- Hispanic origin (detail)
- Mexican 5%
- Common ancestry
- Portuguese 3% Lithuanian 2% Romanian 2%
- Foreign-born
- 8% · Canada
- Languages at home
- 90% English-only · Spanish 3% French/Haitian/Cajun 2% Other Asian/Pacific 1%
Political lean MEDSL · Linn
- 2024 margin
- Lean D (+9.9) · D 54.2% · R 44.3% · Other 1.4%
- 2008→2024 swing
- -11.6pp toward R · 2008: 21.5pp · 2024: 9.9pp
- All cycles
- 2024: D+9.9 2020: D+13.7 2016: D+9.0 2012: D+17.6 2008: D+21.5
Not yet ingested
- Civics
- —
Market trends
- HPI YoY
- ▼ -154.96%
- Current HPI
- 241.81
- Rent YoY
- ▲ 8.79%
- Metro
- Cedar Rapids, IA
- State GDP YoY
- ▲ 2.48%
- F500 in state
- 4
Industry mix (Fortune 500 HQ in IA)
| Industry | F500 HQs | Revenue |
|---|---|---|
| Financial Services | 1 | $16B |
|
||
| Retail / Convenience | 1 | $15B |
|
||
Price history
+89.1% since first listed9 events — show timeline
- 2026-04-29 Pending — CRAAR, CDRMLS
- 2026-04-29 Pending — ICAARMLS
- 2026-04-11 Listed $122,900 ICAARMLS
- 2026-04-09 Listed $122,900 CRAAR, CDRMLS
- 2017-07-05 Sold (Public Records) $60,000 Public Records
- 2017-07-03 Sold (MLS) $60,000 CRAAR, CDRMLS
- 2016-12-05 Listed $60,000 CRAAR, CDRMLS
- 2015-10-06 Listed $56,900 CRAAR, CDRMLS
- 2005-05-05 Sold (Public Records) $65,000 Public Records
Property tax history
+3.4%/yrLatest (2025): $1,686 · +2.3% YoY. Source: county tax records.
Cash-flow waterfall
monthlySold comps — $/sqft
last 12 mo · ≤1 miLoading sold comps…