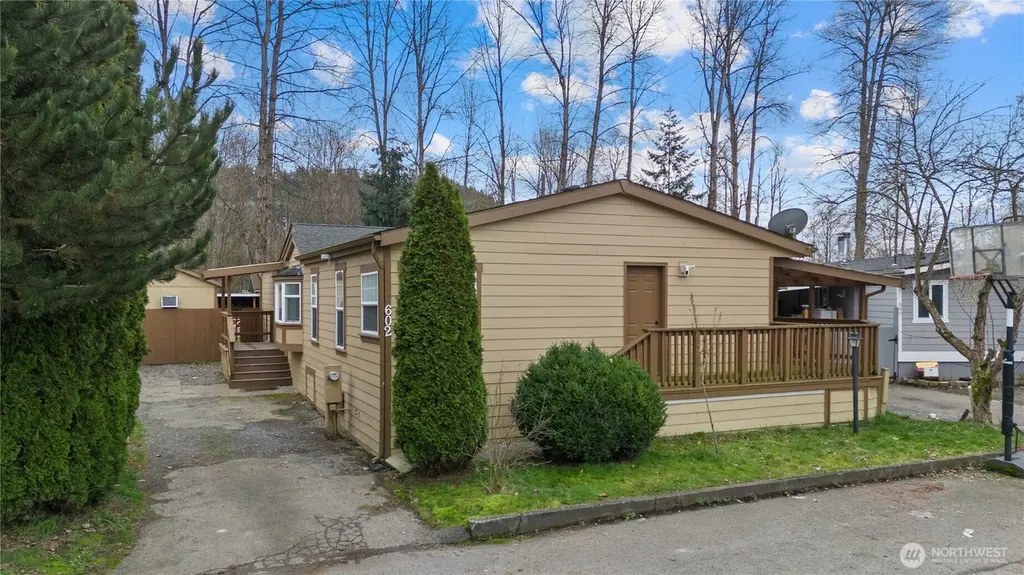
4248 A St SE #602 · Auburn, WA
Flood risk 1/10 · Minimal
- FEMA flood zone
- X (unshaded)
- Chance of flooding over 30 yrs
- 0.0%
- Est. flood insurance / yr
- $507 – $1,088
Fire risk 1/10 · Minimal
- Est. fire insurance / yr
- $604 – $1,122
Heat risk 3/10 · Minor
- Hot days now (above 88°F)
- 7 days/yr
- Hot days in 30 yrs
- 16 days/yr
Wind risk 1/10 · Minimal
- Chance of severe wind over 30 yrs
- —
Air-quality risk 7/10 · Major
- Unhealthy air days now
- 10 days/yr
- Unhealthy air days in 30 yrs
- 11 days/yr
Risk factors via First Street. Map © Google.
Why this score? — see what drove the B grade
The composite is a weighted blend of 9 inputs, each scored 0–100. Each bar is that input's sub-score; the figure is the points it added to the 100-point composite (weight × sub-score).
- Cash flow +30.0/30.0
- 1% rule +10.0/10.0
- DSCR +10.0/10.0
- ARV discount +6.2/15.0
- Schools +4.7/10.0
- Livability +4.0/5.0
- Rent growth +2.9/5.0
- Condition / age +2.5/5.0
- Appreciation +0.0/10.0
$200,000
🖨 Deal sheet 📄 Offer letter ✓ Due diligence
Listing remarks
Spacious and thoughtfully updated 3-bedroom, 2-bath manufactured home in Auburn offering over 1,500 sq ft of comfortable, single-level living. This home features a functional and open layout with generous living and dining areas, ideal for both everyday living and entertaining. The bright kitchen comes equipped with updated appliances and plenty of cabinet space, while the primary suite offers privacy and comfort with its own full bath. Recent upgrades include new siding and fresh interior paint, giving the home a clean, modern, and move-in ready feel throughout. Situated in a relaxed, easygoing community with no age restrictions, you’ll enjoy a welcoming neighborhood atmosphere. Conv
Key facts
- Updated appliances
- Bright kitchen
- New siding
Tags
Property features AI
Finance
- Financial info: Listing terms: Cash or Conventional
- HOA & community: Located in a park with clubhouse, common area, playground and recreational area; Park contains about 204 homes; Pets: see remarks; Park name: White River Estates; Land lease: $1,200
Exterior
- Parking: Uncovered parking
- Home design: Manufactured double-wide home; Single-story
- Construction: Wood construction materials; Composition roof; Manufactured house (double wide)
- Exterior features: Wood exterior products; Wood construction; Composition roof
Interior
- Bedrooms: 4 bedrooms
- Bathrooms: 2 full bathrooms
- Interior features: Entry
Neighborhood map
What this means for you Summary
Snapshot
- This is a 4-bed/2.0-bath manufactured listed at $200k.
Deal economics
- At list price, monthly cash flow is $1k ($13k/yr) — positive.
- The deal already cash-flows at list — no discount required.
- Meets the 1% rule at list price ($3k rent vs $200k).
- Recommended offer: $188k (6.0% below list) — sets the bar for market timing.
- Cap rate 12.8% vs local median 2.7% in Auburn — top-decile yield for the area; either an underpriced asset or a hidden risk that comps aren't pricing in. Stress-test before assuming the spread holds.
Location & tenants
- Location reads 81/100 on livability (#75 in WA, #1,371 nationally) — a professional / high-income tenant draw. Strengths: amenities A+, commute A+, employment A+; Watch: crime F, cost of living F.
- Auburn School District (urban): math 47% / reading 56% proficiency, ranked #125 of 291 in WA (top 43%) — acceptable for families but not a draw, mixed tenant base, ~2y average lease.
- Market conditions: Rents rising (+1.5%/yr); 171 active listings in the ZIP; 6 comparable units currently listed for rent nearby; rentals leasing fast (median 2d on market — plan ~1-2 weeks tenant-placement turnaround); solid renter incomes; 10,555 units permitted in King County in 2024 (7,119 in 5+ unit buildings).
- At $3,119/mo this rent would consume 48% of the median local household income ($79k/yr) (locally 2202% of renters already pay >50% of income on rent) — very limited rent-growth headroom before tenants either downsize or default.
Forward outlook
- Local home prices are declining (-3.0%/yr); year-one equity from $1k of loan paydown is wiped out by about $6k of value loss. Plan a longer hold.
- King County population projected at +44% by 2050 — long-run rental-demand tailwind backs the buy-and-hold thesis.
- At projected returns (-3.0% appreciation + 1.5% rent growth), your $56k cash investment doubles in ~6 years — after that, you're playing with house money.
Negotiation context
- It's been on market 74 days — a 6% lower offer ($188k) is reasonable based on typical stale-listing flexibility.
- 4 sale attempts since 24y ago with the ask held roughly flat each time — persistent listings suggest the price (not the market) is what's stuck; bring a comps-based counter.
- Current owner paid $40k; list at $200k implies a 400% gain — meaningful room to come down on a strong offer.
Questions for the listing agent
- It's been on market 74 days. Have you received any prior offers? Is the seller open to a 6% concession, seller financing, or rate buy-down credit?
- Why hasn't it sold? Are there any deal-killer items the seller is aware of (foundation, flood, title, zoning, code violations)?
- Is there a deadline driving the sale (1031 exchange, divorce, estate, relocation)? That informs how much negotiation room exists.
- Crime grade is F in this area — have there been break-ins, vandalism, or insurance claims at this property in the last 3 years? What carrier currently insures it and at what premium?
- What's the average days-on-market for RENTAL listings here right now (not sales)? A rising rental-DOM trend means longer vacancies and softer asking-rent achievability than the comps imply.
- What's the recent tenant-quality profile in this submarket — average credit score on applications, eviction rate, late-payment / NSF rate, and stable-employment percentage? A property-management company in the area should have these aggregated.
- How much new for-sale + rental construction is in the pipeline within 1–3 miles? Heavy new supply typically softens prices + rents 12–24 months out; constrained supply supports both.
Investment metrics
- 1% rule
- 1.56% ✓
- Cap rate
- 12.79%
- Cash-on-cash
- 23.19%
- DSCR
- 2.03
- GRM
- 5.3
CMA / ARV
- ARV (on-the-fly)
- $194,556
- Comps found
- 12
Show comp detail 12 sales within ~0.75 mi
| Address | Dist | Beds/Ba | Sqft | Sold | Price | $/sf | Match |
|---|---|---|---|---|---|---|---|
| 4248 A St SE #513 | 0.04mi | 4/2.0 | 1,620 (+3%) | 14mo | $189,950 | $117 | 81 |
| 4248 A St SE #421 | 0.04mi | 3/2.0 (-1) | 1,512 (-4%) | 15mo | $165,000 | $109 | 74 |
| 4248 A St SE #423 | 0.00mi | 3/2.0 (-1) | 1,446 (-8%) | 10mo | $179,950 | $124 | 74 |
| 4248 A St SE #133 | 0.04mi | 3/2.0 (-1) | 1,584 (+1%) | 22mo | $142,000 | $90 | 73 |
| 707 37th St SE #17 | 0.50mi | 3/2.0 (-1) | 1,500 (-4%) | 4mo | $147,500 | $98 | 61 |
| 4248 A St SE #518 | 0.06mi | 3/2.0 (-1) | 1,344 (-14%) | 9mo | $145,000 | $108 | 61 |
| 4248 A St SE #228 | 0.04mi | 3/2.0 (-1) | 1,344 (-14%) | 11mo | $175,000 | $130 | 60 |
| 707 37th St SE #71 | 0.50mi | 4/2.0 | 1,440 (-8%) | 6mo | $160,000 | $111 | 58 |
| 206 Birch Ln | 0.53mi | 3/2.0 (-1) | 1,524 (-3%) | 13mo | $520,000 | $341 | 55 |
| 417 2nd Ave SE | 0.75mi | 3/2.0 (-1) | 1,620 (+3%) | 10mo | $464,000 | $286 | 47 |
| 707 37th St SE #36 | 0.50mi | 3/2.0 (-1) | 1,404 (-10%) | 9mo | $215,000 | $153 | 47 |
| 111 Aspen Ln S | 0.47mi | 3/2.0 (-1) | 1,782 (+14%) | 11mo | $460,000 | $258 | 42 |
Match score weights: distance 35% · size 25% · config 20% · recency 20%. Top-matched comps best support the ARV.
Projected returns pro-forma
-3.0% appreciation · 1.51% rent growth · sell at horizon
- IRR
- 14.5%
- Equity multiple
- 1.57×
- Total profit
- $31,950
- Equity at exit
- $29,821
- IRR
- 22.1%
- Equity multiple
- 2.76×
- Total profit
- $98,407
- Equity at exit
- $17,292
Cash invested: $56,000 (down + closing). Projections, not guarantees.
Landlord ↔ Tenant lean methodology
- Overall (STATE)
- 28 Tenant-Leaning
- State Washington
- 28 Tenant-Leaning · D+8
- County
- — inherits STATE
- City
- — inherits STATE
ZIP-level market 98002
- Rents YoY
- 1.5%
- Active inventory
- 171
- Price-to-rent
- 5.3×
Monthly cashflow live
- Estimated rent
- $3,119 high interval (Pro) →
- Mortgage (P&I)
- −$1,049
- Tax est. 1.5%
- −$250 /mo · $3,000/yr
- Insurance
- −$83
- HOA
- −$0
- Vacancy / Maint / Mgmt
- −$655
- Net cashflow
- $1,082
Break-even live
UW: 25.0% down · 7.5% · 30yr · 1.5% tax · 5.0% vac · 8.0% maint · 8.0% mgmt
Financing live
Cash to close
- Down payment
- $50,000
- Closing costs
- $6,000
- Reserves months
- —
- Total cash needed
- —
Loan-product check · same deal, 3 products live
Conventional
25% down · 7.5% · 30yr
- Down + closing
- —
- Monthly P&I
- —
- Monthly cashflow
- —
- DSCR
- —
- Eligible?
- —
Personal DTI + credit; lowest rate.
DSCR
20% down · 8.5% · 30yr
- Down + closing
- —
- Monthly P&I
- —
- Monthly cashflow
- —
- DSCR
- —
- Eligible?
- —
No personal income docs; deal must DSCR.
Hard money
10% down · 12.0% · 12mo
- Down + closing
- —
- Monthly P&I
- —
- Monthly cashflow
- —
- DSCR
- —
- Eligible?
- —
Short-term bridge; refi at stabilization.
Rent comps 6 comps
| Address | Beds | Baths | Sqft | Rent | $/sqft | DOM | Units | Dist |
|---|---|---|---|---|---|---|---|---|
| 4716 Mill Pond Dr SE Apt 1001 Auburn, WA | 3.0 | 2.5 | 1673 | $2,900 | $1.73 | 10d | 1 | 0.46mi |
| 102 Hawthorne Ave S Pacific, WA | 3.0 | 1.0 | 1285 | $2,950 | $2.30 | 1d | 1 | 0.80mi |
| 404 4th Ave SE Pacific, WA | 3.0 | 2.0 | 2006 | $3,600 | $1.79 | 1d | 1 | 0.92mi |
| 1105 63rd St SE Unit C Auburn, WA | 3.0 | 2.5 | 1372 | $4,000 | $2.92 | 1d | 1 | 1.38mi |
| 131 Elise Ct Unit NA Pacific, WA | 3.0 | 2.0 | 1668 | $3,000 | $1.80 | 1d | 1 | 1.40mi |
| 110 2nd Ave S Algona, WA | 3.0 | 2.0 | 1530 | $3,600 | $2.35 | 1d | 1 | 1.46mi |
Listing history 11 events
-
2026-06-01statusdays on market $200,000 Pending 74 DOM
-
2026-05-31days on market $200,000 Active 73 DOM
-
2026-03-19$200,000 Active
-
2009-08-19soldstatus $40,000 Sold
-
2009-08-10status Pending
-
2009-05-28price $44,500
-
2009-05-07$49,500
-
2005-04-27soldstatus $48,000
-
2005-03-14$49,950
-
2002-06-14soldstatus $61,500
-
2002-01-14$64,900
ⓘ Source: listings_history table (triggers on properties + properties_extension) + one-shot
backfill from property_details.listing_events for pre-trigger history.
Climate risk First Street
- Flood 1/10 Low FEMA zone X (unshaded) · 0% chance over 30 yrs
- Wildfire 1/10 Low
- Heat 3/10 Moderate 7 d/yr ≥88°F today · 16 d/yr by 30 yrs out
- Wind 1/10 Low
- Air quality 7/10 Severe 10 unhealthy d/yr today · 11 by 30 yrs out
Nearby sold comps map
Loading sold comps map…
Walkable amenities ~0.75 mi
Loading nearby amenities…
Taxation est. · year 1
- Rental income
- $37,432
- − Mortgage interest
- −$11,203
- − Property taxes
- −$3,000
- − Insurance
- −$1,000
- − Repairs & maintenance
- −$2,995
- − Management
- −$2,995
- − Depreciation
- −$5,818
- Taxable income
- $10,421
- Est. tax owed @ 24.0%
- −$2,501
- After-tax cash flow
- $10,484/yr
For passive investors: Depreciation is non-cash, so a rental often shows a tax loss while cash-flowing — sheltering income. Rental losses are passive: they offset passive income freely, and up to $25,000/yr can offset ordinary (W-2) income if you actively participate and your MAGI is under $100k (phasing out to $0 by $150k); unused losses carry forward. On sale, claimed depreciation is recaptured at up to 25%, and gains may owe capital-gains tax (a 1031 exchange can defer both). Figures are a year-1 estimate at your 24.0% rate — not tax advice; consult a CPA.
Schools (NCES district)
- District
- Auburn School District
- NCES district ID
- 5300300
- Math proficiency
- 47% ▼ -3.00%
- Reading proficiency
- 56% ▼ -1.00%
- Median HH income
- $58,048
- Composite
- 46.73/100
- National rank
- #5240
- State rank
- #125 of 291 in WA
Livability — Auburn
- Score
- 81/100
- State rank
- #75
- US rank
- #1371
Category grades
Schools grade is shown separately in the Schools card above.
Census & demographics
- Census place
- Auburn, WA
- County
- King County · 2,251,916 people
- City population
- 74,969
- Metro
- Seattle-Tacoma-Bellevue, WA
- Population (ZIP)
- 37,509
- Household income
- $78,684
- Rent vs Own
- Severe rent burden
- 2202.0
Population outlook (King County) Hauer SSP2
- Today (2025)
- 2,576,485 people
- By 2030
- 2,803,316 · +8.8%
- By 2040
- 3,255,921 · +26.4%
- By 2050
- 3,706,444 · +43.9%
- By 2075
- 4,746,063 · +84.2%
- By 2100
- 5,407,730 · +109.9%
Race, ethnicity, and origin ACS 2023
- Neighborhood character
- Highly diverse neighborhood (Simpson 0.72)
- Race & ethnicity
- White 46% Hispanic / Latino 24% Two or more races 13% Black 12% Asian 6% Pacific Islander 4% Native American 2%
- Hispanic origin (detail)
- Mexican 20%
- Common ancestry
- Portuguese 4% Subsaharan African 4% Lithuanian 3%
- Foreign-born
- 24% · Canada, Vietnam
- Languages at home
- 63% English-only · Spanish 19% Russian/Polish/Slavic 6% Other Asian/Pacific 3%
Political lean MEDSL · King
- 2024 margin
- Solid D (+51.7) · D 74.2% · R 22.5% · Other 3.4%
- 2008→2024 swing
- +9.6pp toward D · 2008: 42.1pp · 2024: 51.7pp
- All cycles
- 2024: D+51.7 2020: D+52.7 2016: D+50.4 2012: D+39.9 2008: D+42.1
Not yet ingested
- Civics
- —
Market trends
- HPI YoY
- ▼ -677.96%
- Current HPI
- 298.0849
- Rent YoY
- ▲ 1.51%
- Metro
- Seattle-Tacoma-Bellevue, WA
- State GDP YoY
- ▲ 4.65%
- F500 in state
- 22
Industry mix (Fortune 500 HQ in WA)
| Industry | F500 HQs | Revenue |
|---|---|---|
| Retail | 2 | $269B |
|
||
| Technology / Retail | 1 | $638B |
|
||
| Technology | 1 | $245B |
|
||
| Telecommunications | 1 | $38B |
|
||
| Food / Beverage | 1 | $36B |
|
||
| Automotive / Trucks | 1 | $34B |
|
||
Price history
+208.2% since first listed9 events — show timeline
- 2026-03-19 Listed $200,000 NWMLS as Distributed by MLS Grid
- 2009-08-19 Sold (MLS) $40,000 NWMLS as Distributed by MLS Grid
- 2009-08-10 Pending — NWMLS as Distributed by MLS Grid
- 2009-05-28 Price Changed $44,500 NWMLS as Distributed by MLS Grid
- 2009-05-07 Listed $49,500 NWMLS as Distributed by MLS Grid
- 2005-04-27 Sold (MLS) $48,000 NWMLS as Distributed by MLS Grid
- 2005-03-14 Listed $49,950 NWMLS as Distributed by MLS Grid
- 2002-06-14 Sold (MLS) $61,500 NWMLS as Distributed by MLS Grid
- 2002-01-14 Listed $64,900 NWMLS as Distributed by MLS Grid
Cash-flow waterfall
monthlySold comps — $/sqft
last 12 mo · ≤1 miLoading sold comps…