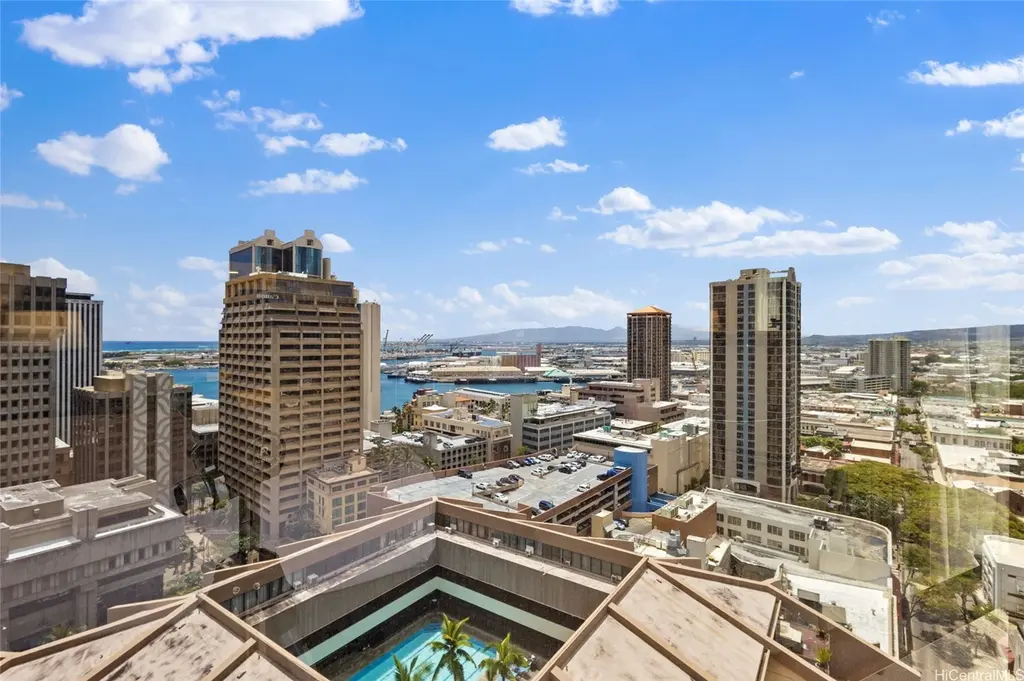
1088 Bishop St #2204 · Urban Honolulu, HI
Flood risk 1/10 · Minimal
- FEMA flood zone
- X (unshaded)
- Chance of flooding over 30 yrs
- 0.0%
- Est. flood insurance / yr
- $507 – $1,088
Fire risk No data
- Est. fire insurance / yr
- —
Heat risk No data
- Hot days now (above threshold)
- —
- Hot days in 30 yrs
- —
Wind risk No data
- Chance of severe wind over 30 yrs
- —
Air-quality risk 1/10 · Minimal
- Unhealthy air days now
- —
- Unhealthy air days in 30 yrs
- —
Risk factors via First Street. Map © Google.
Why this score? — see what drove the D grade
The composite is a weighted blend of 9 inputs, each scored 0–100. Each bar is that input's sub-score; the figure is the points it added to the 100-point composite (weight × sub-score).
- Cash flow +9.1/30.0
- ARV discount +7.5/15.0
- 1% rule +6.8/10.0
- Appreciation +4.6/10.0
- Schools +3.7/10.0
- Rent growth +2.7/5.0
- DSCR +2.5/10.0
- Livability +2.5/5.0
- Condition / age +2.5/5.0
$279,000
🖨 Deal sheet (PDF) 📄 Offer letter ✓ Due diligence
Listing remarks MLS
Seldom available 04 unit with fabuluous ocean/harbor views, located in the heart of downtown. Close to everything. BMX mixed use allows residential, business or hotel use. Parking is included too! Hurry! This unit will sell fast! Back on the market 8/20/2007.
Key facts
- High-floor residence
- Pool
- Sun deck
Tags
Property features AI
Finance
- HOA & community: Association fee includes common areas, cable TV, hot water, internet, sewer and water; Association management provided; Association fee: $193; Maintenance expense: $745
Exterior
- Parking: Assigned covered parking (1 space)
- Security: Closed-circuit cameras; Key card entry; On-site security guard
- Utilities: Fee simple land tenure
- Home design: Condo in Executive Centre; Entry on level 22; Good condition
- Construction: Double wall construction; Slab foundation
- Exterior features: Community spa; Deck/porch; Patio; Pool; Trash chute; Has view
Interior
- Flooring: Carpet
- Bathrooms: 1 full bathroom
- Heating & cooling: Central air conditioning
- Interior features: Furnished; Full bath on main level
- Laundry & utility: Community laundry facilities
Neighborhood map
What this means for you Summary
Snapshot
- This is a 1-bed/1.0-bath condo listed at $279k.
Deal economics
- At list price, monthly cash flow is $-215 ($-3k/yr) — negative.
- To cash-flow at today's rent, offer at most $241k (13.6% below list).
- Meets the 1% rule at list price ($3k rent vs $279k).
- Recommended offer: $241k (13.6% below list) — sets the bar for cash-flow.
- Cap rate 5.4% vs local median 1.5% in Urban Honolulu — top-decile yield for the area; either an underpriced asset or a hidden risk that comps aren't pricing in. Stress-test before assuming the spread holds.
Location & tenants
- Location reads: area grade D — affects rentability + tenant quality, not the cash-flow math above.
- Hawaii Department Of Education (suburban): math 32% / reading 50% proficiency, ranked #1 of 1 in HI (top 100%) — families likely to look elsewhere, expect single-tenant / working-renter base with shorter leases.
- Zoned schools: Royal Elementary School (math 27% / reading 32%, grade F, #122 of 183 statewide, top 71%, 325 students, 65% FRL); Princess Ruth Keelikolani Middle School (math 8% / reading 23%, grade F, #42 of 42 statewide, top 100%, 324 students, 69% FRL); President William Mckinley High School (math 28% / reading 69%, grade D, #13 of 43 statewide, top 33%, 1,502 students, 50% FRL) — zoned schools average 61% FRL vs 39% district-wide (22 pts higher); higher-poverty schools than district average — tighter screening recommended.
- Market conditions: Rents flat; 200 active listings in the ZIP; 5 comparable units currently listed for rent nearby; rentals at typical pace (median 19d on market — plan ~3-4 weeks tenant-placement turnaround); solid renter incomes; 1,638 units permitted in Honolulu County in 2024 (793 in 5+ unit buildings).
- This rent runs 43% of the median local income ($92k/yr) — at the standard rent-burdened threshold; future hikes will face affordability resistance.
Forward outlook
- Local home prices are declining (-0.7%/yr); year-one equity from $2k of loan paydown is wiped out by about $2k of value loss. Plan a longer hold.
- Honolulu County population projected at +17% by 2050 — long-run rental-demand tailwind backs the buy-and-hold thesis.
Negotiation context
- It's been on market 24 days — a 2% lower offer ($275k) is reasonable based on typical stale-listing flexibility.
- 2 sale attempts since 19y ago with the ask held roughly flat each time — persistent listings suggest the price (not the market) is what's stuck; bring a comps-based counter.
- Current owner paid $104k; list at $279k implies a 168% gain — meaningful room to come down on a strong offer.
Risks & watch-outs
- Watch-outs: HOA is 29% of rent.
Questions for the listing agent
- What do current leases actually rent for vs. the listed asking? Can we see a recent rent roll and the last 12 months of T-12 income?
- What does the HOA fee cover, when was the last increase, and are there any pending special assessments or reserve-fund shortfalls?
- Any open or pending special assessments — roof, HVAC, plumbing, elevator, façade? What's the per-unit balance and payoff schedule, and is the seller paying it off at close or rolling it to the buyer?
- Is there a deadline driving the sale (1031 exchange, divorce, estate, relocation)? That informs how much negotiation room exists.
- The area grade is low — what's the realistic commute time and amenity access for the typical tenant pool here? Any planned neighborhood developments (good or bad) we should know about?
- What's the average days-on-market for RENTAL listings here right now (not sales)? A rising rental-DOM trend means longer vacancies and softer asking-rent achievability than the comps imply.
- What's the recent tenant-quality profile in this submarket — average credit score on applications, eviction rate, late-payment / NSF rate, and stable-employment percentage? A property-management company in the area should have these aggregated.
- How much new apartment / multifamily construction is in the pipeline within 1–3 miles? Heavy new supply (>2% of stock underway) typically softens rents 12–24 months out; light construction supports rent growth.
Investment metrics
- 1% rule
- 1.18% ✓
- Cap rate
- 5.37%
- Cash-on-cash
- -3.31%
- DSCR
- 0.85
- GRM
- 7.1
CMA / ARV
No comps found within radius.
Projected returns pro-forma
-0.73% appreciation · 0.63% rent growth · sell at horizon
- IRR
- -11.4%
- Equity multiple
- 0.51×
- Total profit
- $-38,363
- Equity at exit
- $71,000
- IRR
- -7.7%
- Equity multiple
- 0.33×
- Total profit
- $-52,324
- Equity at exit
- $77,715
Cash invested: $78,120 (down + closing). Projections, not guarantees.
Landlord ↔ Tenant lean methodology
- Overall (STATE)
- 37 Tenant-Leaning
- State Hawaii
- 37 Tenant-Leaning · D+13
- County
- — inherits STATE
- City
- — inherits STATE
ZIP-level market 96813
- Home prices YoY
- -0.3%
- Rents YoY
- 0.6%
- Active inventory
- 200
- Price-to-rent
- 7.1×
Monthly cashflow live
- Estimated rent
- $3,288 high interval (Pro) →
- Mortgage (P&I)
- −$1,463
- Tax from tax record
- −$295 /mo · $3,544/yr
- Insurance
- −$116
- HOA
- −$938
- Vacancy / Maint / Mgmt
- −$690
- Net cashflow
- $-215
Break-even live
Sensitivity live
| Price | -10% $-58 | -5% $-137 | +0% $-215 | +5% $-294 | +10% $-373 |
|---|---|---|---|---|---|
| Rent | -10% $-475 | -5% $-345 | +0% $-215 | +5% $-86 | +10% $44 |
| Rate | -1.0pp $-75 | -0.5pp $-145 | base $-215 | +0.5pp $-288 | +1.0pp $-361 |
UW: 25.0% down · 7.5% · 30yr · 1.5% tax · 5.0% vac · 8.0% maint · 8.0% mgmt
Financing live
Cash to close
- Down payment
- $69,750
- Closing costs
- $8,370
- Reserves months
- —
- Total cash needed
- —
Loan-product check · same deal, 3 products live
Conventional
25% down · 7.5% · 30yr
- Down + closing
- —
- Monthly P&I
- —
- Monthly cashflow
- —
- DSCR
- —
- Eligible?
- —
Personal DTI + credit; lowest rate.
DSCR
20% down · 8.5% · 30yr
- Down + closing
- —
- Monthly P&I
- —
- Monthly cashflow
- —
- DSCR
- —
- Eligible?
- —
No personal income docs; deal must DSCR.
Hard money
10% down · 12.0% · 12mo
- Down + closing
- —
- Monthly P&I
- —
- Monthly cashflow
- —
- DSCR
- —
- Eligible?
- —
Short-term bridge; refi at stabilization.
Rent comps 5 comps
| Address | Beds | Baths | Sqft | Rent | $/sqft | DOM | Units | Dist |
|---|---|---|---|---|---|---|---|---|
| 987 Queen St Honolulu, HI | 2.0 | 1.0–2.0 | 554 | $3,925 | $7.08 | 19d | 9 | 1.02mi |
| 987 Queen St Honolulu, HI | 2.0 | 1.0–2.0 | 554 | $4,000 | $7.22 | 18d | 8 | 1.02mi |
| 987 Queen St Honolulu, HI | 1.0 | 1.0 | 453 | $3,800 | $8.39 | 12d | 9 | 1.02mi |
| 1000 Auahi St Honolulu, HI | 2.0 | 1.0–2.0 | 629 | $4,425 | $7.03 | 25d | 2 | 1.06mi |
| 1568 Pensacola St Honolulu, HI | 1.0–2.0 | 1.0 | 523 | $2,280 | $4.36 | 25d | 1 | 1.25mi |
HOA detail condo
- Monthly dues
- $938 · $11,256/yr
- Assessments
- None detected in remarks — confirm with the listing agent.
Listing history 25 events
-
2026-06-21days on market $279,000 Active 24 DOM
-
2026-06-18days on market $279,000 Active 21 DOM
-
2026-06-17days on market $279,000 Active 20 DOM
-
2026-06-16days on market $279,000 Active 19 DOM
-
2026-06-15days on market $279,000 Active 18 DOM
-
2026-06-13days on market $279,000 Active 16 DOM
-
2026-06-13days on market $279,000 Active 15 DOM
-
2026-06-10days on market $279,000 Active 13 DOM
-
2026-06-09days on market $279,000 Active 12 DOM
-
2026-06-08days on market $279,000 Active 11 DOM
-
2026-06-07days on market $279,000 Active 10 DOM
-
2026-06-05days on market $279,000 Active 7 DOM
-
2026-06-03days on market $279,000 Active 6 DOM
-
2026-06-02days on market $279,000 Active 5 DOM
-
2026-06-01days on market $279,000 Active 4 DOM
-
2026-05-31days on market $279,000 Active 3 DOM
-
2026-05-28$279,000 Active
-
2015-02-20soldstatus $104,043
-
2014-11-07soldstatus $104,043
-
2007-09-18soldstatus $202,500 259-char remark
Show marketing remark (259 chars)
Seldom available 04 unit with fabuluous ocean/harbor views, located in the heart of downtown. Close to everything. BMX mixed use allows residential, business or hotel use. Parking is included too! Hurry! This unit will sell fast! Back on the market 8/20/2007.
-
2007-09-18soldstatus $202,500
Show marketing remark (259 chars)
Seldom available 04 unit with fabuluous ocean/harbor views, located in the heart of downtown. Close to everything. BMX mixed use allows residential, business or hotel use. Parking is included too! Hurry! This unit will sell fast! Back on the market 8/20/2007.
-
2007-07-06$209,000 259-char remark
Show marketing remark (259 chars)
Seldom available 04 unit with fabuluous ocean/harbor views, located in the heart of downtown. Close to everything. BMX mixed use allows residential, business or hotel use. Parking is included too! Hurry! This unit will sell fast! Back on the market 8/20/2007.
-
2004-05-18soldstatus $400,000
-
2001-03-14soldstatus $52,000
-
2000-07-28soldstatus $35,000,000
ⓘ Source: listings_history table (triggers on properties + properties_extension) + one-shot
backfill from property_details.listing_events for pre-trigger history.
Tax reassessment forecast HI · Partial reset (capped growth)
- Current annual tax
- $3,544 · $295/mo
- Projected year-2 tax
- $3,544 · $295/mo
- Expected delta
- $0/yr ($0/mo · 0.0%)
ⓘ Screening estimate from a state-policy table — verify with the county assessor before closing.
Climate risk First Street
- Flood 1/10 Low FEMA zone X (unshaded) · 0% chance over 30 yrs
- Air quality 1/10 Low
Nearby sold comps map
Loading sold comps map…
Walkable amenities ~0.75 mi
Loading nearby amenities…
Taxation est. · year 1
- Rental income
- $39,451
- − Mortgage interest
- −$15,628
- − Property taxes
- −$3,544
- − Insurance
- −$1,395
- − Repairs & maintenance
- −$3,156
- − Management
- −$3,156
- − HOA
- −$11,256
- − Depreciation
- −$8,116
- Taxable loss
- −$6,801
- Est. tax savings @ 24.0%
- +$1,632
- After-tax cash flow
- $-954/yr
For passive investors: Depreciation is non-cash, so a rental often shows a tax loss while cash-flowing — sheltering income. Rental losses are passive: they offset passive income freely, and up to $25,000/yr can offset ordinary (W-2) income if you actively participate and your MAGI is under $100k (phasing out to $0 by $150k); unused losses carry forward. On sale, claimed depreciation is recaptured at up to 25%, and gains may owe capital-gains tax (a 1031 exchange can defer both). Figures are a year-1 estimate at your 24.0% rate — not tax advice; consult a CPA.
Schools (NCES district)
- District
- Hawaii Department Of Education
- NCES district ID
- 1500030
- Math proficiency
- 32% ▼ -10.00%
- Reading proficiency
- 50% ▼ -3.00%
- Median HH income
- $69,005
- Composite
- 37.07/100
- National rank
- #4504
- State rank
- #1 of 1 in HI
Livability — Urban Honolulu
No livability data for this city. (Only ~50 U.S. cities are tracked.)
Census & demographics
- Census place
- Urban Honolulu, HI
- County
- Honolulu County · 963,448 people
- City population
- 309,956
- Metro
- Urban Honolulu, HI
- Population (ZIP)
- 26,766
- Household income
- $91,690
- Rent vs Own
- Severe rent burden
- 1338.0
Population outlook (Honolulu County) Hauer SSP2
- Today (2025)
- 1,072,641 people
- By 2030
- 1,110,460 · +3.5%
- By 2040
- 1,181,593 · +10.2%
- By 2050
- 1,257,584 · +17.2%
- By 2075
- 1,501,120 · +39.9%
- By 2100
- 1,764,430 · +64.5%
Race, ethnicity, and origin ACS 2023
- Neighborhood character
- Highly diverse neighborhood (Simpson 0.74)
- Race & ethnicity
- Asian 48% Two or more races 21% White 15% Pacific Islander 9% Hispanic / Latino 7% Black 3%
- Hispanic origin (detail)
- Mexican 3% Puerto Rican 3%
- Common ancestry
- Russian 2% Romanian 1% Lithuanian 1%
- Foreign-born
- 23% · South Korea, China, Vietnam
- Languages at home
- 72% English-only · Other Asian/Pacific 10% Chinese 7% Korean 5%
Political lean MEDSL · Honolulu
- 2024 margin
- Strong D (+21.6) · D 59.9% · R 38.3% · Other 1.8%
- 2008→2024 swing
- -19.4pp toward R · 2008: 41.1pp · 2024: 21.6pp
- All cycles
- 2024: D+21.6 2020: D+26.9 2016: D+29.9 2012: D+39.1 2008: D+41.1
Not yet ingested
- Civics
- —
Market trends
- HPI YoY
- ▼ -0.73%
- Current HPI
- 231.8414
- Rent YoY
- ▲ 0.63%
- Metro
- Urban Honolulu, HI
- State GDP YoY
- —
- F500 in state
- 0
Price history
-99.2% since first listed9 events — show timeline
- 2026-05-28 Listed $279,000 HiCentral MLS
- 2015-02-20 Sold (Public Records) $104,043 Public Records
- 2014-11-07 Sold (Public Records) $104,043 Public Records
- 2007-09-18 Sold (Public Records) $202,500 Public Records
- 2007-09-18 Sold (MLS) $202,500 HiCentral MLS
- 2007-07-06 Listed $209,000 HiCentral MLS
- 2004-05-18 Sold (Public Records) $400,000 Public Records
- 2001-03-14 Sold (Public Records) $52,000 Public Records
- 2000-07-28 Sold (Public Records) $35,000,000 Public Records
Property tax history
+17.4%/yrLatest (2022): $3,544 · -2.3% YoY. Source: county tax records.
Cash-flow waterfall
monthlySold comps — $/sqft
last 12 mo · ≤1 miLoading sold comps…