 🏗️ New Construction
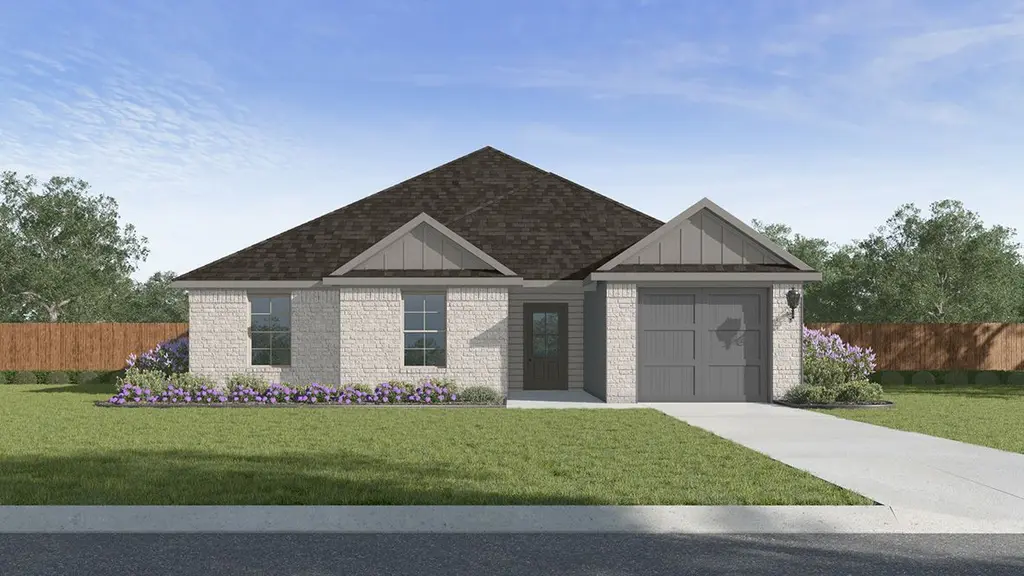
Fallon Plan · Lafayette, LA
Flood risk 1/10 · Minimal
- FEMA flood zone
- X (unshaded)
- Chance of flooding over 30 yrs
- 0.0%
- Est. flood insurance / yr
- $507 – $1,088
Fire risk 1/10 · Minimal
- Est. fire insurance / yr
- $1,269 – $2,357
Heat risk 8/10 · Major
- Hot days now (above 109°F)
- 7 days/yr
- Hot days in 30 yrs
- 20 days/yr
Wind risk 9/10 · Severe
- Chance of severe wind over 30 yrs
- 99.0%
Air-quality risk 2/10 · Minimal
- Unhealthy air days now
- 1 days/yr
- Unhealthy air days in 30 yrs
- 1 days/yr
Risk factors via First Street. Map © Google.
Why this score? — see what drove the B- grade
The composite is a weighted blend of 9 inputs, each scored 0–100. Each bar is that input's sub-score; the figure is the points it added to the 100-point composite (weight × sub-score).
- Cash flow +26.6/30.0
- DSCR +9.1/10.0
- ARV discount +7.5/15.0
- 1% rule +7.1/10.0
- Rent growth +4.3/5.0
- Condition / age +3.8/5.0
- Schools +3.6/10.0
- Livability +3.5/5.0
- Appreciation +0.0/10.0
$225,500
🖨 Deal sheet 📄 Offer letter ✓ Due diligence
Listing remarks
Experience the Fallon! This 4 bed, 2 bath home can be found Cedar Creek in Lafayette, Louisiana. This thoughtfully designed plan offers a functional and comfortable layout ideal for modern living. At the heart of the home is an open concept living area that seamlessly connects to the dining area and kitchen, creating an inviting space for entertainment and everyday living. The kitchen is efficiently laid out with generous counter space, center island, a pantry for extra storage, and stainless-steel appliances. A dedicated utility room adds practicality with space for laundry and household organization. The primary bedroom is privately situated and includes a spacious walk-in closet and an e
Key facts
- Walk-in closet
- En-suite bath
- Center island
Tags
Property features AI
Finance
- Financial info: List price $225,500
Exterior
- Parking: 1 garage space; 1 parking space total
- Home design: Plan: Fallon; New construction plan
Interior
- Bedrooms: 4 bedrooms
- Bathrooms: 2 full bathrooms
- Interior features: Living area of 1682 (as provided)
Neighborhood map
What this means for you Summary
Snapshot
- This is a 4-bed/2.0-bath single-family listed at $226k. Condition is rated good.
Deal economics
- At list price, monthly cash flow is $614 ($7k/yr) — positive.
- The deal already cash-flows at list — no discount required.
- Meets the 1% rule at list price ($3k rent vs $226k).
- Cap rate 9.5% vs local median 4.7% in Lafayette — top-decile yield for the area; either an underpriced asset or a hidden risk that comps aren't pricing in. Stress-test before assuming the spread holds.
Location & tenants
- Location reads 70/100 on livability (#63 in LA) — a middle-class / working-renter tenant base. Strengths: cost of living A+, housing A+, health & safety A+; Watch: amenities C-, employment C-, crime F.
- Lafayette Parish (urban): math 38% / reading 46% proficiency, ranked #19 of 98 in LA (top 19%) — families likely to look elsewhere, expect single-tenant / working-renter base with shorter leases.
- Market conditions: Rents rising fast (+7.3%/yr); 246 active listings in the ZIP; 4 comparable units currently listed for rent nearby; rentals leasing fast (median 13d on market — plan ~1-2 weeks tenant-placement turnaround); lower-income renter base — watch delinquency; 1,585 units permitted in Lafayette Parish in 2024 (10 in 5+ unit buildings).
- At $2,779/mo this rent would consume 100% of the median local household income ($33k/yr) (locally 2089% of renters already pay >50% of income on rent) — very limited rent-growth headroom before tenants either downsize or default.
Forward outlook
- Local home prices are declining (-3.0%/yr); year-one equity from $2k of loan paydown is wiped out by about $7k of value loss. Plan a longer hold.
- Lafayette County population projected at +34% by 2050 — long-run rental-demand tailwind backs the buy-and-hold thesis.
- At projected returns (-3.0% appreciation + 7.3% rent growth), your $64k cash investment doubles in ~7 years — after that, you're playing with house money.
Negotiation context
- Only 1 days on market — expect competitive offers; lowballing is unlikely to land.
Risks & watch-outs
- Climate carrying-cost: severe wind risk, 99% chance of damaging wind over 30y; extreme-heat days projected 7→20/yr by 2055 (HVAC capex compounding) — expect insurance premiums to compound above CPI over the hold.
Questions for the listing agent
- Is there a deadline driving the sale (1031 exchange, divorce, estate, relocation)? That informs how much negotiation room exists.
- Schools are B-rated — typically a magnet for longer-tenancy family renters. What's the average tenant stay here, and is there a school-zone premium baked into asking?
- Crime grade is F in this area — have there been break-ins, vandalism, or insurance claims at this property in the last 3 years? What carrier currently insures it and at what premium?
- What's the average days-on-market for RENTAL listings here right now (not sales)? A rising rental-DOM trend means longer vacancies and softer asking-rent achievability than the comps imply.
- What's the recent tenant-quality profile in this submarket — average credit score on applications, eviction rate, late-payment / NSF rate, and stable-employment percentage? A property-management company in the area should have these aggregated.
- How much new for-sale + rental construction is in the pipeline within 1–3 miles? Heavy new supply typically softens prices + rents 12–24 months out; constrained supply supports both.
Investment metrics
- 1% rule
- 1.21% ✓
- Cap rate
- 9.52%
- Cash-on-cash
- 11.51%
- DSCR
- 1.51
- GRM
- 6.9
CMA / ARV
- ARV (on-the-fly)
- $228,752
- Comps found
- 12
Show comp detail 12 sales within ~0.75 mi
| Address | Dist | Beds/Ba | Sqft | Sold | Price | $/sf | Match |
|---|---|---|---|---|---|---|---|
| 423 Starlight Dr | 0.10mi | 4/2.0 | 1,700 (+1%) | 0mo | $230,000 | $135 | 93 |
| 335 White Pine Dr | 0.17mi | 4/2.0 | 1,704 (+1%) | 1mo | $237,000 | $139 | 89 |
| 319 White Pine Dr | 0.17mi | 3/2.0 (-1) | 1,613 (-4%) | 2mo | $235,500 | $146 | 78 |
| 336 White Pine Dr | 0.16mi | 3/2.0 (-1) | 1,616 (-4%) | 3mo | $242,000 | $150 | 78 |
| 333 White Pine Dr | 0.17mi | 3/2.0 (-1) | 1,613 (-4%) | 2mo | $235,000 | $146 | 78 |
| 204 White Pine Dr | 0.14mi | 4/2.0 | 1,786 (+6%) | 6mo | $236,000 | $132 | 78 |
| 323 White Pine Dr | 0.17mi | 4/2.0 | 1,874 (+11%) | 1mo | $249,000 | $133 | 72 |
| 328 White Pine Dr | 0.17mi | 4/2.0 | 1,874 (+11%) | 1mo | $254,500 | $136 | 72 |
| 120 Red Pine Dr | 0.19mi | 4/2.0 | 1,874 (+11%) | 6mo | $239,900 | $128 | 67 |
| 334 White Pine Dr | 0.16mi | 3/2.0 (-1) | 1,447 (-14%) | 6mo | $228,000 | $158 | 59 |
| 106 Kingswood Dr | 0.57mi | 3/2.0 (-1) | 1,576 (-6%) | 2mo | $169,000 | $107 | 56 |
| 102 Kingswood Dr | 0.59mi | 3/2.0 (-1) | 1,775 (+6%) | 4mo | $215,000 | $121 | 54 |
Match score weights: distance 35% · size 25% · config 20% · recency 20%. Top-matched comps best support the ARV.
Projected returns pro-forma
-3.0% appreciation · 7.35% rent growth · sell at horizon
- IRR
- 5.7%
- Equity multiple
- 1.23×
- Total profit
- $14,804
- Equity at exit
- $34,108
- IRR
- 18.7%
- Equity multiple
- 2.88×
- Total profit
- $120,448
- Equity at exit
- $19,778
Cash invested: $64,051 (down + closing). Projections, not guarantees.
Landlord ↔ Tenant lean methodology
- Overall (STATE)
- 90 Strongly Landlord-Friendly
- State Louisiana
- 90 Strongly Landlord-Friendly · R+12
- County
- — inherits STATE
- City
- — inherits STATE
ZIP-level market 70501
- Rents YoY
- 7.3%
- Active inventory
- 246
- Price-to-rent
- 6.8×
Monthly cashflow live
- Estimated rent
- $2,779 medium interval (Pro) →
- Mortgage (P&I)
- −$1,200
- Tax est. 1.5%
- −$286 /mo · $3,431/yr
- Insurance
- −$95
- HOA
- −$0
- Vacancy / Maint / Mgmt
- −$584
- Net cashflow
- $614
Break-even live
UW: 25.0% down · 7.5% · 30yr · 1.5% tax · 5.0% vac · 8.0% maint · 8.0% mgmt
Financing live
Cash to close
- Down payment
- $57,188
- Closing costs
- $6,863
- Reserves months
- —
- Total cash needed
- —
Loan-product check · same deal, 3 products live
Conventional
25% down · 7.5% · 30yr
- Down + closing
- —
- Monthly P&I
- —
- Monthly cashflow
- —
- DSCR
- —
- Eligible?
- —
Personal DTI + credit; lowest rate.
DSCR
20% down · 8.5% · 30yr
- Down + closing
- —
- Monthly P&I
- —
- Monthly cashflow
- —
- DSCR
- —
- Eligible?
- —
No personal income docs; deal must DSCR.
Hard money
10% down · 12.0% · 12mo
- Down + closing
- —
- Monthly P&I
- —
- Monthly cashflow
- —
- DSCR
- —
- Eligible?
- —
Short-term bridge; refi at stabilization.
Rent comps 4 comps
| Address | Beds | Baths | Sqft | Rent | $/sqft | DOM | Units | Dist |
|---|---|---|---|---|---|---|---|---|
| 109 Red Pine Dr Lafayette, LA | 4.0 | 3.0 | 2087 | $3,500 | $1.68 | 13d | 1 | 0.14mi |
| 406 Starlight Dr Lafayette, LA | 4.0 | 2.0 | 1867 | $3,500 | $1.87 | 13d | 1 | 0.18mi |
| 215 Peggy St Lafayette, LA | 3.0 | 2.0 | 1100 | $1,100 | $1.00 | 13d | 1 | 1.41mi |
| 215 Peggy St Lafayette, LA | 3.0 | 2.0 | 1100 | $1,100 | $1.00 | 20d | 1 | 1.41mi |
Listing history 2 events
-
2026-06-17remarks 699-char remark
-
2026-06-17$225,500 Active 1 DOM
ⓘ Source: listings_history table (triggers on properties + properties_extension) + one-shot
backfill from property_details.listing_events for pre-trigger history.
Climate risk First Street
- Flood 1/10 Low FEMA zone X (unshaded) · 0% chance over 30 yrs
- Wildfire 1/10 Low
- Heat 8/10 Severe 7 d/yr ≥109°F today · 20 d/yr by 30 yrs out
- Wind 9/10 Extreme 99% chance of damaging wind over 30 yrs
- Air quality 2/10 Low 1 unhealthy d/yr today · 1 by 30 yrs out
Nearby sold comps map
Loading sold comps map…
Walkable amenities ~0.75 mi
Loading nearby amenities…
Taxation est. · year 1
- Rental income
- $33,346
- − Mortgage interest
- −$12,814
- − Property taxes
- −$3,431
- − Insurance
- −$1,144
- − Repairs & maintenance
- −$2,668
- − Management
- −$2,668
- − Depreciation
- −$6,655
- Taxable income
- $3,968
- Est. tax owed @ 24.0%
- −$952
- After-tax cash flow
- $6,421/yr
For passive investors: Depreciation is non-cash, so a rental often shows a tax loss while cash-flowing — sheltering income. Rental losses are passive: they offset passive income freely, and up to $25,000/yr can offset ordinary (W-2) income if you actively participate and your MAGI is under $100k (phasing out to $0 by $150k); unused losses carry forward. On sale, claimed depreciation is recaptured at up to 25%, and gains may owe capital-gains tax (a 1031 exchange can defer both). Figures are a year-1 estimate at your 24.0% rate — not tax advice; consult a CPA.
Condition & rehab AI · 2 photos
The Fallon Plan in Lafayette, Louisiana, presents a good condition with a modern and functional layout. Exterior and landscaping improvements can significantly enhance its value.
Value-add opportunities
- Both Painting the exterior — Fresh paint can enhance curb appeal and the home's overall appearance.
- Both Landscaping improvements — A well-maintained yard can increase both resale and rental value.
- Both Interior updates — Modernizing the interior can attract more buyers and renters, especially if the interior photos are provided and show outdated features.
Renovation cost estimate screening
Value-add ROI direction
- Both Painting the exterior — Fresh paint can enhance curb appeal and the home's overall appearance. ↑
- Both Landscaping improvements — A well-maintained yard can increase both resale and rental value. ↑
- Both Interior updates — Modernizing the interior can attract more buyers and renters, especially if the interior photos are provided and show outdated features. ↑
ⓘ Cost ranges are severity-bucket heuristics (US national rule-of-thumb). Get contractor quotes + a written scope before underwriting a rehab budget.
Schools (NCES district)
- District
- Lafayette Parish
- NCES district ID
- 2200870
- Math proficiency
- 38% ▼ -32.00%
- Reading proficiency
- 46% ▼ -24.00%
- Median HH income
- $50,238
- Composite
- 36.15/100
- National rank
- #4741
- State rank
- #19 of 98 in LA
Livability — Lafayette
- Score
- 70/100
- State rank
- #63
- US rank
- #8133
Category grades
Schools grade is shown separately in the Schools card above.
Census & demographics
- Census place
- Lafayette, LA
- County
- Lafayette Parish · 207,544 people
- City population
- 158,114
- Metro
- Lafayette, LA
- Population (ZIP)
- 26,465
- Household income
- $33,365
- Rent vs Own
- Severe rent burden
- 2089.0
Population outlook (Lafayette County) Hauer SSP2
- Today (2025)
- 280,930 people
- By 2030
- 301,092 · +7.2%
- By 2040
- 339,456 · +20.8%
- By 2050
- 375,156 · +33.5%
- By 2075
- 451,672 · +60.8%
- By 2100
- 497,203 · +77.0%
Race, ethnicity, and origin ACS 2023
- Neighborhood character
- Predominantly Black (73%)
- Race & ethnicity
- Black 73% White 18% Two or more races 6% Hispanic / Latino 4%
- Common ancestry
- Lithuanian 4%
- Foreign-born
- 2% · Canada
- Languages at home
- 95% English-only · Spanish 3% French/Haitian/Cajun 2%
Political lean MEDSL · Lafayette
- 2024 margin
- Solid R (+31.4) · D 33.5% · R 64.8% · Other 1.7%
- 2008→2024 swing
- -0.1pp no change · 2008: -31.3pp · 2024: -31.4pp
- All cycles
- 2024: R+31.4 2020: R+28.7 2016: R+33.6 2012: R+33.7 2008: R+31.3
Not yet ingested
- Civics
- —
Market trends
- HPI YoY
- ▼ -108.63%
- Current HPI
- 81.2963
- Rent YoY
- ▲ 7.35%
- Metro
- Lafayette, LA
- State GDP YoY
- ▲ 3.29%
- F500 in state
- 10
Industry mix (Fortune 500 HQ in LA)
| Industry | F500 HQs | Revenue |
|---|---|---|
| Telecommunications | 2 | $23B |
|
||
| Utilities | 1 | $12B |
|
||
| Wholesale / Distribution | 1 | $5B |
|
||
| Advertising | 1 | $2B |
|
||
Cash-flow waterfall
monthlySold comps — $/sqft
last 12 mo · ≤1 miLoading sold comps…