73 Camino Rio · Toms River, NJ
Flood risk 3/10 · Minor
- FEMA flood zone
- X (unshaded)
- Chance of flooding over 30 yrs
- 0.2%
- Est. flood insurance / yr
- $507 – $1,088
Fire risk 3/10 · Minor
- Est. fire insurance / yr
- $526 – $976
Heat risk 6/10 · Moderate
- Hot days now (above 102°F)
- 7 days/yr
- Hot days in 30 yrs
- 15 days/yr
Wind risk 6/10 · Moderate
- Chance of severe wind over 30 yrs
- 63.0%
Air-quality risk 3/10 · Minor
- Unhealthy air days now
- 3 days/yr
- Unhealthy air days in 30 yrs
- 4 days/yr
Risk factors via First Street. Map © Google.
Why this score? — see what drove the B+ grade
The composite is a weighted blend of 9 inputs, each scored 0–100. Each bar is that input's sub-score; the figure is the points it added to the 100-point composite (weight × sub-score).
- Cash flow +30.0/30.0
- ARV discount +15.0/15.0
- 1% rule +10.0/10.0
- DSCR +10.0/10.0
- Livability +4.0/5.0
- Condition / age +4.0/5.0
- Schools +2.9/10.0
- Rent growth +2.5/5.0
- Appreciation +0.0/10.0
$189,900
🖨 Deal sheet 📄 Offer letter ✓ Due diligence
Listing remarks MLS
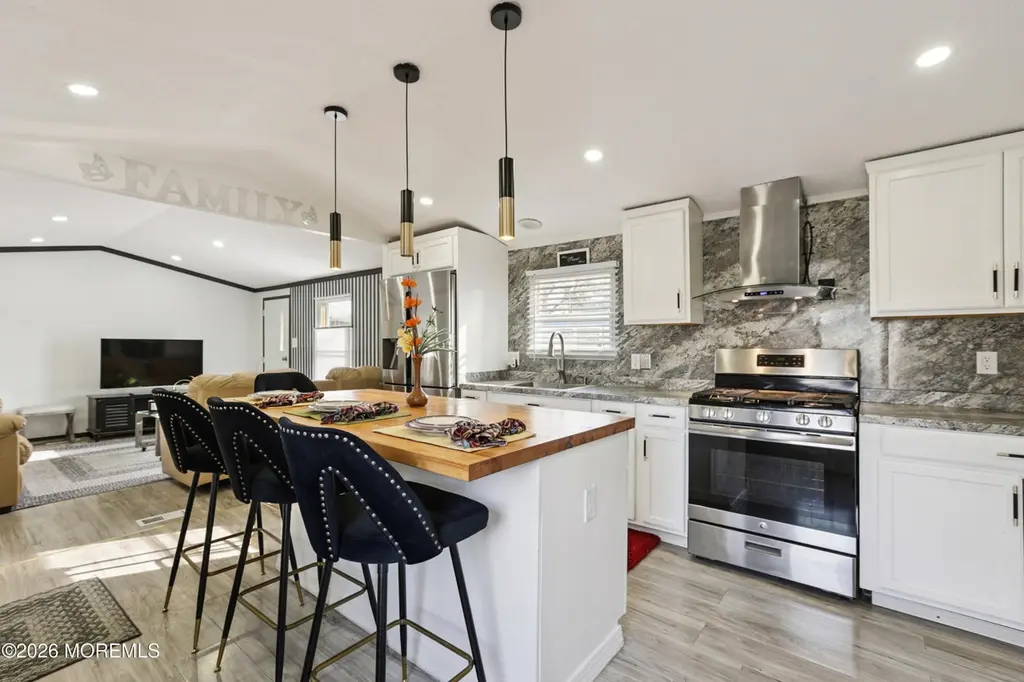
Discover this impressive yet affordable three bed/one bath modular home that truly has it all. Enter a beautifully updated kitchen featuring stainless steel appliances, a sleek range hood, extra cabinetry and a stunning butcher block island. This home offers low cost HOA in an all-age community. Major updates include 2 year old roof with gutter guards, brand new hot water heater, 1 year old air conditioner and furnace. All bedrooms have new windows and the home comes fully furnished just turn key ready. New paved driveway that fits 3 cars. Outside are 2 sheds and a gazebo.. Outside water line was insulated and plumbing under the sink updated. You truly have the complete package-stylish, comfortable and reasonably priced.
Key facts
- 2 year old roof
- Low cost hoa
- New hot water heater
Tags
Neighborhood map
What this means for you Summary
Snapshot
- This is a 3-bed/1.0-bath single-family listed at $190k. Condition is rated good.
Deal economics
- At list price, monthly cash flow is $842 ($10k/yr) — positive.
- The deal already cash-flows at list — no discount required.
- Meets the 1% rule at list price ($3k rent vs $190k).
- Recommended offer: $179k (6.0% below list) — sets the bar for market timing.
- Cap rate 11.6% vs local median 3.8% in Toms River — top-decile yield for the area; either an underpriced asset or a hidden risk that comps aren't pricing in. Stress-test before assuming the spread holds.
Location & tenants
- Location reads 81/100 on livability (#61 in NJ, #1,538 nationally) — a professional / high-income tenant draw. Strengths: employment A+, housing A+, health & safety A+; Watch: commute D, cost of living F.
- Toms River Regional School District (suburban): math 18% / reading 44% proficiency, ranked #316 of 472 in NJ (top 67%) — families likely to look elsewhere, expect single-tenant / working-renter base with shorter leases.
- Market conditions: 262 active listings in the ZIP; solid renter incomes; 4,434 units permitted in Ocean County in 2024 (868 in 5+ unit buildings).
- This rent runs 45% of the median local income ($88k/yr) — at the standard rent-burdened threshold; future hikes will face affordability resistance.
Forward outlook
- Local home prices are declining (-3.0%/yr); year-one equity from $1k of loan paydown is wiped out by about $6k of value loss. Plan a longer hold.
- Ocean County population projected to shrink 8% by 2050 — rents likely to lag national; underwrite the cash flow, not the appreciation.
- At projected returns (-3.0% appreciation + 3.0% rent growth), your $53k cash investment doubles in ~7 years — after that, you're playing with house money.
Negotiation context
- It's been on market 69 days — a 6% lower offer ($179k) is reasonable based on typical stale-listing flexibility.
Risks & watch-outs
- Climate carrying-cost: major wind risk, 63% chance of damaging wind over 30y; extreme-heat days projected 7→15/yr by 2055 (HVAC capex compounding) — expect insurance premiums to compound above CPI over the hold.
Questions for the listing agent
- It's been on market 69 days. Have you received any prior offers? Is the seller open to a 6% concession, seller financing, or rate buy-down credit?
- What does the HOA fee cover, when was the last increase, and are there any pending special assessments or reserve-fund shortfalls?
- Why hasn't it sold? Are there any deal-killer items the seller is aware of (foundation, flood, title, zoning, code violations)?
- Is there a deadline driving the sale (1031 exchange, divorce, estate, relocation)? That informs how much negotiation room exists.
- What's the average days-on-market for RENTAL listings here right now (not sales)? A rising rental-DOM trend means longer vacancies and softer asking-rent achievability than the comps imply.
- What's the recent tenant-quality profile in this submarket — average credit score on applications, eviction rate, late-payment / NSF rate, and stable-employment percentage? A property-management company in the area should have these aggregated.
- How much new for-sale + rental construction is in the pipeline within 1–3 miles? Heavy new supply typically softens prices + rents 12–24 months out; constrained supply supports both.
Investment metrics
- 1% rule
- 1.72% ✓
- Cap rate
- 11.61%
- Cash-on-cash
- 18.99%
- DSCR
- 1.85
- GRM
- 4.8
CMA / ARV
- ARV (median comp)
- $257,056
- List price
- $189,900
- Delta
- -26.13%
- Verdict
- UNDERPRICED
- Comps
- 10 within 1.0 mi
Show comp detail 3 sales within ~0.75 mi
| Address | Dist | Beds/Ba | Sqft | Sold | Price | $/sf | Match |
|---|---|---|---|---|---|---|---|
| 123 Camino Roble | 0.04mi | 3/1.0 | 970 (+7%) | 3mo | $150,000 | $155 | 84 |
| 2102 Massachusetts Ave | 0.31mi | 3/1.0 | 1,044 (+15%) | 6mo | $475,000 | $455 | 56 |
| 342 Stuart Ave | 0.63mi | 3/1.0 | 1,036 (+14%) | 10mo | $381,250 | $368 | 40 |
Match score weights: distance 35% · size 25% · config 20% · recency 20%. Top-matched comps best support the ARV.
Projected returns pro-forma
-3.0% appreciation · 3.0% rent growth · sell at horizon
- IRR
- 11.0%
- Equity multiple
- 1.44×
- Total profit
- $23,135
- Equity at exit
- $28,315
- IRR
- 20.1%
- Equity multiple
- 2.70×
- Total profit
- $90,419
- Equity at exit
- $16,419
Cash invested: $53,172 (down + closing). Projections, not guarantees.
Landlord ↔ Tenant lean methodology
- Overall (STATE)
- 21 Tenant-Leaning
- State New Jersey
- 21 Tenant-Leaning · D+6
- County
- — inherits STATE
- City
- — inherits STATE
ZIP-level market 08755
- Active inventory
- 262
- Price-to-rent
- 4.8×
Monthly cashflow live
- Estimated rent
- $3,263 medium interval (Pro) →
- Mortgage (P&I)
- −$996
- Tax est. 1.5%
- −$237 /mo · $2,848/yr
- Insurance
- −$79
- HOA
- −$424
- Vacancy / Maint / Mgmt
- −$685
- Net cashflow
- $842
Break-even live
UW: 25.0% down · 7.5% · 30yr · 1.5% tax · 5.0% vac · 8.0% maint · 8.0% mgmt
Financing live
Cash to close
- Down payment
- $47,475
- Closing costs
- $5,697
- Reserves months
- —
- Total cash needed
- —
Loan-product check · same deal, 3 products live
Conventional
25% down · 7.5% · 30yr
- Down + closing
- —
- Monthly P&I
- —
- Monthly cashflow
- —
- DSCR
- —
- Eligible?
- —
Personal DTI + credit; lowest rate.
DSCR
20% down · 8.5% · 30yr
- Down + closing
- —
- Monthly P&I
- —
- Monthly cashflow
- —
- DSCR
- —
- Eligible?
- —
No personal income docs; deal must DSCR.
Hard money
10% down · 12.0% · 12mo
- Down + closing
- —
- Monthly P&I
- —
- Monthly cashflow
- —
- DSCR
- —
- Eligible?
- —
Short-term bridge; refi at stabilization.
HOA detail
- Monthly dues
- $424 · $5,088/yr
- Likely covers
- water
Listing history 10 events
-
2026-06-13statusdays on market $189,900 Pending 69 DOM
-
2026-06-09days on market $189,900 Active 66 DOM
-
2026-06-08days on market $189,900 Active 65 DOM
-
2026-06-07days on market $189,900 Active 64 DOM
-
2026-06-04days on market $189,900 Active 61 DOM
-
2026-06-03days on market $189,900 Active 60 DOM
-
2026-06-02days on market $189,900 Active 59 DOM
-
2026-06-01days on market $189,900 Active 58 DOM
-
2026-05-31days on market $189,900 Active 57 DOM
-
2026-04-04$189,900 Active 730-char remark
Show marketing remark (730 chars)
Discover this impressive yet affordable three bed/one bath modular home that truly has it all. Enter a beautifully updated kitchen featuring stainless steel appliances, a sleek range hood, extra cabinetry and a stunning butcher block island. This home offers low cost HOA in an all-age community. Major updates include 2 year old roof with gutter guards, brand new hot water heater, 1 year old air conditioner and furnace. All bedrooms have new windows and the home comes fully furnished just turn key ready. New paved driveway that fits 3 cars. Outside are 2 sheds and a gazebo.. Outside water line was insulated and plumbing under the sink updated. You truly have the complete package-stylish, comfortable and reasonably priced.
ⓘ Source: listings_history table (triggers on properties + properties_extension) + one-shot
backfill from property_details.listing_events for pre-trigger history.
Climate risk First Street
- Flood 3/10 Moderate FEMA zone X (unshaded) · 20% chance over 30 yrs
- Wildfire 3/10 Moderate
- Heat 6/10 Major 7 d/yr ≥102°F today · 15 d/yr by 30 yrs out
- Wind 6/10 Major 63% chance of damaging wind over 30 yrs
- Air quality 3/10 Moderate 3 unhealthy d/yr today · 4 by 30 yrs out
Nearby sold comps map
Loading sold comps map…
Walkable amenities ~0.75 mi
Loading nearby amenities…
Taxation est. · year 1
- Rental income
- $39,158
- − Mortgage interest
- −$10,637
- − Property taxes
- −$2,848
- − Insurance
- −$950
- − Repairs & maintenance
- −$3,133
- − Management
- −$3,133
- − HOA
- −$5,088
- − Depreciation
- −$5,524
- Taxable income
- $7,845
- Est. tax owed @ 24.0%
- −$1,883
- After-tax cash flow
- $8,216/yr
For passive investors: Depreciation is non-cash, so a rental often shows a tax loss while cash-flowing — sheltering income. Rental losses are passive: they offset passive income freely, and up to $25,000/yr can offset ordinary (W-2) income if you actively participate and your MAGI is under $100k (phasing out to $0 by $150k); unused losses carry forward. On sale, claimed depreciation is recaptured at up to 25%, and gains may owe capital-gains tax (a 1031 exchange can defer both). Figures are a year-1 estimate at your 24.0% rate — not tax advice; consult a CPA.
Condition & rehab AI · 12 photos
This well-maintained, updated three-bedroom home offers a stylish and functional living space with low HOA fees and modern amenities.
Value-add opportunities
- Both Painting exterior and interior walls — Enhances curb appeal and interior aesthetics
- Both Reorganizing furniture for better flow — Improves functionality and visual appeal
- Both Adding smart home features — Enhances convenience and marketability
Renovation cost estimate screening
Value-add ROI direction
- Both Painting exterior and interior walls — Enhances curb appeal and interior aesthetics ↑
- Both Reorganizing furniture for better flow — Improves functionality and visual appeal ↑
- Both Adding smart home features — Enhances convenience and marketability ↑
ⓘ Cost ranges are severity-bucket heuristics (US national rule-of-thumb). Get contractor quotes + a written scope before underwriting a rehab budget.
Schools (NCES district)
- District
- Toms River Regional School District
- NCES district ID
- 3416230
- Math proficiency
- 18% ▼ -19.00%
- Reading proficiency
- 44% ▼ -10.00%
- Median HH income
- $72,370
- Composite
- 29.07/100
- National rank
- #6602
- State rank
- #316 of 472 in NJ
Livability — Toms River
- Score
- 81/100
- State rank
- #61
- US rank
- #1538
Category grades
Schools grade is shown separately in the Schools card above.
Census & demographics
- Census place
- Toms River, NJ
- County
- Ocean County · 439,426 people
- City population
- 131,205
- Metro
- New York-Newark-Jersey City, NY-NJ-PA
- Population (ZIP)
- 29,670
- Household income
- $87,575
- Rent vs Own
- Severe rent burden
- 529.0
Population outlook (Ocean County) Hauer SSP2
- Today (2025)
- 586,991 people
- By 2030
- 581,403 · -1.0%
- By 2040
- 564,913 · -3.8%
- By 2050
- 538,149 · -8.3%
- By 2075
- 468,845 · -20.1%
- By 2100
- 350,297 · -40.3%
Race, ethnicity, and origin ACS 2023
- Neighborhood character
- Predominantly White (73%)
- Race & ethnicity
- White 73% Hispanic / Latino 11% Black 9% Two or more races 8% Asian 4%
- Hispanic origin (detail)
- Puerto Rican 6%
- Common ancestry
- Romanian 5% Italian 2% Scotch-Irish 2%
- Foreign-born
- 10% · Canada, Jamaica, South Korea
- Languages at home
- 84% English-only · Spanish 7% Other Indo-European 2% Tagalog/Filipino 2%
Political lean MEDSL · Ocean
- 2024 margin
- Solid R (+36.0) · D 31.4% · R 67.4% · Other 1.2%
- 2008→2024 swing
- -17.6pp toward R · 2008: -18.4pp · 2024: -36.0pp
- All cycles
- 2024: R+36.0 2020: R+28.7 2016: R+34.0 2012: R+17.7 2008: R+18.4
Not yet ingested
- Civics
- —
Market trends
- HPI YoY
- ▼ -223.51%
- Current HPI
- 303.2721
- Rent YoY
- —
- Metro
- New York-Newark-Jersey City, NY-NJ-PA
- State GDP YoY
- ▲ 2.05%
- F500 in state
- 34
Industry mix (Fortune 500 HQ in NJ)
| Industry | F500 HQs | Revenue |
|---|---|---|
| Consumer Goods | 3 | $31B |
|
||
| Pharmaceuticals | 2 | $153B |
|
||
| Technology | 2 | $21B |
|
||
| Insurance | 2 | $20B |
|
||
| Healthcare | 2 | $19B |
|
||
| Financial Services | 1 | $70B |
|
||
Price history
1 event — show timeline
- 2026-04-04 Listed $189,900 MOMLS
Cash-flow waterfall
monthlySold comps — $/sqft
last 12 mo · ≤1 miLoading sold comps…