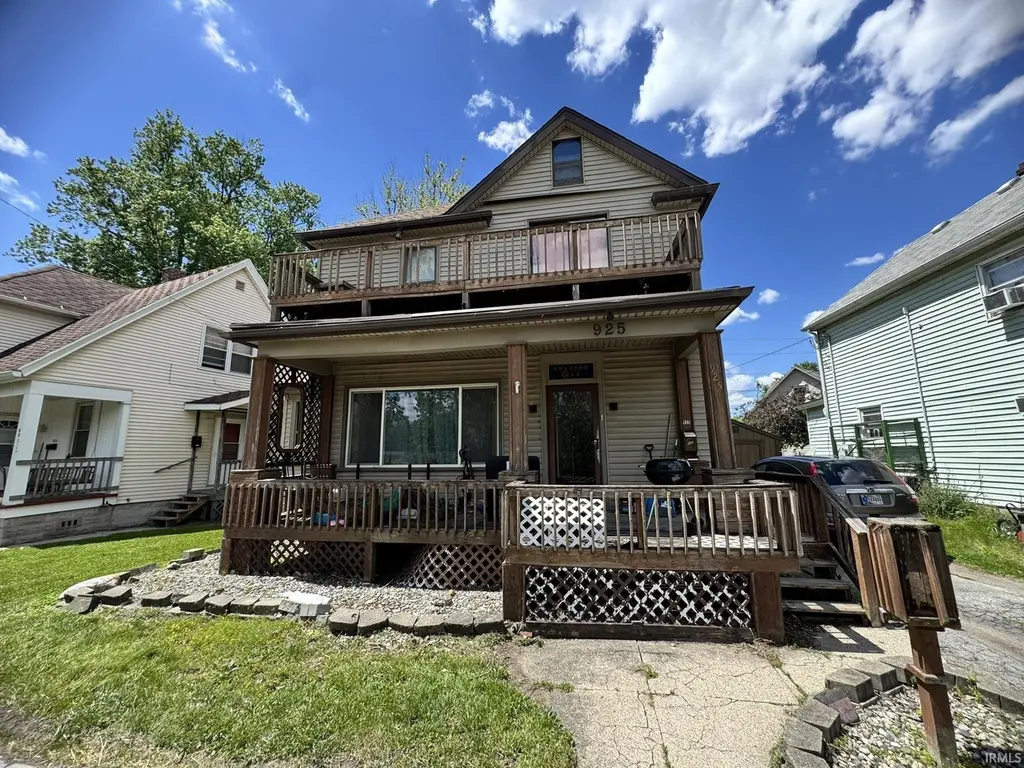
925 Crescent Ave · Fort Wayne, IN
Flood risk 5/10 · Moderate
- FEMA flood zone
- X
- Chance of flooding over 30 yrs
- 0.24%
- Est. flood insurance / yr
- $473 – $860
Fire risk 1/10 · Minimal
- Est. fire insurance / yr
- $717 – $1,331
Heat risk 3/10 · Minor
- Hot days now (above 100°F)
- 7 days/yr
- Hot days in 30 yrs
- 17 days/yr
Wind risk 2/10 · Minimal
- Chance of severe wind over 30 yrs
- —
Air-quality risk 3/10 · Minor
- Unhealthy air days now
- 2 days/yr
- Unhealthy air days in 30 yrs
- 3 days/yr
Risk factors via First Street. Map © Google.
Why this score? — see what drove the D+ grade
The composite is a weighted blend of 9 inputs, each scored 0–100. Each bar is that input's sub-score; the figure is the points it added to the 100-point composite (weight × sub-score).
- Cash flow +14.6/30.0
- ARV discount +14.0/15.0
- DSCR +4.4/10.0
- Livability +4.2/5.0
- 1% rule +4.0/10.0
- Rent growth +2.7/5.0
- Condition / age +2.5/5.0
- Schools +2.2/10.0
- Appreciation +0.0/10.0
$149,900
🖨 Deal sheet (PDF) 📄 Offer letter ✓ Due diligence
Listing remarks
Great central property located right by Lakeside Park with a beautiful view of a scenic pond across the street with a fountain! Backyard offers a welcoming space for entertaining, a basketball court, and a nice shed for extra storage. The home has a patio balcony right off the master and the basement offers additional storage space. Close to downtown activities and dining!
Key facts
- View of pond
- Patio balcony
- Basketball court
Tags
Property features AI
Exterior
- Utilities: Public water; Public sewer
- Home design: Single-family site-built home; 2 stories
- Construction: Vinyl and wood siding
- Exterior features: Level lot; Shed on the property
Interior
- Bedrooms: Total rooms: 7
- Bathrooms: 1 full bathroom; 1 half bathroom; One main-level bathroom
- Heating & cooling: Natural gas forced-air heating; Central air conditioning
- Interior features: Full basement
- Laundry & utility: Main-level laundry
Neighborhood map
What this means for you Summary
Snapshot
- This is a 3-bed/1.5-bath single-family listed at $150k.
Deal economics
- At list price, monthly cash flow is $35 ($421/yr) — positive.
- The deal already cash-flows at list — no discount required.
- To meet the 1% rule (rent ≥ 1% of price), the offer needs to be $135k (10.2% below list).
- Recommended offer: $135k (10.2% below list) — sets the bar for 1% rule.
- Cap rate 6.6% vs local median 4.7% in Fort Wayne — top-decile yield for the area; either an underpriced asset or a hidden risk that comps aren't pricing in. Stress-test before assuming the spread holds.
Location & tenants
- Location reads 84/100 on livability (#6 in IN, #676 nationally) — a professional / high-income tenant draw. Strengths: amenities A+, commute A+, cost of living A+; Watch: crime C-, employment D+.
- Fort Wayne Community Schools (urban): math 22% / reading 29% proficiency, ranked #263 of 301 in IN (top 87%) — low school quality limits family demand, transient renter base, plan for 1-2y turnover; 60% free/reduced lunch — lower-income household profile, screen leases tightly.
- Zoned schools: Forest Park Elementary School (math 21% / reading 22%, grade F, #803 of 994 statewide, top 81%, 601 students, 75% FRL); Lakeside Middle School (math 8% / reading 17%, grade F, #310 of 330 statewide, top 94%, 502 students, 78% FRL); North Side High School (math 19% / reading 51%, grade F, #266 of 369 statewide, top 73%, 1,474 students, 66% FRL).
- Market conditions: Rents flat; 113 active listings in the ZIP; 19 comparable units currently listed for rent nearby; rentals at typical pace (median 23d on market — plan ~3-4 weeks tenant-placement turnaround); 1,861 units permitted in Allen County in 2024 (576 in 5+ unit buildings).
- This rent runs 31% of the median local income ($52k/yr) — at the standard rent-burdened threshold; future hikes will face affordability resistance.
Forward outlook
- Local home prices are declining (-3.0%/yr); year-one equity from $1k of loan paydown is wiped out by about $4k of value loss. Plan a longer hold.
- Allen County population projected at +10% by 2050 — modest demand growth; plan on rents tracking national, not racing it.
Negotiation context
- It's been on market 40 days — a 3% lower offer ($145k) is reasonable based on typical stale-listing flexibility.
Risks & watch-outs
- Watch-outs: built in 1910 — expect roof / HVAC / electrical / plumbing capex.
- Climate carrying-cost: moderate flood risk — expect insurance premiums to compound above CPI over the hold.
Questions for the listing agent
- It's been on market 40 days. Have you received any prior offers? Is the seller open to a 10% concession, seller financing, or rate buy-down credit?
- Built in 1910 — when were the roof, HVAC, electrical panel, plumbing, and water heater last replaced?
- Is there a deadline driving the sale (1031 exchange, divorce, estate, relocation)? That informs how much negotiation room exists.
- Schools are D-rated, which usually means shorter tenancies and higher turnover. Who's the typical renter profile here, and what's been the actual vacancy rate?
- The area grade is low — what's the realistic commute time and amenity access for the typical tenant pool here? Any planned neighborhood developments (good or bad) we should know about?
- What's the average days-on-market for RENTAL listings here right now (not sales)? A rising rental-DOM trend means longer vacancies and softer asking-rent achievability than the comps imply.
- What's the recent tenant-quality profile in this submarket — average credit score on applications, eviction rate, late-payment / NSF rate, and stable-employment percentage? A property-management company in the area should have these aggregated.
- How much new for-sale + rental construction is in the pipeline within 1–3 miles? Heavy new supply typically softens prices + rents 12–24 months out; constrained supply supports both.
Investment metrics
- 1% rule
- 0.90% ✗
- Cap rate
- 6.57%
- Cash-on-cash
- 1.00%
- DSCR
- 1.04
- GRM
- 9.3
CMA / ARV
- ARV (median comp)
- $175,287
- List price
- $149,900
- Delta
- -14.48%
- Verdict
- UNDERPRICED
- Comps
- 20 within 1.0 mi
Show comp detail 12 sales within ~0.75 mi
| Address | Dist | Beds/Ba | Sqft | Sold | Price | $/sf | Match |
|---|---|---|---|---|---|---|---|
| 1126 Columbia Ave | 0.08mi | 3/1.5 | 1,568 (+3%) | 2mo | $265,000 | $169 | 89 |
| 905 Crescent Ave | 0.04mi | 3/1.5 | 1,424 (-6%) | 1mo | $175,000 | $123 | 87 |
| 1631 Columbia Ave | 0.32mi | 3/1.5 | 1,560 (+3%) | 0mo | $190,500 | $122 | 80 |
| 2007 California Ave | 0.56mi | 3/2.0 | 1,512 (-0%) | 2mo | $234,900 | $155 | 70 |
| 801 Kensington Blvd | 0.50mi | 4/1.5 (+1) | 1,591 (+5%) | 4mo | $205,000 | $129 | 60 |
| 705 Lawton Pl | 0.62mi | 3/1.5 | 1,577 (+4%) | 5mo | $179,900 | $114 | 60 |
| 814 Kensington Blvd | 0.53mi | 2/2.0 (-1) | 1,469 (-3%) | 4mo | $195,000 | $133 | 60 |
| 713 Harmar St | 0.37mi | 3/1.5 | 1,715 (+13%) | 1mo | $67,103 | $39 | 60 |
| 705 Riverside Ave | 0.57mi | 4/1.0 (+1) | 1,600 (+6%) | 1mo | $169,500 | $106 | 56 |
| 1845 Alabama Ave | 0.50mi | 3/1.0 | 1,372 (-10%) | 3mo | $210,000 | $153 | 56 |
| 1910 Cody Ave | 0.49mi | 2/2.0 (-1) | 1,664 (+10%) | 2mo | $219,000 | $132 | 52 |
| 916 Northwood Blvd | 0.71mi | 3/1.0 | 1,326 (-12%) | 0mo | $160,000 | $121 | 44 |
Match score weights: distance 35% · size 25% · config 20% · recency 20%. Top-matched comps best support the ARV.
Projected returns pro-forma
-3.0% appreciation · 0.75% rent growth · sell at horizon
- IRR
- -17.2%
- Equity multiple
- 0.40×
- Total profit
- $-25,023
- Equity at exit
- $22,351
- IRR
- -14.0%
- Equity multiple
- 0.27×
- Total profit
- $-30,546
- Equity at exit
- $12,961
Cash invested: $41,972 (down + closing). Projections, not guarantees.
Landlord ↔ Tenant lean methodology
- Overall (STATE)
- 90 Strongly Landlord-Friendly
- State Indiana
- 90 Strongly Landlord-Friendly · R+11
- County
- — inherits STATE
- City
- — inherits STATE
ZIP-level market 46805
- Rents YoY
- 0.8%
- Active inventory
- 113
- Price-to-rent
- 9.3×
Monthly cashflow live
- Estimated rent
- $1,347 high interval (Pro) →
- Mortgage (P&I)
- −$786
- Tax from tax record
- −$180 /mo · $2,163/yr
- Insurance
- −$62
- HOA
- −$0
- Vacancy / Maint / Mgmt
- −$283
- Net cashflow
- $35
Break-even live
Sensitivity live
| Price | -10% $120 | -5% $77 | +0% $35 | +5% $-7 | +10% $-50 |
|---|---|---|---|---|---|
| Rent | -10% $-71 | -5% $-18 | +0% $35 | +5% $88 | +10% $141 |
| Rate | -1.0pp $111 | -0.5pp $73 | base $35 | +0.5pp $-4 | +1.0pp $-43 |
UW: 25.0% down · 7.5% · 30yr · 1.5% tax · 5.0% vac · 8.0% maint · 8.0% mgmt
Financing live
Cash to close
- Down payment
- $37,475
- Closing costs
- $4,497
- Reserves months
- —
- Total cash needed
- —
Loan-product check · same deal, 3 products live
Conventional
25% down · 7.5% · 30yr
- Down + closing
- —
- Monthly P&I
- —
- Monthly cashflow
- —
- DSCR
- —
- Eligible?
- —
Personal DTI + credit; lowest rate.
DSCR
20% down · 8.5% · 30yr
- Down + closing
- —
- Monthly P&I
- —
- Monthly cashflow
- —
- DSCR
- —
- Eligible?
- —
No personal income docs; deal must DSCR.
Hard money
10% down · 12.0% · 12mo
- Down + closing
- —
- Monthly P&I
- —
- Monthly cashflow
- —
- DSCR
- —
- Eligible?
- —
Short-term bridge; refi at stabilization.
Rent comps 19 comps
| Address | Beds | Baths | Sqft | Rent | $/sqft | DOM | Units | Dist |
|---|---|---|---|---|---|---|---|---|
| 1206 Columbia Ave Unit 2 Fort Wayne, IN | 2.0 | 2.0 | 1118 | $995 | $0.89 | 45d | 1 | 0.06mi |
| 1516 Bayer Ave Fort Wayne, IN | 4.0 | 2.0 | 1280 | $1,299 | $1.01 | 15d | 1 | 0.36mi |
| 1726 Tecumseh St Fort Wayne, IN | 3.0 | 1.0 | 1280 | $1,350 | $1.05 | 15d | 1 | 0.45mi |
| 807 Edgewater Ave Fort Wayne, IN | 3.0 | 1.0 | 1075 | $1,450 | $1.35 | 23d | 1 | 0.47mi |
| 805 Edgewater Ave Fort Wayne, IN | 3.0 | 1.0 | 1075 | $1,550 | $1.44 | 15d | 1 | 0.47mi |
| 919 Madison St Fort Wayne, IN | 2.0 | 1.0 | 1332 | $995 | $0.75 | 45d | 1 | 0.64mi |
| 2008 N Anthony Blvd Fort Wayne, IN | 3.0 | 2.5 | 2035 | $1,825 | $0.90 | 15d | 1 | 0.69mi |
| 1131 E Lewis St Fort Wayne, IN | 4.0 | 2.0 | 1476 | $1,950 | $1.32 | 15d | 1 | 0.74mi |
| 1132 S Hanna St Unit 1 Fort Wayne, IN | 4.0 | 1.5 | 1656 | $1,600 | $0.97 | 45d | 1 | 0.76mi |
| 1501 E Lewis St Fort Wayne, IN | 4.0 | 1.0 | 2000 | $1,450 | $0.72 | 45d | 1 | 0.76mi |
| 2508 Woodward Ave Fort Wayne, IN | 3.0 | 1.0 | 1300 | $1,700 | $1.31 | 15d | 1 | 1.08mi |
| 607 Curdes Ave Fort Wayne, IN | 3.0 | 1.5 | 1072 | $1,450 | $1.35 | 23d | 1 | 1.19mi |
| 2403 N Clinton St Fort Wayne, IN | 3.0 | 2.0 | 1666 | $1,750 | $1.05 | 45d | 1 | 1.21mi |
| 859 Buchanan St Fort Wayne, IN | 1.0–4.0 | 1.0 | 887 | $1,074 | $1.21 | 23d | 1 | 1.24mi |
| 2315 Terrace Rd Fort Wayne, IN | 3.0 | 1.0 | 1466 | $1,600 | $1.09 | 45d | 1 | 1.25mi |
| 1311 Ferguson Ave Fort Wayne, IN | 2.0 | 2.0 | 1400 | $1,700 | $1.21 | 15d | 1 | 1.34mi |
| 2020 Hobson Rd Fort Wayne, IN | 2.0–4.0 | 1.0–2.0 | 1340 | $1,135 | $0.85 | 15d | 7 | 1.41mi |
| 1911 Hazelwood Ave Fort Wayne, IN | 1.0–3.0 | 1.0–2.5 | 910 | $1,375 | $1.51 | 23d | 3 | 1.41mi |
| 1250 Ewing St Fort Wayne, IN | 2.0 | 1.0–2.0 | 980 | $2,081 | $2.12 | 23d | 24 | 1.43mi |
Listing history 17 events
-
2026-06-22days on market $149,900 Active 40 DOM
-
2026-06-18days on market $149,900 Active 37 DOM
-
2026-06-17days on market $149,900 Active 36 DOM
-
2026-06-16days on market $149,900 Active 35 DOM
-
2026-06-15price $149,900 Active 34 DOM
-
2026-06-15days on market $154,900 Active 34 DOM
-
2026-06-14days on market $154,900 Active 32 DOM
-
2026-06-10days on market $154,900 Active 29 DOM
-
2026-06-09days on market $154,900 Active 28 DOM
-
2026-06-08days on market $154,900 Active 27 DOM
-
2026-06-07days on market $154,900 Active 26 DOM
-
2026-06-03days on market $154,900 Active 22 DOM
-
2026-06-02days on market $154,900 Active 21 DOM
-
2026-06-01pricedays on market $154,900 Active 20 DOM
-
2026-05-31days on market $159,900 Active 19 DOM
-
2026-05-30days on market $159,900 Active 18 DOM
-
2026-05-12$169,900 Active 375-char remark
ⓘ Source: listings_history table (triggers on properties + properties_extension) + one-shot
backfill from property_details.listing_events for pre-trigger history.
Tax reassessment forecast IN · Partial reset (capped growth)
- Current annual tax
- $2,163 · $180/mo
- Projected year-2 tax
- $2,163 · $180/mo
- Expected delta
- $0/yr ($0/mo · 0.0%)
ⓘ Screening estimate from a state-policy table — verify with the county assessor before closing.
Climate risk First Street
- Flood 5/10 Major FEMA zone X · 24% chance over 30 yrs
- Wildfire 1/10 Low
- Heat 3/10 Moderate 7 d/yr ≥100°F today · 17 d/yr by 30 yrs out
- Wind 2/10 Low
- Air quality 3/10 Moderate 2 unhealthy d/yr today · 3 by 30 yrs out
Nearby sold comps map
Loading sold comps map…
Walkable amenities ~0.75 mi
Loading nearby amenities…
Taxation est. · year 1
- Rental income
- $16,160
- − Mortgage interest
- −$8,397
- − Property taxes
- −$2,163
- − Insurance
- −$750
- − Repairs & maintenance
- −$1,293
- − Management
- −$1,293
- − Depreciation
- −$4,361
- Taxable loss
- −$2,096
- Est. tax savings @ 24.0%
- +$503
- After-tax cash flow
- $924/yr
For passive investors: Depreciation is non-cash, so a rental often shows a tax loss while cash-flowing — sheltering income. Rental losses are passive: they offset passive income freely, and up to $25,000/yr can offset ordinary (W-2) income if you actively participate and your MAGI is under $100k (phasing out to $0 by $150k); unused losses carry forward. On sale, claimed depreciation is recaptured at up to 25%, and gains may owe capital-gains tax (a 1031 exchange can defer both). Figures are a year-1 estimate at your 24.0% rate — not tax advice; consult a CPA.
Schools (NCES district)
- District
- Fort Wayne Community Schools
- NCES district ID
- 1803630
- Math proficiency
- 22% ▼ -11.00%
- Reading proficiency
- 29% ▼ -7.00%
- Median HH income
- $41,951
- Composite
- 21.68/100
- National rank
- #8275
- State rank
- #263 of 301 in IN
Livability — Fort Wayne
- Score
- 84/100
- State rank
- #6
- US rank
- #676
Category grades
Schools grade is shown separately in the Schools card above.
Census & demographics
- Census place
- Fort Wayne, IN
- County
- Allen County · 326,813 people
- City population
- 326,813
- Metro
- Fort Wayne, IN
- Population (ZIP)
- 21,437
- Household income
- $52,154
- Rent vs Own
- Severe rent burden
- 904.0
Population outlook (Allen County) Hauer SSP2
- Today (2025)
- 394,020 people
- By 2030
- 405,128 · +2.8%
- By 2040
- 423,476 · +7.5%
- By 2050
- 435,137 · +10.4%
- By 2075
- 450,293 · +14.3%
- By 2100
- 424,101 · +7.6%
Race, ethnicity, and origin ACS 2023
- Neighborhood character
- Predominantly White (72%)
- Race & ethnicity
- White 72% Black 9% Two or more races 8% Hispanic / Latino 7% Asian 5%
- Hispanic origin (detail)
- Mexican 4%
- Common ancestry
- Lithuanian 3% Slovak 3% Italian 2%
- Foreign-born
- 6% · Philippines, Canada
- Languages at home
- 91% English-only · Other Asian/Pacific 3% Spanish 3%
Political lean MEDSL · Allen
- 2024 margin
- R (+12.5) · D 42.9% · R 55.4% · Other 1.7%
- 2008→2024 swing
- -8.1pp toward R · 2008: -4.3pp · 2024: -12.5pp
- All cycles
- 2024: R+12.5 2020: R+11.2 2016: R+19.6 2012: R+16.8 2008: R+4.3
Not yet ingested
- Civics
- —
Market trends
- HPI YoY
- ▼ -356.64%
- Current HPI
- 286.2643
- Rent YoY
- ▲ 0.75%
- Metro
- Fort Wayne, IN
- State GDP YoY
- ▲ 2.90%
- F500 in state
- 18
Industry mix (Fortune 500 HQ in IN)
| Industry | F500 HQs | Revenue |
|---|---|---|
| Industrial Machinery | 2 | $37B |
|
||
| Healthcare | 1 | $177B |
|
||
| Pharmaceuticals | 1 | $45B |
|
||
| Metals / Steel | 1 | $18B |
|
||
| Agriculture | 1 | $17B |
|
||
| Packaging | 1 | $12B |
|
||
Price history
-11.8% since first listed4 events — show timeline
- 2026-06-15 Price Changed $149,900 IRMLS
- 2026-06-01 Price Changed $154,900 IRMLS
- 2026-05-26 Price Changed $159,900 IRMLS
- 2026-05-12 Listed $169,900 IRMLS
Property tax history
+16.5%/yrLatest (2024): $2,163 · +21.6% YoY. Source: county tax records.
Cash-flow waterfall
monthlySold comps — $/sqft
last 12 mo · ≤1 miLoading sold comps…