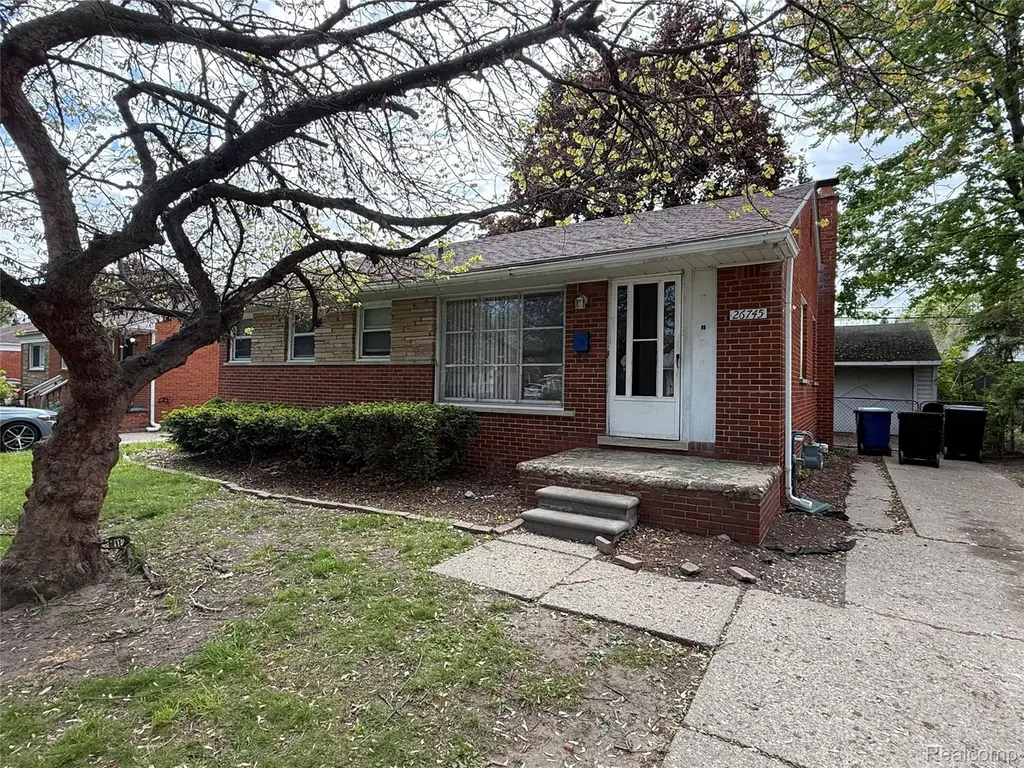
26745 Dover · Dearborn Heights, MI
Flood risk 1/10 · Minimal
- FEMA flood zone
- X (unshaded)
- Chance of flooding over 30 yrs
- 0.0%
- Est. flood insurance / yr
- $473 – $860
Fire risk 1/10 · Minimal
- Est. fire insurance / yr
- $784 – $1,456
Heat risk 3/10 · Minor
- Hot days now (above 98°F)
- 7 days/yr
- Hot days in 30 yrs
- 15 days/yr
Wind risk 2/10 · Minimal
- Chance of severe wind over 30 yrs
- —
Air-quality risk 3/10 · Minor
- Unhealthy air days now
- 2 days/yr
- Unhealthy air days in 30 yrs
- 3 days/yr
Risk factors via First Street. Map © Google.
Why this score? — see what drove the B- grade
The composite is a weighted blend of 9 inputs, each scored 0–100. Each bar is that input's sub-score; the figure is the points it added to the 100-point composite (weight × sub-score).
- Cash flow +28.3/30.0
- DSCR +10.0/10.0
- ARV discount +8.2/15.0
- 1% rule +7.0/10.0
- Livability +4.0/5.0
- Rent growth +3.3/5.0
- Condition / age +2.5/5.0
- Schools +1.8/10.0
- Appreciation +0.0/10.0
$140,000
🖨 Deal sheet 📄 Offer letter ✓ Due diligence
Listing remarks MLS
Terrific opportunity to purchase in a very appealing Redford neighborhood. House has lots of charm and potential as either an investment or family home. Needs some cosmetic and mechanical updates but appears to be in good structural condition. Priced aggressively to sell so bring all cash offers only. Seller is asking for highest and best by close of business 6/5/26. Property is vacant, buyer's agent must be present at all showings.
Key facts
- 5,663 sq ft lot
- 2 garage spots
- Built 1954
Property features AI
Exterior
- Parking: Detached 2-car garage
- Utilities: Public water; Public sewer
- Home design: Single-family residence; One level; Ground-level entry
- Construction: Brick construction; Block foundation; Built with above-grade finished area and additional finished space below grade
- Exterior features: Paved road access; Lot approximately 54 x 100.7 (0.13 acres)
Interior
- Bathrooms: 2 full bathrooms
- Heating & cooling: Forced air heating (natural gas); No central air
- Interior features: Partially finished basement; Total of 5 rooms
Neighborhood map
What this means for you Summary
Snapshot
- This is a 3-bed/1.0-bath single-family listed at $140k.
Deal economics
- At list price, monthly cash flow is $448 ($5k/yr) — positive.
- The deal already cash-flows at list — no discount required.
- Meets the 1% rule at list price ($2k rent vs $140k).
- Cap rate 10.1% vs local median 5.5% in Dearborn Heights — top-decile yield for the area; either an underpriced asset or a hidden risk that comps aren't pricing in. Stress-test before assuming the spread holds.
Location & tenants
- Location reads 79/100 on livability (#82 in MI, #1,885 nationally) — a middle-class / working-renter tenant base. Strengths: commute A+, cost of living A+, housing A+; Watch: schools C-, crime D+, employment D+.
- South Redford School District (suburban): math 11% / reading 29% proficiency, ranked #455 of 540 in MI (top 84%) — low school quality limits family demand, transient renter base, plan for 1-2y turnover.
- Market conditions: Rents rising (+3.2%/yr); 188 active listings in the ZIP; 14 comparable units currently listed for rent nearby; rentals leasing fast (median 10d on market — plan ~1-2 weeks tenant-placement turnaround); 2,639 units permitted in Wayne County in 2024 (1,216 in 5+ unit buildings).
Forward outlook
- Local home prices are declining (-3.0%/yr); year-one equity from $968 of loan paydown is wiped out by about $4k of value loss. Plan a longer hold.
- Wayne County population projected at -17% by 2050 — secular population decline; favor cash flow + early exit over multi-decade hold.
- At projected returns (-3.0% appreciation + 3.2% rent growth), your $39k cash investment doubles in ~9 years — after that, you're playing with house money.
Negotiation context
- Only 12 days on market — expect competitive offers; lowballing is unlikely to land.
- 6 sale attempts since 21y ago with the ask held roughly flat each time — persistent listings suggest the price (not the market) is what's stuck; bring a comps-based counter.
- Current owner paid $90k; list at $140k implies a 56% gain — meaningful room to come down on a strong offer.
Risks & watch-outs
- Watch-outs: built in 1954 — expect roof / HVAC / electrical / plumbing capex.
Questions for the listing agent
- Built in 1954 — when were the roof, HVAC, electrical panel, plumbing, and water heater last replaced?
- Is there a deadline driving the sale (1031 exchange, divorce, estate, relocation)? That informs how much negotiation room exists.
- Crime grade is D in this area — have there been break-ins, vandalism, or insurance claims at this property in the last 3 years? What carrier currently insures it and at what premium?
- What's the average days-on-market for RENTAL listings here right now (not sales)? A rising rental-DOM trend means longer vacancies and softer asking-rent achievability than the comps imply.
- What's the recent tenant-quality profile in this submarket — average credit score on applications, eviction rate, late-payment / NSF rate, and stable-employment percentage? A property-management company in the area should have these aggregated.
- How much new for-sale + rental construction is in the pipeline within 1–3 miles? Heavy new supply typically softens prices + rents 12–24 months out; constrained supply supports both.
Investment metrics
- 1% rule
- 1.20% ✓
- Cap rate
- 10.13%
- Cash-on-cash
- 13.70%
- DSCR
- 1.61
- GRM
- 6.9
CMA / ARV
- ARV (on-the-fly)
- $142,128
- Comps found
- 12
Show comp detail 12 sales within ~0.75 mi
| Address | Dist | Beds/Ba | Sqft | Sold | Price | $/sf | Match |
|---|---|---|---|---|---|---|---|
| 9010 Leverne | 0.17mi | 3/1.0 | 1,020 (+1%) | 2mo | $220,000 | $216 | 89 |
| 9624 Nathaline | 0.49mi | 3/1.0 | 1,019 (+1%) | 3mo | $209,000 | $205 | 73 |
| 9576 Columbia St | 0.45mi | 3/1.0 | 1,034 (+3%) | 10mo | $152,000 | $147 | 67 |
| 9983 Hemingway | 0.64mi | 3/1.0 | 1,059 (+5%) | 3mo | $149,000 | $141 | 60 |
| 9636 Centralia | 0.74mi | 3/1.0 | 1,043 (+4%) | 4mo | $135,000 | $129 | 56 |
| 9130 Kinloch | 0.41mi | 3/1.5 | 1,144 (+14%) | 3mo | $123,000 | $108 | 54 |
| 9648 Nathaline Ave | 0.51mi | 3/1.0 | 894 (-11%) | 4mo | $145,000 | $162 | 54 |
| 9640 Nathaline | 0.51mi | 3/1.0 | 894 (-11%) | 5mo | $125,000 | $140 | 54 |
| 9560 Nathaline | 0.43mi | 4/1.5 (+1) | 1,125 (+12%) | 1mo | $142,500 | $127 | 53 |
| 9960 Rockland | 0.68mi | 3/2.0 | 937 (-7%) | 2mo | $150,000 | $160 | 51 |
| 9656 Sioux | 0.53mi | 4/1.0 (+1) | 1,116 (+11%) | 2mo | $147,500 | $132 | 51 |
| 11319 Tecumseh | 0.68mi | 3/1.0 | 894 (-11%) | 9mo | $116,500 | $130 | 42 |
Match score weights: distance 35% · size 25% · config 20% · recency 20%. Top-matched comps best support the ARV.
Projected returns pro-forma
-3.0% appreciation · 3.25% rent growth · sell at horizon
- IRR
- 4.1%
- Equity multiple
- 1.16×
- Total profit
- $6,213
- Equity at exit
- $20,874
- IRR
- 13.8%
- Equity multiple
- 2.12×
- Total profit
- $43,747
- Equity at exit
- $12,105
Cash invested: $39,200 (down + closing). Projections, not guarantees.
Landlord ↔ Tenant lean methodology
- Overall (STATE)
- 62 Landlord-Friendly
- State Michigan
- 62 Landlord-Friendly · EVEN
- County
- — inherits STATE
- City
- — inherits STATE
ZIP-level market 48239
- Rents YoY
- 3.2%
- Active inventory
- 188
- Price-to-rent
- 6.9×
Monthly cashflow live
- Estimated rent
- $1,681 high interval (Pro) →
- Mortgage (P&I)
- −$734
- Tax from tax record
- −$88 /mo · $1,054/yr
- Insurance
- −$58
- HOA
- −$0
- Vacancy / Maint / Mgmt
- −$353
- Net cashflow
- $448
Break-even live
UW: 25.0% down · 7.5% · 30yr · 1.5% tax · 5.0% vac · 8.0% maint · 8.0% mgmt
Financing live
Cash to close
- Down payment
- $35,000
- Closing costs
- $4,200
- Reserves months
- —
- Total cash needed
- —
Loan-product check · same deal, 3 products live
Conventional
25% down · 7.5% · 30yr
- Down + closing
- —
- Monthly P&I
- —
- Monthly cashflow
- —
- DSCR
- —
- Eligible?
- —
Personal DTI + credit; lowest rate.
DSCR
20% down · 8.5% · 30yr
- Down + closing
- —
- Monthly P&I
- —
- Monthly cashflow
- —
- DSCR
- —
- Eligible?
- —
No personal income docs; deal must DSCR.
Hard money
10% down · 12.0% · 12mo
- Down + closing
- —
- Monthly P&I
- —
- Monthly cashflow
- —
- DSCR
- —
- Eligible?
- —
Short-term bridge; refi at stabilization.
Rent comps 14 comps
| Address | Beds | Baths | Sqft | Rent | $/sqft | DOM | Units | Dist |
|---|---|---|---|---|---|---|---|---|
| 27201 Canfield St W Dearborn Heights, MI | 1.0–2.0 | 1.0–2.0 | 852 | $1,499 | $1.76 | 1d | 22 | 0.47mi |
| 8455 Robindale Ave Dearborn Heights, MI | 3.0 | 1.0 | 1100 | $1,750 | $1.59 | 4d | 1 | 1.09mi |
| 11726 Deering St Livonia, MI | 4.0 | 1.5 | 1248 | $2,125 | $1.70 | 1d | 1 | 1.10mi |
| 8402 Robindale Ave Dearborn Heights, MI | 3.0 | 1.0 | 1190 | $1,600 | $1.34 | 15d | 1 | 1.13mi |
| 12097 Cavell St Livonia, MI | 3.0 | 1.0 | 985 | $1,200 | $1.22 | 1d | 1 | 1.18mi |
| 12107 Centralia Redford, MI | 3.0 | 1.0 | 912 | $1,800 | $1.97 | 43d | 1 | 1.25mi |
| 79 3rd St Unit 79 Dearborn Heights, MI | 2.0 | 1.0 | 840 | $1,339 | $1.59 | 24d | 1 | 1.32mi |
| 7435 Lathers St Westland, MI | 3.0 | 1.0 | 1120 | $1,900 | $1.70 | 16d | 1 | 1.33mi |
| 7457 Harrison St Westland, MI | 3.0 | 1.0 | 1120 | $1,900 | $1.70 | 1d | 1 | 1.36mi |
| 7484 Affeldt St Westland, MI | 3.0 | 1.0 | 1120 | $1,500 | $1.34 | 24d | 1 | 1.36mi |
| 7048 Deering St Garden City, MI | 3.0 | 1.0 | 910 | $1,500 | $1.65 | 17d | 1 | 1.39mi |
| 6954 Inkster Rd Dearborn Heights, MI | 1.0–2.0 | 1.0–1.5 | 837 | $1,339 | $1.60 | 2d | 9 | 1.39mi |
| 181 Terri Dr Unit 181 Dearborn Heights, MI | 2.0 | 2.0 | 840 | $1,119 | $1.33 | 5d | 1 | 1.45mi |
| 11141 Karen St Livonia, MI | 3.0 | 1.0 | 1322 | $1,950 | $1.48 | 10d | 1 | 1.46mi |
Listing history 9 events
-
2026-06-13statusdays on market $140,000 Pending 12 DOM
-
2026-06-09days on market $140,000 Active 11 DOM
-
2026-06-08days on market $140,000 Active 10 DOM
-
2026-06-07days on market $140,000 Active 9 DOM
-
2026-06-04days on market $140,000 Active 6 DOM
-
2026-06-03days on market $140,000 Active 5 DOM
-
2026-06-02days on market $140,000 Active 4 DOM
-
2026-06-01days on market $140,000 Active 3 DOM
-
2026-05-31days on market $140,000 Active 2 DOM
ⓘ Source: listings_history table (triggers on properties + properties_extension) + one-shot
backfill from property_details.listing_events for pre-trigger history.
Tax reassessment forecast MI · Partial reset (capped growth)
- Current annual tax
- $1,054 · $88/mo
- Projected year-2 tax
- $1,605 · $134/mo
- Expected delta
- +$551/yr (+$46/mo · 52.2%)
ⓘ Screening estimate from a state-policy table — verify with the county assessor before closing.
Climate risk First Street
- Flood 1/10 Low FEMA zone X (unshaded) · 0% chance over 30 yrs
- Wildfire 1/10 Low
- Heat 3/10 Moderate 7 d/yr ≥98°F today · 15 d/yr by 30 yrs out
- Wind 2/10 Low
- Air quality 3/10 Moderate 2 unhealthy d/yr today · 3 by 30 yrs out
Nearby sold comps map
Loading sold comps map…
Walkable amenities ~0.75 mi
Loading nearby amenities…
Taxation est. · year 1
- Rental income
- $20,171
- − Mortgage interest
- −$7,842
- − Property taxes
- −$1,054
- − Insurance
- −$700
- − Repairs & maintenance
- −$1,614
- − Management
- −$1,614
- − Depreciation
- −$4,073
- Taxable income
- $3,274
- Est. tax owed @ 24.0%
- −$786
- After-tax cash flow
- $4,585/yr
For passive investors: Depreciation is non-cash, so a rental often shows a tax loss while cash-flowing — sheltering income. Rental losses are passive: they offset passive income freely, and up to $25,000/yr can offset ordinary (W-2) income if you actively participate and your MAGI is under $100k (phasing out to $0 by $150k); unused losses carry forward. On sale, claimed depreciation is recaptured at up to 25%, and gains may owe capital-gains tax (a 1031 exchange can defer both). Figures are a year-1 estimate at your 24.0% rate — not tax advice; consult a CPA.
Schools (NCES district)
- District
- South Redford School District
- NCES district ID
- 2632280
- Math proficiency
- 11% ▼ -9.00%
- Reading proficiency
- 29% ▼ -7.00%
- Median HH income
- $52,775
- Composite
- 18.1/100
- National rank
- #8972
- State rank
- #455 of 540 in MI
Livability — Dearborn Heights
- Score
- 79/100
- State rank
- #82
- US rank
- #1885
Category grades
Schools grade is shown separately in the Schools card above.
Census & demographics
- County
- Wayne County · 1,562,939 people
- City population
- 61,771
- Metro
- Detroit-Warren-Dearborn, MI
- Population (ZIP)
- 36,976
- Household income
- $71,151
- Rent vs Own
- Severe rent burden
- 1052.0
Population outlook (Wayne County) Hauer SSP2
- Today (2025)
- 1,675,273 people
- By 2030
- 1,620,300 · -3.3%
- By 2040
- 1,502,341 · -10.3%
- By 2050
- 1,384,039 · -17.4%
- By 2075
- 1,124,592 · -32.9%
- By 2100
- 881,193 · -47.4%
Race, ethnicity, and origin ACS 2023
- Neighborhood character
- Majority Black (58%)
- Race & ethnicity
- Black 58% White 34% Hispanic / Latino 4% Two or more races 4%
- Common ancestry
- Romanian 7% Slovak 2% Lithuanian 2%
- Foreign-born
- 2% · Canada
- Languages at home
- 96% English-only · Spanish 1% Other Indo-European 1% Arabic 1%
Political lean MEDSL · Wayne
- 2024 margin
- Strong D (+29.0) · D 62.7% · R 33.7% · Other 3.6%
- 2008→2024 swing
- -20.5pp toward R · 2008: 49.5pp · 2024: 29.0pp
- All cycles
- 2024: D+29.0 2020: D+38.1 2016: D+37.3 2012: D+46.9 2008: D+49.5
Not yet ingested
- Civics
- —
Market trends
- HPI YoY
- ▼ -202.97%
- Current HPI
- 236.1136
- Rent YoY
- ▲ 3.25%
- Metro
- Detroit-Warren-Dearborn, MI
- State GDP YoY
- ▲ 1.37%
- F500 in state
- 28
Industry mix (Fortune 500 HQ in MI)
| Industry | F500 HQs | Revenue |
|---|---|---|
| Automotive Parts | 3 | $48B |
|
||
| Automotive | 2 | $372B |
|
||
| Chemicals | 1 | $45B |
|
||
| Automotive Retail | 1 | $29B |
|
||
| Healthcare / Medical Devices | 1 | $23B |
|
||
| Automotive Technology | 1 | $20B |
|
||
Price history
+4.6% since first listed14 events — show timeline
- 2026-05-29 Listed $140,000 MiRealSource-MiMLS
- 2026-05-29 Listed $140,000 REALCOMP
- 2025-12-01 Sold (Public Records) $90,000 Public Records
- 2012-06-21 Sold (MLS) $32,553 MiRealSource-MiMLS
- 2012-06-21 Sold (MLS) $32,553 REALCOMP
- 2012-06-05 Listing Removed — MiRealSource-MiMLS
- 2012-06-05 Listing Removed — REALCOMP
- 2012-04-05 Listed $31,900 REALCOMP
- 2012-04-03 Listed $31,900 MiRealSource-MiMLS
- 2005-08-03 Sold (Public Records) $129,900 Public Records
- 2005-06-09 Sold (MLS) $129,900 REALCOMP
- 2005-04-25 Listing Removed — REALCOMP
- 2005-04-25 Listed $129,900 REALCOMP
- 2005-04-04 Listed $133,900 REALCOMP
Property tax history
-5.9%/yrLatest (2025): $1,054 · -62.5% YoY. Source: county tax records.
Cash-flow waterfall
monthlySold comps — $/sqft
last 12 mo · ≤1 miLoading sold comps…