1424 Finley Ave · Indianapolis city (balance), IN
Flood risk 1/10 · Minimal
- FEMA flood zone
- X (unshaded)
- Chance of flooding over 30 yrs
- 0.0%
- Est. flood insurance / yr
- $507 – $1,088
Fire risk 1/10 · Minimal
- Est. fire insurance / yr
- $717 – $1,331
Heat risk 4/10 · Minor
- Hot days now (above 101°F)
- 7 days/yr
- Hot days in 30 yrs
- 19 days/yr
Wind risk 2/10 · Minimal
- Chance of severe wind over 30 yrs
- 1.0%
Air-quality risk 3/10 · Minor
- Unhealthy air days now
- 2 days/yr
- Unhealthy air days in 30 yrs
- 3 days/yr
Risk factors via First Street. Map © Google.
Why this score? — see what drove the C+ grade
The composite is a weighted blend of 9 inputs, each scored 0–100. Each bar is that input's sub-score; the figure is the points it added to the 100-point composite (weight × sub-score).
- Cash flow +30.0/30.0
- 1% rule +10.0/10.0
- DSCR +10.0/10.0
- Rent growth +3.2/5.0
- ARV discount +2.5/15.0
- Livability +2.5/5.0
- Condition / age +2.5/5.0
- Schools +1.4/10.0
- Appreciation +0.0/10.0
$60,000
🖨 Deal sheet 📄 Offer letter ✓ Due diligence
Listing remarks MLS
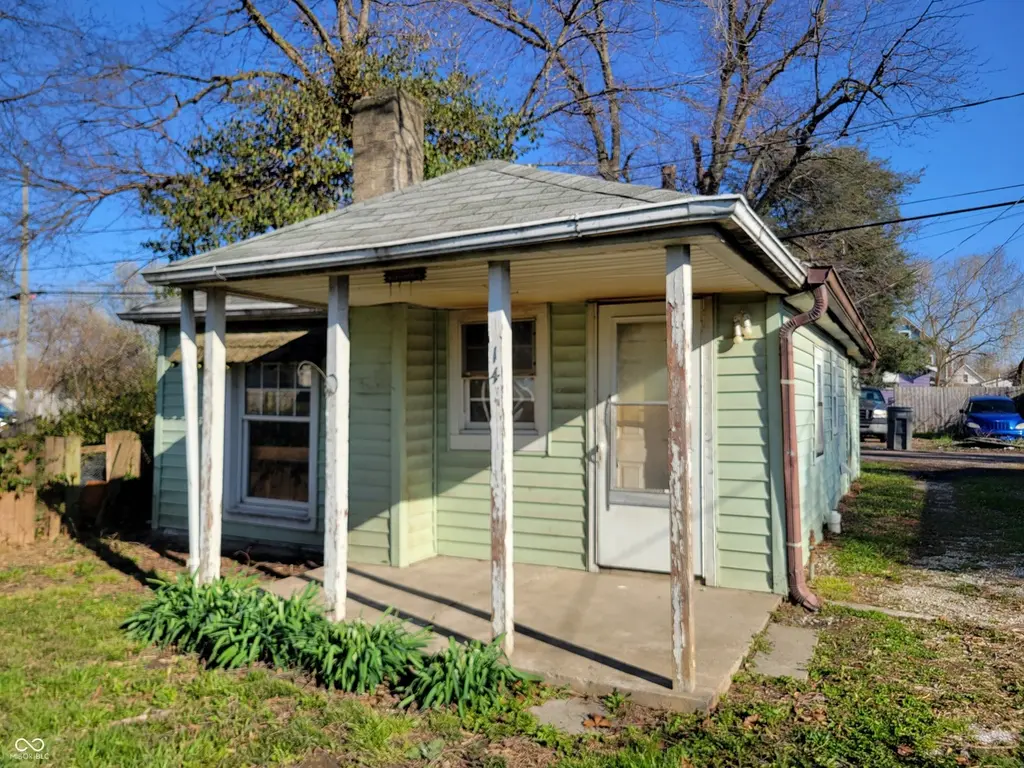
**Seller will consider owner financing offers** This property is a high-yield play for those who understand the value of density and creative site planning. The existing home sits at the rear of the lot, already taken down to the studs, saving significant time and cost on demolition. The expansive front portion of the lot provides ample buildable area for a larger primary residence or multifamily property. Benefit from established utility connections already on-site, streamlining the development process compared to a raw land purchase. Located in a neighborhood with steady growth, this is a perfect "buy and build" strategy. You can finish the rear house first to generate immediate rental income (estimated at $800/month) or live on-site while you manage the construction of a new home in the front.Whether you are looking to create a multi-unit compound or a custom primary residence with a detached guest house, the potential here is limited only by your vision!
Key facts
- 6,011 sq ft lot
- Built 1942
- Listed 50 days
Neighborhood map
What this means for you Summary
Snapshot
- This is a 1-bed/1.0-bath single-family listed at $60k.
Deal economics
- At list price, monthly cash flow is $701 ($8k/yr) — positive.
- The deal already cash-flows at list — no discount required.
- Meets the 1% rule at list price ($1k rent vs $60k).
- Recommended offer: $58k (3.0% below list) — sets the bar for market timing.
- Cap rate 20.3% vs local median 4.4% in Indianapolis city (balance) — top-decile yield for the area; either an underpriced asset or a hidden risk that comps aren't pricing in. Stress-test before assuming the spread holds.
Location & tenants
- Location reads: area grade C — affects rentability + tenant quality, not the cash-flow math above.
- Indianapolis Public Schools (urban): math 14% / reading 20% proficiency, ranked #286 of 301 in IN (top 95%) — low school quality limits family demand, transient renter base, plan for 1-2y turnover; 77% free/reduced lunch — lower-income household profile, screen leases tightly.
- Market conditions: Rents rising (+2.9%/yr); 493 active listings in the ZIP; 2 comparable units currently listed for rent nearby; 1,906 units permitted in Marion County in 2024 (621 in 5+ unit buildings).
Forward outlook
- Local home prices are declining (-3.0%/yr); year-one equity from $415 of loan paydown is wiped out by about $2k of value loss. Plan a longer hold.
- Marion County population projected at +18% by 2050 — long-run rental-demand tailwind backs the buy-and-hold thesis.
- At projected returns (-3.0% appreciation + 2.9% rent growth), your $17k cash investment doubles in ~3 years — after that, you're playing with house money.
Negotiation context
- It's been on market 50 days — a 3% lower offer ($58k) is reasonable based on typical stale-listing flexibility.
Risks & watch-outs
- Watch-outs: built in 1942 — expect roof / HVAC / electrical / plumbing capex.
Questions for the listing agent
- It's been on market 50 days. Have you received any prior offers? Is the seller open to a 3% concession, seller financing, or rate buy-down credit?
- Built in 1942 — when were the roof, HVAC, electrical panel, plumbing, and water heater last replaced?
- Is there a deadline driving the sale (1031 exchange, divorce, estate, relocation)? That informs how much negotiation room exists.
- What's the average days-on-market for RENTAL listings here right now (not sales)? A rising rental-DOM trend means longer vacancies and softer asking-rent achievability than the comps imply.
- What's the recent tenant-quality profile in this submarket — average credit score on applications, eviction rate, late-payment / NSF rate, and stable-employment percentage? A property-management company in the area should have these aggregated.
- How much new for-sale + rental construction is in the pipeline within 1–3 miles? Heavy new supply typically softens prices + rents 12–24 months out; constrained supply supports both.
Investment metrics
- 1% rule
- 2.37% ✓
- Cap rate
- 20.32%
- Cash-on-cash
- 50.10%
- DSCR
- 3.23
- GRM
- 3.5
CMA / ARV
- ARV (median comp)
- $54,011
- List price
- $60,000
- Delta
- 11.09%
- Verdict
- OVERPRICED
- Comps
- 6 within 1.0 mi
Show comp detail 3 sales within ~0.75 mi
| Address | Dist | Beds/Ba | Sqft | Sold | Price | $/sf | Match |
|---|---|---|---|---|---|---|---|
| 1424 Finley Ave | 0.00mi | 1/1.0 | 440 (0%) | 1mo | $60,000 | $136 | 99 |
| 1401 Lawton Ave | 0.68mi | 1/1.0 | 441 (+0%) | 6mo | $39,000 | $88 | 63 |
| 2364 Shelby St | 0.27mi | 2/1.0 (+1) | 400 (-9%) | 13mo | $47,500 | $119 | 57 |
Match score weights: distance 35% · size 25% · config 20% · recency 20%. Top-matched comps best support the ARV.
Projected returns pro-forma
-3.0% appreciation · 2.88% rent growth · sell at horizon
- IRR
- 47.7%
- Equity multiple
- 3.07×
- Total profit
- $34,802
- Equity at exit
- $8,946
- IRR
- 53.3%
- Equity multiple
- 6.19×
- Total profit
- $87,229
- Equity at exit
- $5,188
Cash invested: $16,800 (down + closing). Projections, not guarantees.
Landlord ↔ Tenant lean methodology
- Overall (STATE)
- 90 Strongly Landlord-Friendly
- State Indiana
- 90 Strongly Landlord-Friendly · R+11
- County
- — inherits STATE
- City
- — inherits STATE
ZIP-level market 46203
- Home prices YoY
- -26.7%
- Rents YoY
- 2.9%
- Active inventory
- 493
- Price-to-rent
- 3.5×
Monthly cashflow live
- Estimated rent
- $1,422 medium interval (Pro) →
- Mortgage (P&I)
- −$315
- Tax from tax record
- −$83 /mo · $991/yr
- Insurance
- −$25
- HOA
- −$0
- Vacancy / Maint / Mgmt
- −$299
- Net cashflow
- $701
Break-even live
UW: 25.0% down · 7.5% · 30yr · 1.5% tax · 5.0% vac · 8.0% maint · 8.0% mgmt
Financing live
Cash to close
- Down payment
- $15,000
- Closing costs
- $1,800
- Reserves months
- —
- Total cash needed
- —
Loan-product check · same deal, 3 products live
Conventional
25% down · 7.5% · 30yr
- Down + closing
- —
- Monthly P&I
- —
- Monthly cashflow
- —
- DSCR
- —
- Eligible?
- —
Personal DTI + credit; lowest rate.
DSCR
20% down · 8.5% · 30yr
- Down + closing
- —
- Monthly P&I
- —
- Monthly cashflow
- —
- DSCR
- —
- Eligible?
- —
No personal income docs; deal must DSCR.
Hard money
10% down · 12.0% · 12mo
- Down + closing
- —
- Monthly P&I
- —
- Monthly cashflow
- —
- DSCR
- —
- Eligible?
- —
Short-term bridge; refi at stabilization.
Rent comps 2 comps
| Address | Beds | Baths | Sqft | Rent | $/sqft | DOM | Units | Dist |
|---|---|---|---|---|---|---|---|---|
| 1441 Prospect St Indianapolis, IN | 2.0 | 1.0–2.0 | 2840 | $1,614 | $0.57 | 1d | 13 | 1.32mi |
| 1224 Prospect St Indianapolis, IN | 2.0 | 1.0–2.0 | 691 | $1,648 | $2.38 | 1d | 8 | 1.36mi |
Listing history 3 events
-
2026-05-13status Pending 982-char remark
Show marketing remark (982 chars)
**Seller will consider owner financing offers** This property is a high-yield play for those who understand the value of density and creative site planning. The existing home sits at the rear of the lot, already taken down to the studs, saving significant time and cost on demolition. The expansive front portion of the lot provides ample buildable area for a larger primary residence or multifamily property. Benefit from established utility connections already on-site, streamlining the development process compared to a raw land purchase. Located in a neighborhood with steady growth, this is a perfect "buy and build" strategy. You can finish the rear house first to generate immediate rental income (estimated at $800/month) or live on-site while you manage the construction of a new home in the front.Whether you are looking to create a multi-unit compound or a custom primary residence with a detached guest house, the potential here is limited only by your vision!
-
2026-04-17price $60,000 982-char remark
Show marketing remark (982 chars)
**Seller will consider owner financing offers** This property is a high-yield play for those who understand the value of density and creative site planning. The existing home sits at the rear of the lot, already taken down to the studs, saving significant time and cost on demolition. The expansive front portion of the lot provides ample buildable area for a larger primary residence or multifamily property. Benefit from established utility connections already on-site, streamlining the development process compared to a raw land purchase. Located in a neighborhood with steady growth, this is a perfect "buy and build" strategy. You can finish the rear house first to generate immediate rental income (estimated at $800/month) or live on-site while you manage the construction of a new home in the front.Whether you are looking to create a multi-unit compound or a custom primary residence with a detached guest house, the potential here is limited only by your vision!
-
2026-03-24$70,000 Active 982-char remark
Show marketing remark (982 chars)
**Seller will consider owner financing offers** This property is a high-yield play for those who understand the value of density and creative site planning. The existing home sits at the rear of the lot, already taken down to the studs, saving significant time and cost on demolition. The expansive front portion of the lot provides ample buildable area for a larger primary residence or multifamily property. Benefit from established utility connections already on-site, streamlining the development process compared to a raw land purchase. Located in a neighborhood with steady growth, this is a perfect "buy and build" strategy. You can finish the rear house first to generate immediate rental income (estimated at $800/month) or live on-site while you manage the construction of a new home in the front.Whether you are looking to create a multi-unit compound or a custom primary residence with a detached guest house, the potential here is limited only by your vision!
ⓘ Source: listings_history table (triggers on properties + properties_extension) + one-shot
backfill from property_details.listing_events for pre-trigger history.
Tax reassessment forecast IN · Partial reset (capped growth)
- Current annual tax
- $991 · $83/mo
- Projected year-2 tax
- $991 · $83/mo
- Expected delta
- $0/yr ($0/mo · 0.0%)
ⓘ Screening estimate from a state-policy table — verify with the county assessor before closing.
Climate risk First Street
- Flood 1/10 Low FEMA zone X (unshaded) · 0% chance over 30 yrs
- Wildfire 1/10 Low
- Heat 4/10 Moderate 7 d/yr ≥101°F today · 19 d/yr by 30 yrs out
- Wind 2/10 Low 100% chance of damaging wind over 30 yrs
- Air quality 3/10 Moderate 2 unhealthy d/yr today · 3 by 30 yrs out
Nearby sold comps map
Loading sold comps map…
Walkable amenities ~0.75 mi
Loading nearby amenities…
Taxation est. · year 1
- Rental income
- $17,067
- − Mortgage interest
- −$3,361
- − Property taxes
- −$991
- − Insurance
- −$300
- − Repairs & maintenance
- −$1,365
- − Management
- −$1,365
- − Depreciation
- −$1,745
- Taxable income
- $7,939
- Est. tax owed @ 24.0%
- −$1,905
- After-tax cash flow
- $6,511/yr
For passive investors: Depreciation is non-cash, so a rental often shows a tax loss while cash-flowing — sheltering income. Rental losses are passive: they offset passive income freely, and up to $25,000/yr can offset ordinary (W-2) income if you actively participate and your MAGI is under $100k (phasing out to $0 by $150k); unused losses carry forward. On sale, claimed depreciation is recaptured at up to 25%, and gains may owe capital-gains tax (a 1031 exchange can defer both). Figures are a year-1 estimate at your 24.0% rate — not tax advice; consult a CPA.
Schools (NCES district)
- District
- Indianapolis Public Schools
- NCES district ID
- 1804770
- Math proficiency
- 14% ▼ -7.00%
- Reading proficiency
- 20% ▼ -3.00%
- Median HH income
- $32,034
- Composite
- 13.69/100
- National rank
- #9499
- State rank
- #286 of 301 in IN
Livability — Indianapolis city (balance)
No livability data for this city. (Only ~50 U.S. cities are tracked.)
Census & demographics
- Census place
- Indianapolis city (balance), IN
- County
- Marion County · 998,460 people
- City population
- 881,119
- Metro
- Indianapolis-Carmel-Anderson, IN
- Population (ZIP)
- 37,758
- Household income
- $57,393
- Rent vs Own
- Severe rent burden
- 1499.0
Population outlook (Marion County) Hauer SSP2
- Today (2025)
- 1,025,572 people
- By 2030
- 1,065,727 · +3.9%
- By 2040
- 1,141,577 · +11.3%
- By 2050
- 1,208,920 · +17.9%
- By 2075
- 1,367,288 · +33.3%
- By 2100
- 1,438,201 · +40.2%
Race, ethnicity, and origin ACS 2023
- Neighborhood character
- Predominantly White (69%)
- Race & ethnicity
- White 69% Hispanic / Latino 14% Black 12% Two or more races 8% Asian 2% Native American 1%
- Hispanic origin (detail)
- Mexican 12% Puerto Rican 1%
- Common ancestry
- Slovak 2% Lithuanian 2% Italian 1%
- Foreign-born
- 8% · Canada
- Languages at home
- 88% English-only · Spanish 10% Other Indo-European 1%
Political lean MEDSL · Marion
- 2024 margin
- Strong D (+27.7) · D 63.0% · R 35.3% · Other 1.7%
- 2008→2024 swing
- -0.7pp no change · 2008: 28.4pp · 2024: 27.7pp
- All cycles
- 2024: D+27.7 2020: D+29.1 2016: D+22.8 2012: D+22.2 2008: D+28.4
Not yet ingested
- Civics
- —
Market trends
- HPI YoY
- ▼ -127.37%
- Current HPI
- 349.579
- Rent YoY
- ▲ 2.88%
- Metro
- Indianapolis-Carmel-Anderson, IN
- State GDP YoY
- ▲ 2.90%
- F500 in state
- 18
Industry mix (Fortune 500 HQ in IN)
| Industry | F500 HQs | Revenue |
|---|---|---|
| Industrial Machinery | 2 | $37B |
|
||
| Healthcare | 1 | $177B |
|
||
| Pharmaceuticals | 1 | $45B |
|
||
| Metals / Steel | 1 | $18B |
|
||
| Agriculture | 1 | $17B |
|
||
| Packaging | 1 | $12B |
|
||
Price history
-14.3% since first listed3 events — show timeline
- 2026-05-13 Pending — MIBOR as Distributed by MLS Grid
- 2026-04-17 Price Changed $60,000 MIBOR as Distributed by MLS Grid
- 2026-03-24 Listed $70,000 MIBOR as Distributed by MLS Grid
Property tax history
+10.1%/yrLatest (2025): $991 · +9.1% YoY. Source: county tax records.
Cash-flow waterfall
monthlySold comps — $/sqft
last 12 mo · ≤1 miLoading sold comps…