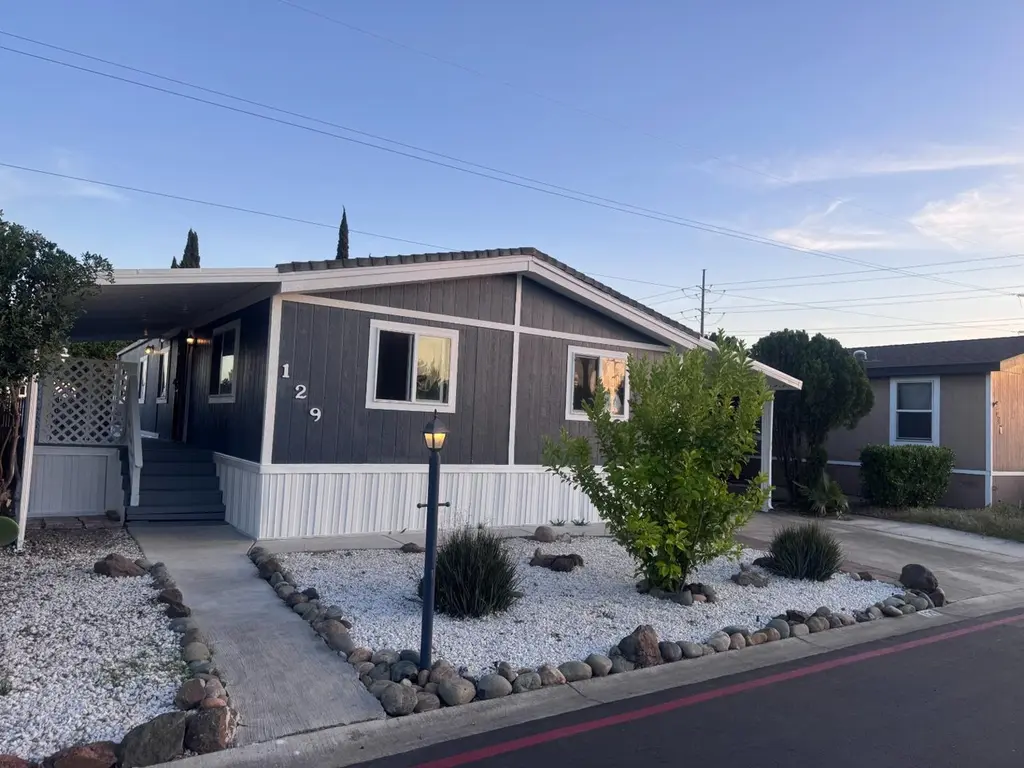
3950 Mack Rd #129 · Sacramento, CA
Flood risk 1/10 · Minimal
- FEMA flood zone
- X
- Chance of flooding over 30 yrs
- 0.0%
- Est. flood insurance / yr
- $507 – $1,088
Fire risk 4/10 · Minor
- Est. fire insurance / yr
- $659 – $1,223
Heat risk 7/10 · Major
- Hot days now (above 102°F)
- 7 days/yr
- Hot days in 30 yrs
- 14 days/yr
Wind risk 1/10 · Minimal
- Chance of severe wind over 30 yrs
- —
Air-quality risk 10/10 · Severe
- Unhealthy air days now
- 25 days/yr
- Unhealthy air days in 30 yrs
- 26 days/yr
Risk factors via First Street. Map © Google.
Why this score? — see what drove the B- grade
The composite is a weighted blend of 9 inputs, each scored 0–100. Each bar is that input's sub-score; the figure is the points it added to the 100-point composite (weight × sub-score).
- Cash flow +30.0/30.0
- 1% rule +10.0/10.0
- DSCR +10.0/10.0
- ARV discount +5.9/15.0
- Schools +4.1/10.0
- Livability +3.6/5.0
- Rent growth +2.5/5.0
- Condition / age +2.5/5.0
- Appreciation +0.0/10.0
$144,900
🖨 Deal sheet 📄 Offer letter ✓ Due diligence
Listing remarks
Discover the inviting residential property at 3950 Mack Rd #129 in Sacramento, CA. This ready-to-move-in home offers a seamless transition into a comfortable and convenient lifestyle, designed for ease and enjoyment. The property includes an attached carport, providing sheltered and direct access, enhancing both convenience and security for residents. Embrace the opportunity to experience the ease of living offered by this well-appointed Sacramento residence.
Key facts
- Direct access
- Attached carport
- Parking
Tags
Property features AI
Finance
- Other: No horses allowed; Located in Brooke Meadow subdivision
- HOA & community: No homeowners association; Community pool/spa combo available (common facility); Private pool present
Exterior
- Parking: Attached covered parking; Guest parking available; Paved driveway
- Utilities: Public water; Public sewer; Irrigation available from public district; Cable available; 220V in kitchen
- Home design: Manufactured home in a planned unit development; Built in 1983; Shingle roof; Entry level: one story
- Construction: Manufactured construction
- Exterior features: Private, low-maintenance lot; Gated community; Front landscaping; Back yard fencing (wood)
Interior
- Kitchen: Built-in gas range; Dishwasher; Microwave; Disposal; Kitchen open to family area; Wood counters
- Bedrooms: 3 bedrooms; Master bedroom with closet
- Flooring: Laminate flooring; Tile flooring
- Bathrooms: 2 full bathrooms; Master bath with shower stall and tile; Other bath(s) with tub, tub with shower over, and tile
- Heating & cooling: Central heating (gas); Hot water heating; Central air conditioning; Ceiling fans
- Interior features: Updated/remodeled interior; Front porch; Covered deck; Covered patio; Awning; Great room; Deck attached; One-level living; Stories: 1
- Laundry & utility: Laundry closet inside the home; Electric hook-ups only (washer/dryer); 220V in laundry
Neighborhood map
What this means for you Summary
Snapshot
- This is a 3-bed/2.0-bath manufactured listed at $145k.
Deal economics
- At list price, monthly cash flow is $885 ($11k/yr) — positive.
- The deal already cash-flows at list — no discount required.
- Meets the 1% rule at list price ($2k rent vs $145k).
- Recommended offer: $143k (1.5% below list) — sets the bar for market timing.
- Cap rate 13.6% vs local median 3.0% in Sacramento — top-decile yield for the area; either an underpriced asset or a hidden risk that comps aren't pricing in. Stress-test before assuming the spread holds.
Location & tenants
- Location reads 71/100 on livability (#218 in CA) — a middle-class / working-renter tenant base. Strengths: amenities A+, commute A+, housing A; Watch: schools D+, crime F, cost of living F.
- Elk Grove Unified (suburban): math 40% / reading 51% proficiency, ranked #165 of 517 in CA (top 32%) — families likely to look elsewhere, expect single-tenant / working-renter base with shorter leases.
- Market conditions: Rents flat; 181 active listings in the ZIP; 20 comparable units currently listed for rent nearby; rentals lingering (median 44d on market — plan ~5-8 weeks vacancy on turnover, expect pricing pressure); 55% of comp listings sitting > 30 days — soft ceiling on asking rent; 6,825 units permitted in Sacramento County in 2024 (1,752 in 5+ unit buildings).
- This rent runs 43% of the median local income ($67k/yr) — at the standard rent-burdened threshold; future hikes will face affordability resistance.
Forward outlook
- Local home prices are declining (-3.0%/yr); year-one equity from $1k of loan paydown is wiped out by about $4k of value loss. Plan a longer hold.
- Sacramento County population projected at +17% by 2050 — long-run rental-demand tailwind backs the buy-and-hold thesis.
- At projected returns (-3.0% appreciation + 0.0% rent growth), your $41k cash investment doubles in ~6 years — after that, you're playing with house money.
Negotiation context
- It's been on market 26 days — a 2% lower offer ($143k) is reasonable based on typical stale-listing flexibility.
Risks & watch-outs
- Climate carrying-cost: extreme-heat days projected 7→14/yr by 2055 (HVAC capex compounding) — expect insurance premiums to compound above CPI over the hold.
Questions for the listing agent
- Is there a deadline driving the sale (1031 exchange, divorce, estate, relocation)? That informs how much negotiation room exists.
- Schools are D-rated, which usually means shorter tenancies and higher turnover. Who's the typical renter profile here, and what's been the actual vacancy rate?
- Crime grade is F in this area — have there been break-ins, vandalism, or insurance claims at this property in the last 3 years? What carrier currently insures it and at what premium?
- What's the average days-on-market for RENTAL listings here right now (not sales)? A rising rental-DOM trend means longer vacancies and softer asking-rent achievability than the comps imply.
- What's the recent tenant-quality profile in this submarket — average credit score on applications, eviction rate, late-payment / NSF rate, and stable-employment percentage? A property-management company in the area should have these aggregated.
- How much new for-sale + rental construction is in the pipeline within 1–3 miles? Heavy new supply typically softens prices + rents 12–24 months out; constrained supply supports both.
Investment metrics
- 1% rule
- 1.65% ✓
- Cap rate
- 13.63%
- Cash-on-cash
- 26.19%
- DSCR
- 2.17
- GRM
- 5.1
CMA / ARV
- ARV (on-the-fly)
- $140,000
- Comps found
- 4
Show comp detail 4 sales within ~0.75 mi
| Address | Dist | Beds/Ba | Sqft | Sold | Price | $/sf | Match |
|---|---|---|---|---|---|---|---|
| 3950 Mack Rd #186 | 0.16mi | 3/2.0 | 1,410 (+1%) | 13mo | $205,413 | $146 | 80 |
| 3950 Mack Rd #175 | 0.05mi | 3/2.0 | 1,568 (+12%) | 3mo | $140,000 | $89 | 75 |
| 3950 Mack Rd #13 | 0.25mi | 2/2.0 (-1) | 1,344 (-4%) | 24mo | $119,000 | $89 | 57 |
| 3950 Mack Rd #43 | 0.19mi | 3/2.0 | 1,600 (+14%) | 23mo | $160,000 | $100 | 48 |
Match score weights: distance 35% · size 25% · config 20% · recency 20%. Top-matched comps best support the ARV.
Projected returns pro-forma
-3.0% appreciation · 0.02% rent growth · sell at horizon
- IRR
- 16.5%
- Equity multiple
- 1.64×
- Total profit
- $25,999
- Equity at exit
- $21,605
- IRR
- 22.8%
- Equity multiple
- 2.69×
- Total profit
- $68,520
- Equity at exit
- $12,528
Cash invested: $40,572 (down + closing). Projections, not guarantees.
Landlord ↔ Tenant lean methodology
- Overall (STATE)
- 18 Strongly Tenant-Friendly
- State California
- 18 Strongly Tenant-Friendly · D+13
- County
- — inherits STATE
- City
- — inherits STATE
ZIP-level market 95823
- Rents YoY
- 0.0%
- Active inventory
- 181
- Price-to-rent
- 5.1×
Monthly cashflow live
- Estimated rent
- $2,388 high interval (Pro) →
- Mortgage (P&I)
- −$760
- Tax est. 1.5%
- −$181 /mo · $2,174/yr
- Insurance
- −$60
- HOA
- −$0
- Vacancy / Maint / Mgmt
- −$502
- Net cashflow
- $885
Break-even live
UW: 25.0% down · 7.5% · 30yr · 1.5% tax · 5.0% vac · 8.0% maint · 8.0% mgmt
Financing live
Cash to close
- Down payment
- $36,225
- Closing costs
- $4,347
- Reserves months
- —
- Total cash needed
- —
Loan-product check · same deal, 3 products live
Conventional
25% down · 7.5% · 30yr
- Down + closing
- —
- Monthly P&I
- —
- Monthly cashflow
- —
- DSCR
- —
- Eligible?
- —
Personal DTI + credit; lowest rate.
DSCR
20% down · 8.5% · 30yr
- Down + closing
- —
- Monthly P&I
- —
- Monthly cashflow
- —
- DSCR
- —
- Eligible?
- —
No personal income docs; deal must DSCR.
Hard money
10% down · 12.0% · 12mo
- Down + closing
- —
- Monthly P&I
- —
- Monthly cashflow
- —
- DSCR
- —
- Eligible?
- —
Short-term bridge; refi at stabilization.
Rent comps 20 comps
| Address | Beds | Baths | Sqft | Rent | $/sqft | DOM | Units | Dist |
|---|---|---|---|---|---|---|---|---|
| 7726 Laurie Way Sacramento, CA | 3.0 | 1.0 | 1069 | $2,075 | $1.94 | 7d | 1 | 0.23mi |
| 7570 Wrenwood Dr Sacramento, CA | 3.0 | 2.0 | 1535 | $2,395 | $1.56 | 43d | 1 | 0.48mi |
| 4074 Weymouth Ln Sacramento, CA | 2.0 | 2.0 | 1200 | $2,498 | $2.08 | 17d | 1 | 0.63mi |
| 4066 Weymouth Ln Sacramento, CA | 3.0 | 1.5 | 1323 | $1,900 | $1.44 | 43d | 1 | 0.64mi |
| 7826 Brizio Walk Sacramento, CA | 3.0 | 2.5 | 1616 | $2,950 | $1.83 | 2d | 1 | 0.69mi |
| 4264 Chinquapin Way Sacramento, CA | 2.0 | 1.0 | 900 | $2,195 | $2.44 | 43d | 1 | 0.90mi |
| 4400 Shining Star Dr Sacramento, CA | 1.0–4.0 | 1.0–2.0 | 1225 | $2,768 | $2.26 | 43d | 1 | 0.93mi |
| 4690 Brookfield Dr Sacramento, CA | 4.0 | 2.0 | 1753 | $2,500 | $1.43 | 19d | 1 | 0.93mi |
| 3249 Torrance Ave Sacramento, CA | 3.0 | 3.0 | 1258 | $2,599 | $2.07 | 23d | 1 | 0.98mi |
| 7638 24th St Sacramento, CA | 2.0 | 1.0 | 976 | $1,900 | $1.95 | 43d | 1 | 1.02mi |
| 4623 Goya Pkwy Sacramento, CA | 3.0 | 2.0 | 1242 | $2,400 | $1.93 | 43d | 1 | 1.11mi |
| 4407 Bouts Pkwy Sacramento, CA | 3.0 | 1.0 | 1024 | $1,950 | $1.90 | 43d | 1 | 1.12mi |
| 26 Nedra Ct Sacramento, CA | 2.0 | 1.0 | 980 | $1,650 | $1.68 | 43d | 1 | 1.12mi |
| 26 Nedra Ct Unit A1 Sacramento, CA | 2.0 | 1.0 | 980 | $1,650 | $1.68 | 20d | 1 | 1.12mi |
| 4417 A Pkwy Sacramento, CA | 3.0 | 2.0 | 1440 | $2,200 | $1.53 | 43d | 1 | 1.22mi |
| 4985 Valley Hi Dr Sacramento, CA | 3.0 | 2.0 | 1507 | $2,300 | $1.53 | 43d | 1 | 1.23mi |
| 7663 22nd St Sacramento, CA | 4.0 | 2.0 | 1800 | $1,999 | $1.11 | 23d | 1 | 1.30mi |
| 4812 D Pkwy Sacramento, CA | 3.0 | 1.5 | 1505 | $2,295 | $1.52 | 23d | 1 | 1.45mi |
| 451 Ashwick Loop Sacramento, CA | 3.0 | 2.5 | 1538 | $2,395 | $1.56 | 7d | 1 | 1.48mi |
| 7640 Walsh Way Sacramento, CA | 3.0 | 2.0 | 1301 | $2,695 | $2.07 | 43d | 1 | 1.50mi |
Listing history 14 events
-
2026-06-18days on market $144,900 Active 26 DOM
-
2026-06-17days on market $144,900 Active 25 DOM
-
2026-06-16days on market $144,900 Active 24 DOM
-
2026-06-15days on market $144,900 Active 23 DOM
-
2026-06-13days on market $144,900 Active 21 DOM
-
2026-06-13days on market $144,900 Active 20 DOM
-
2026-06-09days on market $144,900 Active 17 DOM
-
2026-06-08days on market $144,900 Active 16 DOM
-
2026-06-07days on market $144,900 Active 15 DOM
-
2026-06-05days on market $144,900 Active 12 DOM
-
2026-06-03days on market $144,900 Active 11 DOM
-
2026-06-02days on market $144,900 Active 10 DOM
-
2026-06-01days on market $144,900 Active 9 DOM
-
2026-05-31days on market $144,900 Active 8 DOM
ⓘ Source: listings_history table (triggers on properties + properties_extension) + one-shot
backfill from property_details.listing_events for pre-trigger history.
Climate risk First Street
- Flood 1/10 Low FEMA zone X · 0% chance over 30 yrs
- Wildfire 4/10 Moderate
- Heat 7/10 Severe 7 d/yr ≥102°F today · 14 d/yr by 30 yrs out
- Wind 1/10 Low
- Air quality 10/10 Extreme 25 unhealthy d/yr today · 26 by 30 yrs out
Nearby sold comps map
Loading sold comps map…
Walkable amenities ~0.75 mi
Loading nearby amenities…
Taxation est. · year 1
- Rental income
- $28,661
- − Mortgage interest
- −$8,117
- − Property taxes
- −$2,174
- − Insurance
- −$724
- − Repairs & maintenance
- −$2,293
- − Management
- −$2,293
- − Depreciation
- −$4,215
- Taxable income
- $8,845
- Est. tax owed @ 24.0%
- −$2,123
- After-tax cash flow
- $8,503/yr
For passive investors: Depreciation is non-cash, so a rental often shows a tax loss while cash-flowing — sheltering income. Rental losses are passive: they offset passive income freely, and up to $25,000/yr can offset ordinary (W-2) income if you actively participate and your MAGI is under $100k (phasing out to $0 by $150k); unused losses carry forward. On sale, claimed depreciation is recaptured at up to 25%, and gains may owe capital-gains tax (a 1031 exchange can defer both). Figures are a year-1 estimate at your 24.0% rate — not tax advice; consult a CPA.
Schools (NCES district)
- District
- Elk Grove Unified
- NCES district ID
- 0612330
- Math proficiency
- 40% ▼ -5.00%
- Reading proficiency
- 51% ▼ -5.00%
- Median HH income
- $67,860
- Composite
- 40.72/100
- National rank
- #3658
- State rank
- #165 of 517 in CA
Livability — Sacramento
- Score
- 71/100
- State rank
- #218
- US rank
- #6957
Category grades
Schools grade is shown separately in the Schools card above.
Census & demographics
- Census place
- Sacramento, CA
- County
- Sacramento County · 1,539,646 people
- City population
- 761,410
- Metro
- Sacramento-Roseville-Folsom, CA
- Population (ZIP)
- 83,607
- Household income
- $66,895
- Rent vs Own
- Severe rent burden
- 4034.0
Population outlook (Sacramento County) Hauer SSP2
- Today (2025)
- 1,660,763 people
- By 2030
- 1,732,990 · +4.3%
- By 2040
- 1,855,755 · +11.7%
- By 2050
- 1,941,335 · +16.9%
- By 2075
- 2,046,162 · +23.2%
- By 2100
- 1,961,444 · +18.1%
Race, ethnicity, and origin ACS 2023
- Neighborhood character
- Highly diverse neighborhood (Simpson 0.77)
- Race & ethnicity
- Hispanic / Latino 35% Asian 25% Black 17% Two or more races 16% White 11% Pacific Islander 4% Native American 1%
- Hispanic origin (detail)
- Mexican 29% Puerto Rican 1%
- Common ancestry
- Lithuanian 1% Italian 1% Scotch-Irish 1%
- Foreign-born
- 30% · Canada, Vietnam, China
- Languages at home
- 47% English-only · Spanish 25% Other Asian/Pacific 9% Other Indo-European 8%
Political lean MEDSL · Sacramento
- 2024 margin
- D (+19.7) · D 58.1% · R 38.4% · Other 3.5%
- 2008→2024 swing
- +0.7pp no change · 2008: 19.0pp · 2024: 19.7pp
- All cycles
- 2024: D+19.7 2020: D+25.3 2016: D+23.7 2012: D+16.3 2008: D+19.0
Not yet ingested
- Civics
- —
Market trends
- HPI YoY
- ▼ -331.02%
- Current HPI
- 377.4278
- Rent YoY
- ▬ 0.02%
- Metro
- Sacramento-Roseville-Folsom, CA
- State GDP YoY
- ▲ 3.21%
- F500 in state
- 116
Industry mix (Fortune 500 HQ in CA)
| Industry | F500 HQs | Revenue |
|---|---|---|
| Technology | 27 | $1,492B |
|
||
| Financial Services | 3 | $174B |
|
||
| Retail | 3 | $44B |
|
||
| Insurance | 3 | $26B |
|
||
| Media / Entertainment | 2 | $115B |
|
||
| Pharmaceuticals / Biotech | 2 | $62B |
|
||
Property tax history
+2.5%/yrLatest (2025): $201 · -2.4% YoY. Source: county tax records.
Cash-flow waterfall
monthlySold comps — $/sqft
last 12 mo · ≤1 miLoading sold comps…