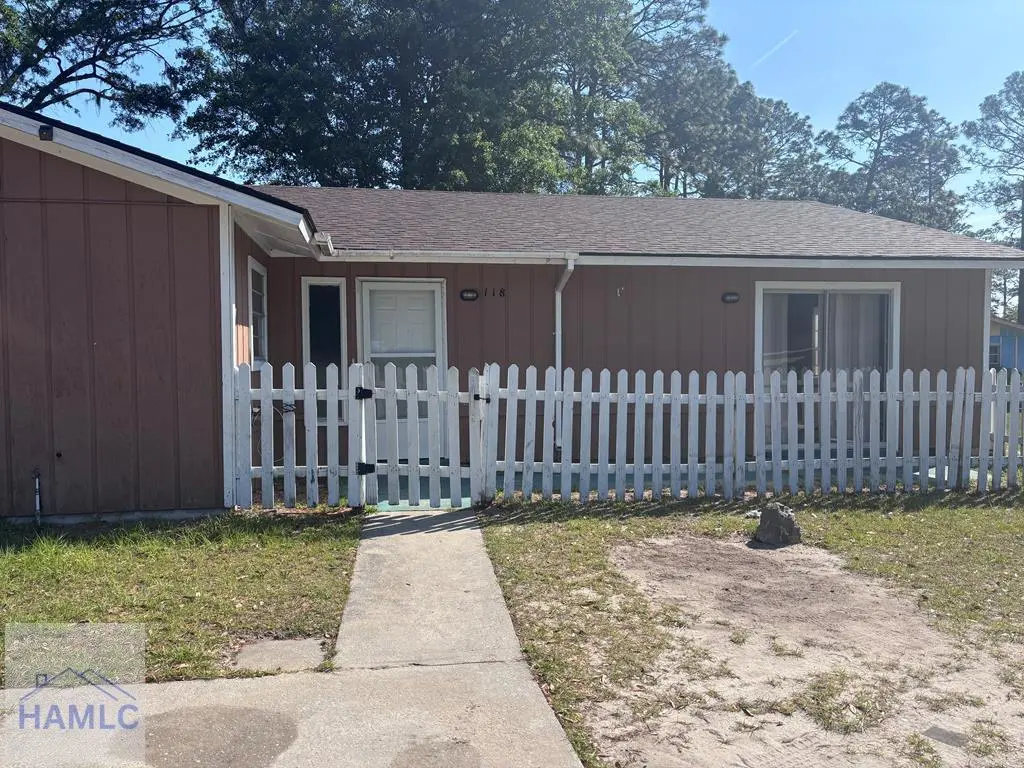
118 Cherokee Cir · Hinesville, GA
Flood risk 1/10 · Minimal
- FEMA flood zone
- X (unshaded)
- Chance of flooding over 30 yrs
- 0.0%
- Est. flood insurance / yr
- $507 – $1,088
Fire risk 5/10 · Moderate
- Est. fire insurance / yr
- $963 – $1,789
Heat risk 9/10 · Severe
- Hot days now (above 110°F)
- 7 days/yr
- Hot days in 30 yrs
- 18 days/yr
Wind risk 8/10 · Major
- Chance of severe wind over 30 yrs
- 99.0%
Air-quality risk 2/10 · Minimal
- Unhealthy air days now
- 2 days/yr
- Unhealthy air days in 30 yrs
- 2 days/yr
Risk factors via First Street. Map © Google.
Why this score? — see what drove the B- grade
The composite is a weighted blend of 9 inputs, each scored 0–100. Each bar is that input's sub-score; the figure is the points it added to the 100-point composite (weight × sub-score).
- Cash flow +24.5/30.0
- ARV discount +15.0/15.0
- DSCR +7.9/10.0
- 1% rule +6.6/10.0
- Rent growth +3.9/5.0
- Livability +3.7/5.0
- Condition / age +2.5/5.0
- Schools +2.0/10.0
- Appreciation +0.0/10.0
$140,000
🖨 Deal sheet 📄 Offer letter ✓ Due diligence
Listing remarks MLS
Price Improvement!!! Welcome to 118 Cherokee! Don't miss this updated 3 bedroom, 2 bath duplex offering 1,200 sq feet of comfortable living space! Conveniently located near shopping, dining, and just a short drive to Ft. Stewart, this property is perfect for homeowners or investors alike. Recent updates include fresh paint and new carpet, giving the home a clean, modern feel. The layout offers a functional flow with ample living space. Schedule your showing today! Property is being sold AS IS.
Key facts
- Built 1979
- Listed 28 days
Neighborhood map
What this means for you Summary
Snapshot
- This is a 3-bed/2.0-bath single-family listed at $140k.
Deal economics
- At list price, monthly cash flow is $286 ($3k/yr) — positive.
- The deal already cash-flows at list — no discount required.
- Meets the 1% rule at list price ($2k rent vs $140k).
- Recommended offer: $138k (1.5% below list) — sets the bar for market timing.
- Cap rate 8.7% vs local median 5.2% in Hinesville — top-decile yield for the area; either an underpriced asset or a hidden risk that comps aren't pricing in. Stress-test before assuming the spread holds.
Location & tenants
- Location reads 73/100 on livability (#51 in GA) — a middle-class / working-renter tenant base. Strengths: cost of living A+, housing A+, health & safety A+; Watch: schools D+, commute D+, crime F.
- Liberty County (urban): math 19% / reading 28% proficiency, ranked #133 of 174 in GA (top 76%) — low school quality limits family demand, transient renter base, plan for 1-2y turnover.
- Market conditions: Rents rising fast (+5.4%/yr); 612 active listings in the ZIP; 22 comparable units currently listed for rent nearby; rentals lingering (median 44d on market — plan ~5-8 weeks vacancy on turnover, expect pricing pressure); 100% of comp listings sitting > 30 days — soft ceiling on asking rent; 471 units permitted in Liberty County in 2024 (0 in 5+ unit buildings).
- This rent runs 32% of the median local income ($60k/yr) — at the standard rent-burdened threshold; future hikes will face affordability resistance.
Forward outlook
- Local home prices are declining (-3.0%/yr); year-one equity from $968 of loan paydown is wiped out by about $4k of value loss. Plan a longer hold.
- Liberty County population projected to shrink 8% by 2050 — rents likely to lag national; underwrite the cash flow, not the appreciation.
- At projected returns (-3.0% appreciation + 5.4% rent growth), your $39k cash investment doubles in ~9 years — after that, you're playing with house money.
Negotiation context
- It's been on market 28 days — a 2% lower offer ($138k) is reasonable based on typical stale-listing flexibility.
- 4 sale attempts since 5y ago with the ask held roughly flat each time — persistent listings suggest the price (not the market) is what's stuck; bring a comps-based counter.
- Current owner paid $72k; list at $140k implies a 93% gain — meaningful room to come down on a strong offer.
Risks & watch-outs
- Climate carrying-cost: severe wind risk, 99% chance of damaging wind over 30y; moderate wildfire risk; extreme-heat days projected 7→18/yr by 2055 (HVAC capex compounding) — expect insurance premiums to compound above CPI over the hold.
Questions for the listing agent
- Built in 1979 — when were the roof, HVAC, electrical panel, plumbing, and water heater last replaced?
- Is there a deadline driving the sale (1031 exchange, divorce, estate, relocation)? That informs how much negotiation room exists.
- Schools are D-rated, which usually means shorter tenancies and higher turnover. Who's the typical renter profile here, and what's been the actual vacancy rate?
- Crime grade is F in this area — have there been break-ins, vandalism, or insurance claims at this property in the last 3 years? What carrier currently insures it and at what premium?
- What's the average days-on-market for RENTAL listings here right now (not sales)? A rising rental-DOM trend means longer vacancies and softer asking-rent achievability than the comps imply.
- What's the recent tenant-quality profile in this submarket — average credit score on applications, eviction rate, late-payment / NSF rate, and stable-employment percentage? A property-management company in the area should have these aggregated.
- How much new for-sale + rental construction is in the pipeline within 1–3 miles? Heavy new supply typically softens prices + rents 12–24 months out; constrained supply supports both.
Investment metrics
- 1% rule
- 1.16% ✓
- Cap rate
- 8.75%
- Cash-on-cash
- 8.76%
- DSCR
- 1.39
- GRM
- 7.2
CMA / ARV
- ARV (median comp)
- $192,368
- List price
- $140,000
- Delta
- -27.22%
- Verdict
- UNDERPRICED
- Comps
- 20 within 1.0 mi
Show comp detail 12 sales within ~0.75 mi
| Address | Dist | Beds/Ba | Sqft | Sold | Price | $/sf | Match |
|---|---|---|---|---|---|---|---|
| 1064 Desert Shield St | 0.40mi | 3/2.0 | 1,178 (-2%) | 4mo | $199,900 | $170 | 75 |
| 1104 Tomcat Trl Trl | 0.48mi | 3/2.0 | 1,245 (+4%) | 2mo | $237,000 | $190 | 69 |
| 735 Kadi Ln | 0.61mi | 3/2.0 | 1,290 (+8%) | 0mo | $208,500 | $162 | 59 |
| 927 Charles C Frasier Blvd | 0.31mi | 3/2.0 | 1,379 (+15%) | 6mo | $210,000 | $152 | 56 |
| 106 Deann Dr | 0.64mi | 3/1.5 | 1,285 (+7%) | 2mo | $224,900 | $175 | 55 |
| 1110 Apache Aly | 0.48mi | 3/2.0 | 1,106 (-8%) | 12mo | $204,500 | $185 | 55 |
| 222 Glenn Bryant Rd | 0.71mi | 3/2.0 | 1,111 (-7%) | 1mo | $219,900 | $198 | 54 |
| 624 Honey Ridge Ln | 0.65mi | 4/2.0 (+1) | 1,302 (+8%) | 1mo | $199,900 | $154 | 50 |
| 124 Deann Dr | 0.68mi | 3/2.0 | 1,269 (+6%) | 11mo | $202,000 | $159 | 49 |
| 1052 Phantom Ter | 0.55mi | 3/2.0 | 1,032 (-14%) | 4mo | $217,400 | $211 | 48 |
| 905 Greenbriar Rd | 0.47mi | 4/1.0 (+1) | 1,300 (+8%) | 9mo | $194,900 | $150 | 48 |
| 1032 Varnedoe St | 0.71mi | 4/2.0 (+1) | 1,288 (+7%) | 8mo | $230,000 | $179 | 43 |
Match score weights: distance 35% · size 25% · config 20% · recency 20%. Top-matched comps best support the ARV.
Projected returns pro-forma
-3.0% appreciation · 5.41% rent growth · sell at horizon
- IRR
- -0.3%
- Equity multiple
- 0.99×
- Total profit
- $-393
- Equity at exit
- $20,874
- IRR
- 11.8%
- Equity multiple
- 2.04×
- Total profit
- $40,630
- Equity at exit
- $12,105
Cash invested: $39,200 (down + closing). Projections, not guarantees.
Landlord ↔ Tenant lean methodology
- Overall (STATE)
- 90 Strongly Landlord-Friendly
- State Georgia
- 90 Strongly Landlord-Friendly · R+3
- County
- — inherits STATE
- City
- — inherits STATE
ZIP-level market 31313
- Home prices YoY
- -27.1%
- Rents YoY
- 5.4%
- Active inventory
- 612
- Price-to-rent
- 7.2×
Monthly cashflow live
- Estimated rent
- $1,619 high interval (Pro) →
- Mortgage (P&I)
- −$734
- Tax from tax record
- −$200 /mo · $2,404/yr
- Insurance
- −$58
- HOA
- −$0
- Vacancy / Maint / Mgmt
- −$340
- Net cashflow
- $286
Break-even live
UW: 25.0% down · 7.5% · 30yr · 1.5% tax · 5.0% vac · 8.0% maint · 8.0% mgmt
Financing live
Cash to close
- Down payment
- $35,000
- Closing costs
- $4,200
- Reserves months
- —
- Total cash needed
- —
Loan-product check · same deal, 3 products live
Conventional
25% down · 7.5% · 30yr
- Down + closing
- —
- Monthly P&I
- —
- Monthly cashflow
- —
- DSCR
- —
- Eligible?
- —
Personal DTI + credit; lowest rate.
DSCR
20% down · 8.5% · 30yr
- Down + closing
- —
- Monthly P&I
- —
- Monthly cashflow
- —
- DSCR
- —
- Eligible?
- —
No personal income docs; deal must DSCR.
Hard money
10% down · 12.0% · 12mo
- Down + closing
- —
- Monthly P&I
- —
- Monthly cashflow
- —
- DSCR
- —
- Eligible?
- —
Short-term bridge; refi at stabilization.
Rent comps 22 comps
| Address | Beds | Baths | Sqft | Rent | $/sqft | DOM | Units | Dist |
|---|---|---|---|---|---|---|---|---|
| 108 Cherokee Cir Hinesville, GA | 3.0 | 2.0 | 1208 | $1,275 | $1.06 | 43d | 1 | 0.04mi |
| 172 Cherokee Cir Hinesville, GA | 3.0 | 2.0 | 1290 | $1,550 | $1.20 | 43d | 1 | 0.09mi |
| 131 Pointe South Dr Hinesville, GA | 2.0 | 1.0 | 960 | $1,950 | $2.03 | 43d | 1 | 0.53mi |
| 910 Brett Dr Hinesville, GA | 2.0–3.0 | 2.0 | 957 | $1,600 | $1.67 | 44d | 3 | 0.56mi |
| 910 Brett Dr Hinesville, GA | 2.0–3.0 | 2.0 | 957 | $1,600 | $1.67 | 43d | 4 | 0.56mi |
| 134 Pointe South Dr Hinesville, GA | 2.0 | 1.0 | 840 | $1,195 | $1.42 | 43d | 1 | 0.57mi |
| 286 Whitetail Cir Hinesville, GA | 3.0 | 2.0 | 1274 | $1,600 | $1.26 | 43d | 1 | 0.85mi |
| 1458 Sheridan Pt Hinesville, GA | 3.0 | 2.0 | 1400 | $1,800 | $1.29 | 43d | 1 | 0.86mi |
| 1456 Coalition Cir Hinesville, GA | 3.0 | 2.0 | 1424 | $1,700 | $1.19 | 43d | 1 | 0.86mi |
| 1012 White Cir Hinesville, GA | 3.0 | 1.0 | 1050 | $1,300 | $1.24 | 43d | 1 | 0.88mi |
| 250 Garden Cir Hinesville, GA | 3.0 | 2.0 | 1140 | $1,750 | $1.54 | 43d | 1 | 0.95mi |
| 255 Glenn Bryant Rd Hinesville, GA | 3.0 | 1.0 | 1075 | $1,700 | $1.58 | 43d | 1 | 0.96mi |
| 727 S Main St Hinesville, GA | 2.0–3.0 | 1.5 | 1286 | $1,450 | $1.13 | 43d | 3 | 1.00mi |
| 220 Garden Cir Hinesville, GA | 3.0 | 1.5 | 1323 | $1,650 | $1.25 | 43d | 1 | 1.02mi |
| 1100 Pineland Ave Hinesville, GA | 2.0 | 2.5 | 1412 | $1,575 | $1.12 | 43d | 2 | 1.05mi |
| 732 Fleming Rd Hinesville, GA | 3.0 | 1.5 | 1348 | $1,400 | $1.04 | 43d | 1 | 1.10mi |
| 814 Lesa St Hinesville, GA | 2.0 | 1.5 | 1152 | $950 | $0.82 | 43d | 1 | 1.13mi |
| 662 Mahoney Rd Hinesville, GA | 3.0 | 2.0 | 1196 | $1,795 | $1.50 | 43d | 1 | 1.16mi |
| 1069 Kelly Dr Hinesville, GA | 3.0 | 1.5 | 1270 | $1,350 | $1.06 | 43d | 1 | 1.22mi |
| 635 Maxwell St Hinesville, GA | 3.0 | 1.0 | 950 | $1,700 | $1.79 | 43d | 1 | 1.24mi |
| 912 Pineland Ave Hinesville, GA | 3.0 | 2.5 | 1428 | $1,648 | $1.15 | 43d | 1 | 1.33mi |
| 1113 Kelly Dr Hinesville, GA | 2.0 | 2.0 | 858 | $995 | $1.16 | 43d | 1 | 1.35mi |
Listing history 9 events
-
2026-05-18status Pending 498-char remark
Show marketing remark (498 chars)
Price Improvement!!! Welcome to 118 Cherokee! Don't miss this updated 3 bedroom, 2 bath duplex offering 1,200 sq feet of comfortable living space! Conveniently located near shopping, dining, and just a short drive to Ft. Stewart, this property is perfect for homeowners or investors alike. Recent updates include fresh paint and new carpet, giving the home a clean, modern feel. The layout offers a functional flow with ample living space. Schedule your showing today! Property is being sold AS IS.
-
2026-05-12price $140,000 498-char remark
Show marketing remark (498 chars)
Price Improvement!!! Welcome to 118 Cherokee! Don't miss this updated 3 bedroom, 2 bath duplex offering 1,200 sq feet of comfortable living space! Conveniently located near shopping, dining, and just a short drive to Ft. Stewart, this property is perfect for homeowners or investors alike. Recent updates include fresh paint and new carpet, giving the home a clean, modern feel. The layout offers a functional flow with ample living space. Schedule your showing today! Property is being sold AS IS.
-
2026-04-20$145,000 Active 498-char remark
Show marketing remark (498 chars)
Price Improvement!!! Welcome to 118 Cherokee! Don't miss this updated 3 bedroom, 2 bath duplex offering 1,200 sq feet of comfortable living space! Conveniently located near shopping, dining, and just a short drive to Ft. Stewart, this property is perfect for homeowners or investors alike. Recent updates include fresh paint and new carpet, giving the home a clean, modern feel. The layout offers a functional flow with ample living space. Schedule your showing today! Property is being sold AS IS.
-
2021-05-17soldstatus $72,500
-
2021-04-21soldstatus $72,500
-
2021-04-21soldstatus $72,500
-
2021-04-02$80,000
-
2021-04-02$80,000
-
2021-04-02$80,000
ⓘ Source: listings_history table (triggers on properties + properties_extension) + one-shot
backfill from property_details.listing_events for pre-trigger history.
Tax reassessment forecast GA · Resets to sale price
- Current annual tax
- $2,404 · $200/mo
- Projected year-2 tax
- $2,404 · $200/mo
- Expected delta
- $0/yr ($0/mo · 0.0%)
ⓘ Screening estimate from a state-policy table — verify with the county assessor before closing.
Climate risk First Street
- Flood 1/10 Low FEMA zone X (unshaded) · 0% chance over 30 yrs
- Wildfire 5/10 Major
- Heat 9/10 Extreme 7 d/yr ≥110°F today · 18 d/yr by 30 yrs out
- Wind 8/10 Severe 99% chance of damaging wind over 30 yrs
- Air quality 2/10 Low 2 unhealthy d/yr today · 2 by 30 yrs out
Nearby sold comps map
Loading sold comps map…
Walkable amenities ~0.75 mi
Loading nearby amenities…
Taxation est. · year 1
- Rental income
- $19,429
- − Mortgage interest
- −$7,842
- − Property taxes
- −$2,404
- − Insurance
- −$700
- − Repairs & maintenance
- −$1,554
- − Management
- −$1,554
- − Depreciation
- −$4,073
- Taxable income
- $1,302
- Est. tax owed @ 24.0%
- −$312
- After-tax cash flow
- $3,123/yr
For passive investors: Depreciation is non-cash, so a rental often shows a tax loss while cash-flowing — sheltering income. Rental losses are passive: they offset passive income freely, and up to $25,000/yr can offset ordinary (W-2) income if you actively participate and your MAGI is under $100k (phasing out to $0 by $150k); unused losses carry forward. On sale, claimed depreciation is recaptured at up to 25%, and gains may owe capital-gains tax (a 1031 exchange can defer both). Figures are a year-1 estimate at your 24.0% rate — not tax advice; consult a CPA.
Schools (NCES district)
- District
- Liberty County
- NCES district ID
- 1303300
- Math proficiency
- 19% ▼ -16.00%
- Reading proficiency
- 28% ▼ -13.00%
- Median HH income
- $43,911
- Composite
- 20.2/100
- National rank
- #8630
- State rank
- #133 of 174 in GA
Livability — Hinesville
- Score
- 73/100
- State rank
- #51
- US rank
- #5200
Category grades
Schools grade is shown separately in the Schools card above.
Census & demographics
- Census place
- Hinesville, GA
- County
- Liberty County · 58,565 people
- City population
- 42,838
- Metro
- Hinesville, GA
- Population (ZIP)
- 42,838
- Household income
- $60,233
- Rent vs Own
- Severe rent burden
- 1693.0
Population outlook (Liberty County) Hauer SSP2
- Today (2025)
- 58,689 people
- By 2030
- 57,670 · -1.7%
- By 2040
- 55,750 · -5.0%
- By 2050
- 54,155 · -7.7%
- By 2075
- 58,947 · +0.4%
- By 2100
- 66,919 · +14.0%
Race, ethnicity, and origin ACS 2023
- Neighborhood character
- Diverse neighborhood (Simpson 0.67)
- Race & ethnicity
- Black 47% White 31% Hispanic / Latino 13% Two or more races 11% Asian 2%
- Hispanic origin (detail)
- Mexican 4% Puerto Rican 7%
- Common ancestry
- Slovak 1% Italian 1% Lithuanian 1%
- Foreign-born
- 7% · Canada, South Korea
- Languages at home
- 86% English-only · Spanish 7% Other Indo-European 2% German/W. Germanic 1%
Political lean MEDSL · Liberty
- 2024 margin
- D (+17.4) · D 58.5% · R 41.0%
- 2008→2024 swing
- -10.9pp toward R · 2008: 28.4pp · 2024: 17.4pp
- All cycles
- 2024: D+17.4 2020: D+24.1 2016: D+21.2 2012: D+30.2 2008: D+28.4
Not yet ingested
- Civics
- —
Market trends
- HPI YoY
- ▼ -77.50%
- Current HPI
- 208.0927
- Rent YoY
- ▲ 5.41%
- Metro
- Hinesville, GA
- State GDP YoY
- ▲ 2.66%
- F500 in state
- 28
Industry mix (Fortune 500 HQ in GA)
| Industry | F500 HQs | Revenue |
|---|---|---|
| Paper / Packaging | 2 | $29B |
|
||
| Retail | 1 | $160B |
|
||
| Transportation / Logistics | 1 | $91B |
|
||
| Airlines | 1 | $62B |
|
||
| Consumer Goods | 1 | $47B |
|
||
| Utilities | 1 | $25B |
|
||
Price history
+75.0% since first listed9 events — show timeline
- 2026-05-18 Pending — HABR
- 2026-05-12 Price Changed $140,000 HABR
- 2026-04-20 Listed $145,000 HABR
- 2021-05-17 Sold (Public Records) $72,500 Public Records
- 2021-04-21 Sold (MLS) $72,500 HABR
- 2021-04-21 Sold (MLS) $72,500 Hive MLS
- 2021-04-02 Listed $80,000 HABR
- 2021-04-02 Listed $80,000 Hive MLS
- 2021-04-02 Listed $80,000 Hive MLS
Property tax history
+7.2%/yrLatest (2025): $2,404 · +38.6% YoY. Source: county tax records.
Cash-flow waterfall
monthlySold comps — $/sqft
last 12 mo · ≤1 miLoading sold comps…