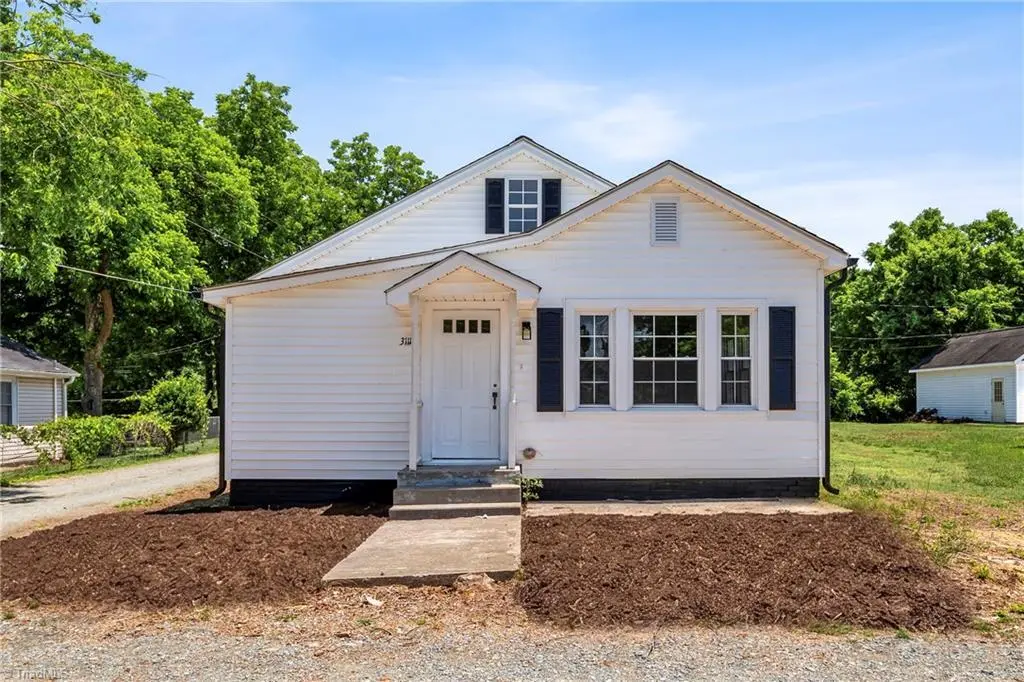
3111 Lucas St · Ossipee, NC
Flood risk 1/10 · Minimal
- FEMA flood zone
- X (unshaded)
- Chance of flooding over 30 yrs
- 0.0%
- Est. flood insurance / yr
- $507 – $1,088
Fire risk 2/10 · Minimal
- Est. fire insurance / yr
- $906 – $1,684
Heat risk 5/10 · Moderate
- Hot days now (above 104°F)
- 7 days/yr
- Hot days in 30 yrs
- 18 days/yr
Wind risk 4/10 · Minor
- Chance of severe wind over 30 yrs
- 18.0%
Air-quality risk 2/10 · Minimal
- Unhealthy air days now
- 1 days/yr
- Unhealthy air days in 30 yrs
- 2 days/yr
Risk factors via First Street. Map © Google.
Why this score? — see what drove the D+ grade
The composite is a weighted blend of 9 inputs, each scored 0–100. Each bar is that input's sub-score; the figure is the points it added to the 100-point composite (weight × sub-score).
- Cash flow +15.3/30.0
- ARV discount +15.0/15.0
- DSCR +4.7/10.0
- 1% rule +3.1/10.0
- Schools +3.0/10.0
- Livability +2.9/5.0
- Rent growth +2.5/5.0
- Condition / age +2.5/5.0
- Appreciation +0.0/10.0
$210,000
🖨 Deal sheet (PDF) 📄 Offer letter ✓ Due diligence
Listing remarks MLS
2 Bedroom 2 Bath House With Hardwood Floors And Western Schools, There Is An Upstairs Not Added Into Heated Sq Footage And A Small Basement Unfinished.
Key facts
- Black range
- Marble-look counters
- White cabinets
Tags
Property features AI
Finance
- Other: Located on a privately maintained road; Directions: Hwy 87 N to Ossipee, left on Lucas St.
- HOA & community: No homeowners association
Exterior
- Parking: Detached carport; Carport; Driveway; Gravel parking; 1 garage/carport space
- Utilities: Well water; Septic tank; Electric power
- Home design: Residential stick/site-built house; One level; Built in 1935; Existing structure
- Construction: Vinyl siding; Crawl space foundation; No fireplaces
- Exterior features: Remarks
Interior
- Kitchen: Dishwasher; Free-standing range
- Bedrooms: 5 total rooms (includes bedrooms and living spaces)
- Flooring: Wood floors
- Bathrooms: 2 full bathrooms
- Heating & cooling: Forced air electric heating; Central air conditioning; Electric water heater
- Interior features: Primary bedroom on the main level; Built-in features; See remarks
- Laundry & utility: Washer hookup; Dryer connection; Main level laundry
Neighborhood map
What this means for you Summary
Snapshot
- This is a 3-bed/1.0-bath single-family listed at $210k.
Deal economics
- At list price, monthly cash flow is $79 ($943/yr) — positive.
- The deal already cash-flows at list — no discount required.
- To meet the 1% rule (rent ≥ 1% of price), the offer needs to be $170k (19.3% below list).
- Recommended offer: $170k (19.3% below list) — sets the bar for 1% rule.
Location & tenants
- Location reads 57/100 on livability (#598 in NC) — a working-class tenant base; expect higher turnover. Strengths: cost of living A+, housing B+; Watch: health & safety C-, schools F, crime F.
- Alamance-Burlington Schools (rural): math 30% / reading 40% proficiency, ranked #133 of 178 in NC (top 75%) — families likely to look elsewhere, expect single-tenant / working-renter base with shorter leases.
- Market conditions: 108 active listings in the ZIP; solid renter incomes; 2,466 units permitted in Alamance County in 2024 (403 in 5+ unit buildings).
Forward outlook
- Local home prices are declining (-3.0%/yr); year-one equity from $1k of loan paydown is wiped out by about $6k of value loss. Plan a longer hold.
- Alamance County population projected at +19% by 2050 — long-run rental-demand tailwind backs the buy-and-hold thesis.
Negotiation context
- It's been on market 21 days — a 2% lower offer ($207k) is reasonable based on typical stale-listing flexibility.
- 8 sale attempts since 23y ago with the ask held roughly flat each time — persistent listings suggest the price (not the market) is what's stuck; bring a comps-based counter.
- Current owner paid $90k; list at $210k implies a 133% gain — meaningful room to come down on a strong offer.
Risks & watch-outs
- Watch-outs: built in 1935 — expect roof / HVAC / electrical / plumbing capex.
- Climate carrying-cost: extreme-heat days projected 7→18/yr by 2055 (HVAC capex compounding) — expect insurance premiums to compound above CPI over the hold.
Questions for the listing agent
- Built in 1935 — when were the roof, HVAC, electrical panel, plumbing, and water heater last replaced?
- Is there a deadline driving the sale (1031 exchange, divorce, estate, relocation)? That informs how much negotiation room exists.
- Schools are F-rated, which usually means shorter tenancies and higher turnover. Who's the typical renter profile here, and what's been the actual vacancy rate?
- Crime grade is F in this area — have there been break-ins, vandalism, or insurance claims at this property in the last 3 years? What carrier currently insures it and at what premium?
- The area grade is low — what's the realistic commute time and amenity access for the typical tenant pool here? Any planned neighborhood developments (good or bad) we should know about?
- What's the average days-on-market for RENTAL listings here right now (not sales)? A rising rental-DOM trend means longer vacancies and softer asking-rent achievability than the comps imply.
- What's the recent tenant-quality profile in this submarket — average credit score on applications, eviction rate, late-payment / NSF rate, and stable-employment percentage? A property-management company in the area should have these aggregated.
- How much new for-sale + rental construction is in the pipeline within 1–3 miles? Heavy new supply typically softens prices + rents 12–24 months out; constrained supply supports both.
Investment metrics
- 1% rule
- 0.81% ✗
- Cap rate
- 6.74%
- Cash-on-cash
- 1.60%
- DSCR
- 1.07
- GRM
- 10.3
CMA / ARV
- ARV (on-the-fly)
- $359,970
- Comps found
- 9
Show comp detail 9 sales within ~0.75 mi
| Address | Dist | Beds/Ba | Sqft | Sold | Price | $/sf | Match |
|---|---|---|---|---|---|---|---|
| 2816 Ricolden Trl | 0.46mi | 3/2.5 | 1,626 (-4%) | 3mo | $343,999 | $212 | 64 |
| 2812 Ricolden Trl | 0.46mi | 3/2.5 | 1,599 (-5%) | 2mo | $339,999 | $213 | 62 |
| 2803 Ricolden Trl | 0.43mi | 3/2.5 | 1,599 (-5%) | 9mo | $339,999 | $213 | 58 |
| 2824 Ricolden Trl | 0.47mi | 3/2.0 | 1,536 (-9%) | 4mo | $332,999 | $217 | 56 |
| 2808 Ricolden Trl | 0.46mi | 3/2.0 | 1,536 (-9%) | 5mo | $325,000 | $212 | 56 |
| 2820 Ricolden Trl | 0.47mi | 3/2.0 | 1,572 (-7%) | 10mo | $336,999 | $214 | 54 |
| 2120 Northcrest Dr | 0.62mi | 3/2.0 | 1,627 (-4%) | 10mo | $292,000 | $179 | 53 |
| 2828 Ricolden Trl | 0.48mi | 3/2.0 | 1,494 (-12%) | 3mo | $328,999 | $220 | 52 |
| 2119 Northcrest Dr | 0.62mi | 3/2.0 | 1,840 (+9%) | 8mo | $305,000 | $166 | 46 |
Match score weights: distance 35% · size 25% · config 20% · recency 20%. Top-matched comps best support the ARV.
Projected returns pro-forma
-3.0% appreciation · 3.0% rent growth · sell at horizon
- IRR
- -13.8%
- Equity multiple
- 0.50×
- Total profit
- $-29,116
- Equity at exit
- $31,312
- IRR
- -5.0%
- Equity multiple
- 0.67×
- Total profit
- $-19,281
- Equity at exit
- $18,157
Cash invested: $58,800 (down + closing). Projections, not guarantees.
Landlord ↔ Tenant lean methodology
- Overall (STATE)
- 85 Strongly Landlord-Friendly
- State North Carolina
- 85 Strongly Landlord-Friendly · R+3
- County
- — inherits STATE
- City
- — inherits STATE
ZIP-level market 27244
- Home prices YoY
- -21.0%
- Active inventory
- 108
- Price-to-rent
- 10.3×
Monthly cashflow live
- Estimated rent
- $1,695 medium interval (Pro) →
- Mortgage (P&I)
- −$1,101
- Tax from tax record
- −$72 /mo · $860/yr
- Insurance
- −$88
- HOA
- −$0
- Vacancy / Maint / Mgmt
- −$356
- Net cashflow
- $79
Break-even live
Sensitivity live
| Price | -10% $197 | -5% $138 | +0% $79 | +5% $19 | +10% $-40 |
|---|---|---|---|---|---|
| Rent | -10% $-55 | -5% $12 | +0% $79 | +5% $146 | +10% $212 |
| Rate | -1.0pp $184 | -0.5pp $132 | base $79 | +0.5pp $24 | +1.0pp $-31 |
UW: 25.0% down · 7.5% · 30yr · 1.5% tax · 5.0% vac · 8.0% maint · 8.0% mgmt
Financing live
Cash to close
- Down payment
- $52,500
- Closing costs
- $6,300
- Reserves months
- —
- Total cash needed
- —
Loan-product check · same deal, 3 products live
Conventional
25% down · 7.5% · 30yr
- Down + closing
- —
- Monthly P&I
- —
- Monthly cashflow
- —
- DSCR
- —
- Eligible?
- —
Personal DTI + credit; lowest rate.
DSCR
20% down · 8.5% · 30yr
- Down + closing
- —
- Monthly P&I
- —
- Monthly cashflow
- —
- DSCR
- —
- Eligible?
- —
No personal income docs; deal must DSCR.
Hard money
10% down · 12.0% · 12mo
- Down + closing
- —
- Monthly P&I
- —
- Monthly cashflow
- —
- DSCR
- —
- Eligible?
- —
Short-term bridge; refi at stabilization.
Listing history 18 events
-
2026-06-22days on market $210,000 Active 21 DOM
-
2026-06-19days on market $210,000 Active 19 DOM
-
2026-06-18days on market $210,000 Active 18 DOM
-
2026-06-17days on market $210,000 Active 17 DOM
-
2026-06-16days on market $210,000 Active 16 DOM
-
2026-06-15days on market $210,000 Active 15 DOM
-
2026-06-14days on market $210,000 Active 13 DOM
-
2026-06-13days on market $210,000 Active 12 DOM
-
2026-06-10days on market $210,000 Active 10 DOM
-
2026-06-09days on market $210,000 Active 9 DOM
-
2026-06-09days on market $210,000 Active 8 DOM
-
2026-06-08days on market $210,000 Active 9 DOM
-
2026-06-07days on market $210,000 Active 8 DOM
-
2026-06-05days on market $210,000 Active 5 DOM
-
2026-06-02days on market $210,000 Active 3 DOM
-
2026-06-01days on market $210,000 Active 2 DOM
-
2026-05-30remarks 653-char remark
-
2026-05-30$210,000 Active 1 DOM
ⓘ Source: listings_history table (triggers on properties + properties_extension) + one-shot
backfill from property_details.listing_events for pre-trigger history.
Tax reassessment forecast NC · Resets to sale price
- Current annual tax
- $860 · $72/mo
- Projected year-2 tax
- $1,722 · $144/mo
- Expected delta
- +$862/yr (+$72/mo · 100.1%)
ⓘ Screening estimate from a state-policy table — verify with the county assessor before closing.
Climate risk First Street
- Flood 1/10 Low FEMA zone X (unshaded) · 0% chance over 30 yrs
- Wildfire 2/10 Low
- Heat 5/10 Major 7 d/yr ≥104°F today · 18 d/yr by 30 yrs out
- Wind 4/10 Moderate 18% chance of damaging wind over 30 yrs
- Air quality 2/10 Low 1 unhealthy d/yr today · 2 by 30 yrs out
Nearby sold comps map
Loading sold comps map…
Walkable amenities ~0.75 mi
Loading nearby amenities…
Taxation est. · year 1
- Rental income
- $20,340
- − Mortgage interest
- −$11,763
- − Property taxes
- −$860
- − Insurance
- −$1,050
- − Repairs & maintenance
- −$1,627
- − Management
- −$1,627
- − Depreciation
- −$6,109
- Taxable loss
- −$2,697
- Est. tax savings @ 24.0%
- +$647
- After-tax cash flow
- $1,590/yr
For passive investors: Depreciation is non-cash, so a rental often shows a tax loss while cash-flowing — sheltering income. Rental losses are passive: they offset passive income freely, and up to $25,000/yr can offset ordinary (W-2) income if you actively participate and your MAGI is under $100k (phasing out to $0 by $150k); unused losses carry forward. On sale, claimed depreciation is recaptured at up to 25%, and gains may owe capital-gains tax (a 1031 exchange can defer both). Figures are a year-1 estimate at your 24.0% rate — not tax advice; consult a CPA.
Schools (NCES district)
- District
- Alamance-Burlington Schools
- NCES district ID
- 3700030
- Math proficiency
- 30% ▼ -6.00%
- Reading proficiency
- 40% ▲ 2.00%
- Median HH income
- $43,359
- Composite
- 29.68/100
- National rank
- #6460
- State rank
- #133 of 178 in NC
Livability — Ossipee
- Score
- 57/100
- State rank
- #598
- US rank
- #21764
Category grades
Schools grade is shown separately in the Schools card above.
Census & demographics
- Census place
- Ossipee, NC
- County
- Alamance County · 173,369 people
- Metro
- Burlington, NC
- Population (ZIP)
- 16,329
- Household income
- $75,323
- Rent vs Own
- Severe rent burden
- 270.0
Population outlook (Alamance County) Hauer SSP2
- Today (2025)
- 173,381 people
- By 2030
- 180,609 · +4.2%
- By 2040
- 194,327 · +12.1%
- By 2050
- 206,158 · +18.9%
- By 2075
- 235,665 · +35.9%
- By 2100
- 258,626 · +49.2%
Race, ethnicity, and origin ACS 2023
- Neighborhood character
- Predominantly White (81%)
- Race & ethnicity
- White 81% Black 11% Two or more races 4% Hispanic / Latino 3% Asian 2%
- Common ancestry
- Serbian 4% Romanian 3% Slovak 3%
- Foreign-born
- 3%
- Languages at home
- 95% English-only · Spanish 2% Other Indo-European 2% Other Asian/Pacific 1%
Political lean MEDSL · Alamance
- 2024 margin
- Lean R (+8.2) · D 45.4% · R 53.5% · Other 1.1%
- 2008→2024 swing
- +1.1pp toward D · 2008: -9.2pp · 2024: -8.2pp
- All cycles
- 2024: R+8.2 2020: R+8.4 2016: R+12.9 2012: R+14.1 2008: R+9.2
Not yet ingested
- Civics
- —
Market trends
- HPI YoY
- ▼ -58.54%
- Current HPI
- 219.7859
- Rent YoY
- —
- Metro
- Burlington, NC
- State GDP YoY
- ▲ 3.28%
- F500 in state
- 26
Industry mix (Fortune 500 HQ in NC)
| Industry | F500 HQs | Revenue |
|---|---|---|
| Financial Services | 2 | $213B |
|
||
| Retail | 2 | $95B |
|
||
| Industrial Conglomerate | 1 | $38B |
|
||
| Metals / Steel | 1 | $35B |
|
||
| Utilities | 1 | $30B |
|
||
| Industrial Machinery | 1 | $19B |
|
||
Price history
+469.1% since first listed17 events — show timeline
- 2026-05-30 Listed $210,000 Triad MLS
- 2025-12-12 Sold (Public Records) $90,000 Public Records
- 2019-08-20 Sold (Public Records) $73,000 Public Records
- 2019-08-19 Sold (MLS) $73,000 TMLS
- 2019-08-19 Sold (MLS) $73,000 AMLSNC
- 2019-07-04 Listed $75,000 TMLS
- 2019-07-04 Listed $75,000 AMLSNC
- 2012-07-25 Sold (MLS) $30,000 Triad MLS
- 2012-06-11 Listed $30,000 Triad MLS
- 2012-04-10 Listing Removed — TMLS
- 2011-05-28 Listed $43,900 TMLS
- 2003-12-23 Sold (MLS) $22,500 TMLS
- 2003-12-23 Sold (MLS) $22,500 AMLSNC
- 2003-09-02 Listed $24,900 TMLS
- 2003-09-02 Listed $24,900 AMLSNC
- 2003-08-15 Listing Removed — TMLS
- 2003-02-26 Listed $36,900 TMLS
Property tax history
+8.1%/yrLatest (2025): $860 · +6.9% YoY. Source: county tax records.
Cash-flow waterfall
monthlySold comps — $/sqft
last 12 mo · ≤1 miLoading sold comps…