 Triplex
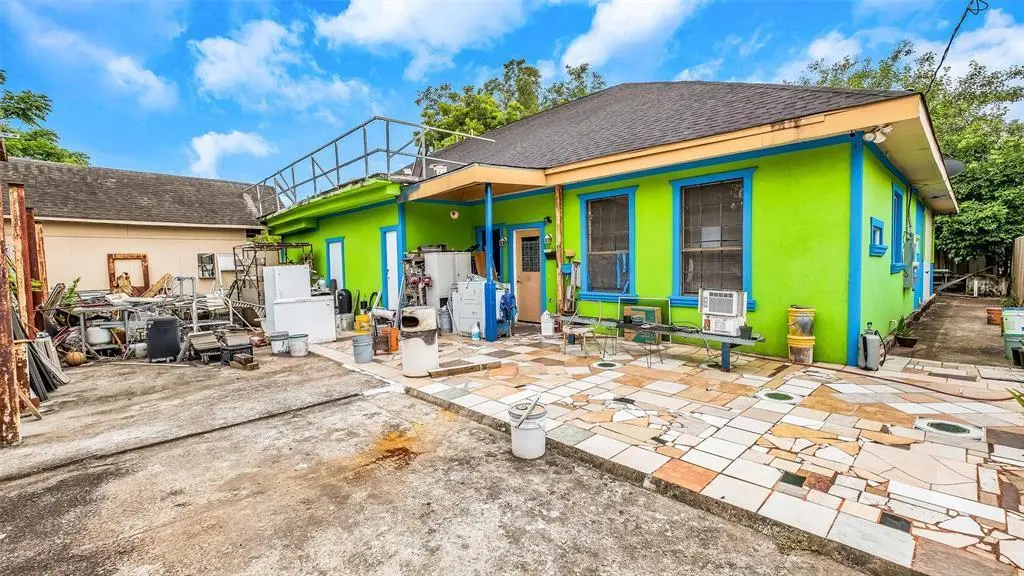
3316 Love Plz · Houston, TX
Flood risk 3/10 · Minor
- FEMA flood zone
- X (shaded)
- Chance of flooding over 30 yrs
- 0.2%
- Est. flood insurance / yr
- $507 – $1,088
Fire risk 1/10 · Minimal
- Est. fire insurance / yr
- $1,222 – $2,270
Heat risk 9/10 · Severe
- Hot days now (above 109°F)
- 7 days/yr
- Hot days in 30 yrs
- 23 days/yr
Wind risk 9/10 · Severe
- Chance of severe wind over 30 yrs
- 99.0%
Air-quality risk 3/10 · Minor
- Unhealthy air days now
- 2 days/yr
- Unhealthy air days in 30 yrs
- 3 days/yr
Risk factors via First Street. Map © Google.
Why this score? — see what drove the B+ grade
The composite is a weighted blend of 9 inputs, each scored 0–100. Each bar is that input's sub-score; the figure is the points it added to the 100-point composite (weight × sub-score).
- Cash flow +30.0/30.0
- 1% rule +10.0/10.0
- DSCR +10.0/10.0
- ARV discount +7.5/15.0
- Appreciation +6.9/10.0
- Livability +3.7/5.0
- Rent growth +3.3/5.0
- Schools +2.7/10.0
- Condition / age +2.5/5.0
$135,000
🖨 Deal sheet 📄 Offer letter ✓ Due diligence
Multi-family units
County records classify this as Multi-Family (2-4 Unit). Listing-text estimate: 3 units. confirmed
Listing remarks MLS
INVESTOR OPPORTUNITY!!! THIS PROPERTY HAS 3 WELL MAINTAINED UNITS. Units range from 3 bedroom - 2 bedrooms/ baths, kitchen, living area, appliances. Easy access to Hwy 59N, minutes from Downtown. 2 of the 3 units are vacant and move in ready. CALL FOR MORE INFORMATION!
Key facts
- Move in ready
- 7,296 sq ft lot
- Built 2005
Tags
Property features AI
Finance
- Financial info: Multi-unit property with 3 total units; Building area approximately 3,828
Exterior
- Utilities: Cable available; Electricity available; Natural gas available; Water available
- Home design: Residential income property; Built in 2005
- Construction: Built in 2005; Composition roof
- Exterior features: Composition roof; Lot approximately 7,296 square feet
Interior
- Heating & cooling: Central heating (electric); Central air conditioning (electric)
- Interior features: Microwave; Refrigerator
Neighborhood map
What this means for you Summary
Snapshot
- This is a 1×3bd/1.5ba + 2×2bd/1.5ba units multifamily listed at $135k.
Deal economics
- At list price, monthly cash flow is $3k ($39k/yr) — positive. Per door: $1k/mo.
- The deal already cash-flows at list — no discount required.
- Meets the 1% rule at list price ($5k rent vs $135k).
- Cap rate 35.0% vs local median 3.2% in Houston — top-decile yield for the area; either an underpriced asset or a hidden risk that comps aren't pricing in. Stress-test before assuming the spread holds.
Location & tenants
- Location reads 74/100 on livability (#184 in TX, #4,771 nationally) — a middle-class / working-renter tenant base. Strengths: amenities A+, cost of living A+, housing A+; Watch: crime F.
- Houston ISD (urban): math 27% / reading 35% proficiency, ranked #593 of 826 in TX (top 72%) — families likely to look elsewhere, expect single-tenant / working-renter base with shorter leases; 71% free/reduced lunch — lower-income household profile, screen leases tightly.
- Zoned schools: Fleming Middle (math 10% / reading 15%, grade F, #1,616 of 1,662 statewide, top 97%, 384 students, 97% FRL); Wheatley H S (math 17% / reading 19%, grade F, #1,445 of 1,632 statewide, top 89%, 643 students, 95% FRL) — zoned schools average 96% FRL vs 71% district-wide (25 pts higher); higher-poverty schools than district average — tighter screening recommended.
- Zoned-school proficiency averages 15% at this address vs 31% district-wide (-16 pts) — the specific schools serving this property underperform the Houston ISD average; the district grade overstates school quality for this exact location.
- Market conditions: Rents rising (+3.1%/yr); 445 active listings in the ZIP; lower-income renter base — watch delinquency; 29,883 units permitted in Harris County in 2024 (8,621 in 5+ unit buildings).
- At $5,264/mo this rent would consume 161% of the median local household income ($39k/yr) (locally 1531% of renters already pay >50% of income on rent) — very limited rent-growth headroom before tenants either downsize or default.
Forward outlook
- In year one you build about $6k of equity ($933 loan paydown + $5k appreciation (3.9% local appreciation)).
- Harris County population projected at +47% by 2050 — long-run rental-demand tailwind backs the buy-and-hold thesis.
- At projected returns (3.9% appreciation + 3.1% rent growth), your $38k cash investment doubles in ~1 year — after that, you're playing with house money.
- By year 6, paydown + projected appreciation supports a ~$33k cash-out refi (75% LTV) — recoverable capital for the next deal without selling this one.
Negotiation context
- Only 10 days on market — expect competitive offers; lowballing is unlikely to land.
- 8 sale attempts since 9y ago with the ask held roughly flat each time — persistent listings suggest the price (not the market) is what's stuck; bring a comps-based counter.
Risks & watch-outs
- Climate carrying-cost: severe wind risk, 99% chance of damaging wind over 30y; extreme-heat days projected 7→23/yr by 2055 (HVAC capex compounding) — expect insurance premiums to compound above CPI over the hold.
Questions for the listing agent
- Can we see the unit-by-unit rent roll, current vacancy, and any below-market leases? What's the average tenancy length?
- What capital expenditures (roof, boiler, parking lot, exteriors) have been made in the last 5 years, and what's planned in the next 2?
- Is there a deadline driving the sale (1031 exchange, divorce, estate, relocation)? That informs how much negotiation room exists.
- Schools are D-rated, which usually means shorter tenancies and higher turnover. Who's the typical renter profile here, and what's been the actual vacancy rate?
- Crime grade is F in this area — have there been break-ins, vandalism, or insurance claims at this property in the last 3 years? What carrier currently insures it and at what premium?
- What's the average days-on-market for RENTAL listings here right now (not sales)? A rising rental-DOM trend means longer vacancies and softer asking-rent achievability than the comps imply.
- What's the recent tenant-quality profile in this submarket — average credit score on applications, eviction rate, late-payment / NSF rate, and stable-employment percentage? A property-management company in the area should have these aggregated.
- How much new apartment / multifamily construction is in the pipeline within 1–3 miles? Heavy new supply (>2% of stock underway) typically softens rents 12–24 months out; light construction supports rent growth.
Investment metrics
- 1% rule
- 3.90% ✓
- Cap rate
- 34.96%
- Cash-on-cash
- 102.40%
- DSCR
- 5.56
- GRM
- 2.1
CMA / ARV
No comps found within radius.
Projected returns pro-forma
3.89% appreciation · 3.08% rent growth · sell at horizon
- IRR
- —
- Equity multiple
- 7.05×
- Total profit
- $228,693
- Equity at exit
- $67,602
- IRR
- —
- Equity multiple
- 14.74×
- Total profit
- $519,221
- Equity at exit
- $109,901
Cash invested: $37,800 (down + closing). Projections, not guarantees.
Landlord ↔ Tenant lean methodology
- Overall (STATE)
- 87 Strongly Landlord-Friendly
- State Texas
- 87 Strongly Landlord-Friendly · R+5
- County
- — inherits STATE
- City
- — inherits STATE
ZIP-level market 77026
- Home prices YoY
- 1.5%
- Rents YoY
- 3.1%
- Active inventory
- 445
- Price-to-rent
- 6.6×
Monthly cashflow live
- Estimated rent
- $5,264 high interval (Pro) →
- Mortgage (P&I)
- −$708
- Tax est. 1.5%
- −$169 /mo · $2,025/yr
- Insurance
- −$56
- HOA
- −$0
- Vacancy / Maint / Mgmt
- −$1,105
- Net cashflow
- $3,226
Break-even live
3-unit breakdown (identical units grouped — click to expand)
| Units | Beds | Baths | Est. rent |
|---|---|---|---|
| 1× unit | 3 | 1.5 | $1,693 |
| 2× units | 2 | 1.5 | $3,572 |
| #2 | 2 | 1.5 | $1,786 |
| #3 | 2 | 1.5 | $1,786 |
| Total (3 units) | $5,264 | ||
UW: 25.0% down · 7.5% · 30yr · 1.5% tax · 5.0% vac · 8.0% maint · 8.0% mgmt
Financing live
Cash to close
- Down payment
- $33,750
- Closing costs
- $4,050
- Reserves months
- —
- Total cash needed
- —
Loan-product check · same deal, 3 products live
Conventional
25% down · 7.5% · 30yr
- Down + closing
- —
- Monthly P&I
- —
- Monthly cashflow
- —
- DSCR
- —
- Eligible?
- —
Personal DTI + credit; lowest rate.
DSCR
20% down · 8.5% · 30yr
- Down + closing
- —
- Monthly P&I
- —
- Monthly cashflow
- —
- DSCR
- —
- Eligible?
- —
No personal income docs; deal must DSCR.
Hard money
10% down · 12.0% · 12mo
- Down + closing
- —
- Monthly P&I
- —
- Monthly cashflow
- —
- DSCR
- —
- Eligible?
- —
Short-term bridge; refi at stabilization.
Listing history 7 events
-
2026-06-18days on market $135,000 Active 10 DOM
-
2026-06-17days on market $135,000 Active 9 DOM
-
2026-06-16days on market $135,000 Active 8 DOM
-
2026-06-15days on market $135,000 Active 7 DOM
-
2026-06-13days on market $135,000 Active 5 DOM
-
2026-06-08remarks 332-char remark
-
2026-06-08$135,000 Active 1 DOM
ⓘ Source: listings_history table (triggers on properties + properties_extension) + one-shot
backfill from property_details.listing_events for pre-trigger history.
Climate risk First Street
- Flood 3/10 Moderate FEMA zone X (shaded) · 20% chance over 30 yrs
- Wildfire 1/10 Low
- Heat 9/10 Extreme 7 d/yr ≥109°F today · 23 d/yr by 30 yrs out
- Wind 9/10 Extreme 99% chance of damaging wind over 30 yrs
- Air quality 3/10 Moderate 2 unhealthy d/yr today · 3 by 30 yrs out
Nearby sold comps map
Loading sold comps map…
Walkable amenities ~0.75 mi
Loading nearby amenities…
Taxation est. · year 1
- Rental income
- $63,168
- − Mortgage interest
- −$7,562
- − Property taxes
- −$2,025
- − Insurance
- −$675
- − Repairs & maintenance
- −$5,053
- − Management
- −$5,053
- − Depreciation
- −$3,927
- Taxable income
- $38,872
- Est. tax owed @ 24.0%
- −$9,329
- After-tax cash flow
- $29,378/yr
For passive investors: Depreciation is non-cash, so a rental often shows a tax loss while cash-flowing — sheltering income. Rental losses are passive: they offset passive income freely, and up to $25,000/yr can offset ordinary (W-2) income if you actively participate and your MAGI is under $100k (phasing out to $0 by $150k); unused losses carry forward. On sale, claimed depreciation is recaptured at up to 25%, and gains may owe capital-gains tax (a 1031 exchange can defer both). Figures are a year-1 estimate at your 24.0% rate — not tax advice; consult a CPA.
Schools (NCES district)
- District
- Houston ISD
- NCES district ID
- 4823640
- Math proficiency
- 27% ▼ -18.00%
- Reading proficiency
- 35% ▼ -6.00%
- Median HH income
- $46,054
- Composite
- 26.63/100
- National rank
- #7173
- State rank
- #593 of 826 in TX
Livability — Houston
- Score
- 74/100
- State rank
- #184
- US rank
- #4771
Category grades
Schools grade is shown separately in the Schools card above.
Census & demographics
- Census place
- Houston, TX
- County
- Harris County · 4,702,590 people
- City population
- 3,226,434
- Metro
- Houston-The Woodlands-Sugar Land, TX
- Population (ZIP)
- 21,981
- Household income
- $39,211
- Rent vs Own
- Severe rent burden
- 1531.0
Population outlook (Harris County) Hauer SSP2
- Today (2025)
- 5,571,493 people
- By 2030
- 6,089,821 · +9.3%
- By 2040
- 7,142,806 · +28.2%
- By 2050
- 8,185,864 · +46.9%
- By 2075
- 10,574,329 · +89.8%
- By 2100
- 12,109,958 · +117.4%
Race, ethnicity, and origin ACS 2023
- Neighborhood character
- Diverse neighborhood (Simpson 0.56)
- Race & ethnicity
- Black 49% Hispanic / Latino 44% Two or more races 18% White 5% Native American 1%
- Hispanic origin (detail)
- Mexican 34%
- Common ancestry
- Lithuanian 1%
- Foreign-born
- 15% · Canada
- Languages at home
- 61% English-only · Spanish 39%
Political lean MEDSL · Harris
- 2024 margin
- Lean D (+5.5) · D 52.0% · R 46.4% · Other 1.6%
- 2008→2024 swing
- +3.9pp toward D · 2008: 1.6pp · 2024: 5.5pp
- All cycles
- 2024: D+5.5 2020: D+13.3 2016: D+12.4 2012: D+0.1 2008: D+1.6
Not yet ingested
- Civics
- —
Market trends
- HPI YoY
- ▲ 3.89%
- Current HPI
- 267.5995
- Rent YoY
- ▲ 3.08%
- Metro
- Houston-The Woodlands-Sugar Land, TX
- State GDP YoY
- ▲ 3.95%
- F500 in state
- 110
Industry mix (Fortune 500 HQ in TX)
| Industry | F500 HQs | Revenue |
|---|---|---|
| Energy | 16 | $1,198B |
|
||
| Technology | 5 | $198B |
|
||
| Engineering / Construction | 4 | $72B |
|
||
| Energy Services | 3 | $60B |
|
||
| Utilities | 3 | $41B |
|
||
| Healthcare | 2 | $330B |
|
||
Price history
-53.3% since first listed23 events — show timeline
- 2026-06-08 Listed $135,000 HARMLS
- 2026-02-15 Rental Removed — HARMLS
- 2025-09-30 Listing Removed — HARMLS
- 2025-08-01 Price Changed $375,000 HARMLS
- 2025-07-10 Price Changed $400,000 HARMLS
- 2025-07-08 Listed for Rent — HARMLS
- 2025-06-19 Listed $439,000 HARMLS
- 2020-07-21 Sold (Public Records) — Public Records
- 2020-07-16 Sold (MLS) — HARMLS
- 2020-05-11 Pending — HARMLS
- 2020-05-07 Listed $250,000 HARMLS
- 2020-01-05 Pending — HARMLS
- 2019-12-23 Pending — HARMLS
- 2019-12-23 Listing Removed — HARMLS
- 2019-07-30 Listed $250,000 HARMLS
- 2019-06-25 Listing Removed — HARMLS
- 2019-04-25 Price Changed $270,000 HARMLS
- 2019-02-20 Listed $285,000 HARMLS
- 2018-12-20 Listing Removed — HARMLS
- 2018-06-21 Listed $289,900 HARMLS
- 2018-02-11 Listing Removed — HARMLS
- 2017-08-19 Listed $289,000 HARMLS
- 2000-11-16 Sold (Public Records) — Public Records
Property tax history
+7.7%/yrLatest (2025): $8,557 · +8.2% YoY. Source: county tax records.
Cash-flow waterfall
monthlySold comps — $/sqft
last 12 mo · ≤1 miLoading sold comps…