 Duplex
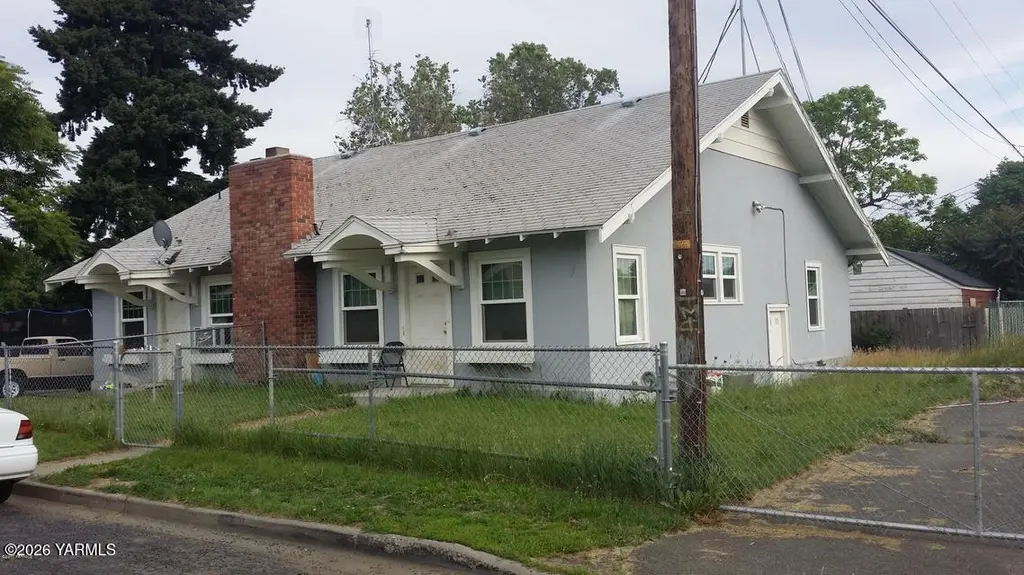
302 W Prasch Ave Unit A & B · Yakima, WA
Flood risk 1/10 · Minimal
- FEMA flood zone
- X (unshaded)
- Chance of flooding over 30 yrs
- 0.0%
- Est. flood insurance / yr
- $473 – $860
Fire risk 1/10 · Minimal
- Est. fire insurance / yr
- $604 – $1,122
Heat risk 4/10 · Minor
- Hot days now (above 98°F)
- 7 days/yr
- Hot days in 30 yrs
- 14 days/yr
Wind risk 1/10 · Minimal
- Chance of severe wind over 30 yrs
- —
Air-quality risk 9/10 · Severe
- Unhealthy air days now
- 16 days/yr
- Unhealthy air days in 30 yrs
- 19 days/yr
Risk factors via First Street. Map © Google.
Why this score? — see what drove the C grade
The composite is a weighted blend of 9 inputs, each scored 0–100. Each bar is that input's sub-score; the figure is the points it added to the 100-point composite (weight × sub-score).
- Cash flow +16.9/30.0
- ARV discount +15.0/15.0
- DSCR +5.3/10.0
- 1% rule +4.6/10.0
- Livability +4.0/5.0
- Rent growth +3.8/5.0
- Schools +3.4/10.0
- Condition / age +2.2/5.0
- Appreciation +0.0/10.0
$325,000
🖨 Deal sheet 📄 Offer letter ✓ Due diligence
Multi-family units
County records classify this as Multi-Family (2-4 Unit). Listing-text estimate: 2 units. confirmed
Listing remarks
Great investment opportunity with endless potential! Live in one unit and rent out the second for passive income or add this duplex to your investment portfolio. Conveniently located close to schools and transportation, this stucco duplex offers great flexibility and value. Unit 1: 2 bedrooms, 1 bathroom Unit 2: 3 bedrooms, 2 bathrooms. Don't miss this opportunity -- this property won't last long!
Key facts
- Stucco duplex
- Conveniently located
- 8,712 sq ft lot
Tags
Property features AI
Exterior
- Utilities: Public water; Sewer connected
- Home design: Residential income property; Duplex; Zoned R2 (two-family residential)
- Construction: Stucco and frame construction
- Exterior features: Composition roof
Interior
- Heating & cooling: Electric heating; Forced air heating; Natural gas heating
- Interior features: Has heating
Neighborhood map
What this means for you Summary
Snapshot
- This is a 1×2.0bd/1.0ba + 1×3.0bd/2.0ba units multifamily listed at $325k. Condition is rated fair.
Deal economics
- At list price, monthly cash flow is $213 ($3k/yr) — positive. Per door: $107/mo.
- The deal already cash-flows at list — no discount required.
- To meet the 1% rule (rent ≥ 1% of price), the offer needs to be $311k (4.2% below list).
- Recommended offer: $311k (4.2% below list) — sets the bar for 1% rule.
- Cap rate 7.1% vs local median 3.4% in Yakima — top-decile yield for the area; either an underpriced asset or a hidden risk that comps aren't pricing in. Stress-test before assuming the spread holds.
Location & tenants
- Location reads 80/100 on livability (#98 in WA, #1,912 nationally) — a professional / high-income tenant draw. Strengths: amenities A+, commute A+, housing A+; Watch: employment D, crime F.
- Yakima School District (urban): math 34% / reading 42% proficiency, ranked #238 of 291 in WA (top 82%) — families likely to look elsewhere, expect single-tenant / working-renter base with shorter leases; 76% free/reduced lunch — lower-income household profile, screen leases tightly.
- Market conditions: Rents rising fast (+5.1%/yr); 185 active listings in the ZIP; 468 units permitted in Yakima County in 2024 (23 in 5+ unit buildings).
- At $3,113/mo this rent would consume 59% of the median local household income ($63k/yr) (locally 1607% of renters already pay >50% of income on rent) — very limited rent-growth headroom before tenants either downsize or default.
Forward outlook
- Local home prices are declining (-3.0%/yr); year-one equity from $2k of loan paydown is wiped out by about $10k of value loss. Plan a longer hold.
- Yakima County population projected at +6% by 2050 — modest demand growth; plan on rents tracking national, not racing it.
Negotiation context
- It's been on market 39 days — a 3% lower offer ($315k) is reasonable based on typical stale-listing flexibility.
Risks & watch-outs
- Watch-outs: built in 1920 — expect roof / HVAC / electrical / plumbing capex.
Questions for the listing agent
- It's been on market 39 days. Have you received any prior offers? Is the seller open to a 4% concession, seller financing, or rate buy-down credit?
- Can we see the unit-by-unit rent roll, current vacancy, and any below-market leases? What's the average tenancy length?
- What capital expenditures (roof, boiler, parking lot, exteriors) have been made in the last 5 years, and what's planned in the next 2?
- Have any recent inspections been done? Can we get a copy of the seller's disclosures and any deferred-maintenance estimates?
- Built in 1920 — when were the roof, HVAC, electrical panel, plumbing, and water heater last replaced?
- Is there a deadline driving the sale (1031 exchange, divorce, estate, relocation)? That informs how much negotiation room exists.
- Crime grade is F in this area — have there been break-ins, vandalism, or insurance claims at this property in the last 3 years? What carrier currently insures it and at what premium?
- What's the average days-on-market for RENTAL listings here right now (not sales)? A rising rental-DOM trend means longer vacancies and softer asking-rent achievability than the comps imply.
- What's the recent tenant-quality profile in this submarket — average credit score on applications, eviction rate, late-payment / NSF rate, and stable-employment percentage? A property-management company in the area should have these aggregated.
- How much new apartment / multifamily construction is in the pipeline within 1–3 miles? Heavy new supply (>2% of stock underway) typically softens rents 12–24 months out; light construction supports rent growth.
Investment metrics
- 1% rule
- 0.96% ✗
- Cap rate
- 7.08%
- Cash-on-cash
- 2.81%
- DSCR
- 1.13
- GRM
- 8.7
CMA / ARV
- ARV (median comp)
- $395,943
- List price
- $325,000
- Delta
- -17.92%
- Verdict
- UNDERPRICED
- Comps
- 6 within 1.0 mi
Projected returns pro-forma
-3.0% appreciation · 5.07% rent growth · sell at horizon
- IRR
- -9.5%
- Equity multiple
- 0.64×
- Total profit
- $-32,417
- Equity at exit
- $48,459
- IRR
- 2.5%
- Equity multiple
- 1.20×
- Total profit
- $17,782
- Equity at exit
- $28,100
Cash invested: $91,000 (down + closing). Projections, not guarantees.
Landlord ↔ Tenant lean methodology
- Overall (STATE)
- 28 Tenant-Leaning
- State Washington
- 28 Tenant-Leaning · D+8
- County
- — inherits STATE
- City
- — inherits STATE
ZIP-level market 98902
- Rents YoY
- 5.1%
- Active inventory
- 185
- Price-to-rent
- 17.8×
Monthly cashflow live
- Estimated rent
- $3,113 high interval (Pro) →
- Mortgage (P&I)
- −$1,704
- Tax est. 1.5%
- −$406 /mo · $4,875/yr
- Insurance
- −$135
- HOA
- −$0
- Vacancy / Maint / Mgmt
- −$654
- Net cashflow
- $213
Break-even live
2-unit breakdown (identical units grouped — click to expand)
| Units | Beds | Baths | Est. rent |
|---|---|---|---|
| 1× unit | 2.0 | 1 | $1,525 |
| 1× unit | 3.0 | 2 | $1,588 |
| Total (2 units) | $3,113 | ||
UW: 25.0% down · 7.5% · 30yr · 1.5% tax · 5.0% vac · 8.0% maint · 8.0% mgmt
Financing live
Cash to close
- Down payment
- $81,250
- Closing costs
- $9,750
- Reserves months
- —
- Total cash needed
- —
Loan-product check · same deal, 3 products live
Conventional
25% down · 7.5% · 30yr
- Down + closing
- —
- Monthly P&I
- —
- Monthly cashflow
- —
- DSCR
- —
- Eligible?
- —
Personal DTI + credit; lowest rate.
DSCR
20% down · 8.5% · 30yr
- Down + closing
- —
- Monthly P&I
- —
- Monthly cashflow
- —
- DSCR
- —
- Eligible?
- —
No personal income docs; deal must DSCR.
Hard money
10% down · 12.0% · 12mo
- Down + closing
- —
- Monthly P&I
- —
- Monthly cashflow
- —
- DSCR
- —
- Eligible?
- —
Short-term bridge; refi at stabilization.
Listing history 18 events
-
2026-06-19days on market $325,000 Active 39 DOM
-
2026-06-18days on market $325,000 Active 38 DOM
-
2026-06-17days on market $325,000 Active 37 DOM
-
2026-06-16days on market $325,000 Active 36 DOM
-
2026-06-15days on market $325,000 Active 35 DOM
-
2026-06-14days on market $325,000 Active 33 DOM
-
2026-06-13days on market $325,000 Active 32 DOM
-
2026-06-10days on market $325,000 Active 30 DOM
-
2026-06-09days on market $325,000 Active 29 DOM
-
2026-06-08days on market $325,000 Active 28 DOM
-
2026-06-07days on market $325,000 Active 27 DOM
-
2026-06-05days on market $325,000 Active 24 DOM
-
2026-06-03days on market $325,000 Active 23 DOM
-
2026-06-02days on market $325,000 Active 22 DOM
-
2026-06-01days on market $325,000 Active 21 DOM
-
2026-05-31days on market $325,000 Active 20 DOM
-
2026-05-30days on market $325,000 Active 19 DOM
-
2026-05-11$325,000 Active 400-char remark
ⓘ Source: listings_history table (triggers on properties + properties_extension) + one-shot
backfill from property_details.listing_events for pre-trigger history.
Climate risk First Street
- Flood 1/10 Low FEMA zone X (unshaded) · 0% chance over 30 yrs
- Wildfire 1/10 Low
- Heat 4/10 Moderate 7 d/yr ≥98°F today · 14 d/yr by 30 yrs out
- Wind 1/10 Low
- Air quality 9/10 Extreme 16 unhealthy d/yr today · 19 by 30 yrs out
Nearby sold comps map
Loading sold comps map…
Walkable amenities ~0.75 mi
Loading nearby amenities…
Taxation est. · year 1
- Rental income
- $37,356
- − Mortgage interest
- −$18,205
- − Property taxes
- −$4,875
- − Insurance
- −$1,625
- − Repairs & maintenance
- −$2,988
- − Management
- −$2,988
- − Depreciation
- −$9,455
- Taxable loss
- −$2,781
- Est. tax savings @ 24.0%
- +$667
- After-tax cash flow
- $3,227/yr
For passive investors: Depreciation is non-cash, so a rental often shows a tax loss while cash-flowing — sheltering income. Rental losses are passive: they offset passive income freely, and up to $25,000/yr can offset ordinary (W-2) income if you actively participate and your MAGI is under $100k (phasing out to $0 by $150k); unused losses carry forward. On sale, claimed depreciation is recaptured at up to 25%, and gains may owe capital-gains tax (a 1031 exchange can defer both). Figures are a year-1 estimate at your 24.0% rate — not tax advice; consult a CPA.
Condition & rehab AI · 1 photo
This duplex requires moderate renovations to improve its curb appeal and value. Exterior repairs and maintenance are needed to bring it up to a fair condition.
Repairs flagged
- Major exterior fencing — Needs replacement
- Major exterior siding — Needs repainting or replacement
- Major exterior landscaping — Overgrown and needs trimming
Value-add opportunities
- Both paint exterior — Enhances curb appeal and value
- Both trim grass — Improves curb appeal and value
- Both repair fencing — Fixes safety and enhances value
Renovation cost estimate screening
| Repair item | Severity | Est. cost |
|---|---|---|
| exterior fencing · Needs replacement | Major | $15,000–50,000 |
| exterior siding · Needs repainting or replacement | Major | $15,000–50,000 |
| exterior landscaping · Overgrown and needs trimming | Major | $15,000–50,000 |
| Total estimated repair cost · 3 items | $45,000–150,000 |
Value-add ROI direction
- Both paint exterior — Enhances curb appeal and value ↑
- Both trim grass — Improves curb appeal and value ↑
- Both repair fencing — Fixes safety and enhances value ↑
ⓘ Cost ranges are severity-bucket heuristics (US national rule-of-thumb). Get contractor quotes + a written scope before underwriting a rehab budget.
Schools (NCES district)
- District
- Yakima School District
- NCES district ID
- 5310110
- Math proficiency
- 34% ▼ -1.00%
- Reading proficiency
- 42% ▬ 0.00%
- Median HH income
- $36,538
- Composite
- 34.04/100
- National rank
- #10305
- State rank
- #238 of 291 in WA
Livability — Yakima
- Score
- 80/100
- State rank
- #98
- US rank
- #1912
Category grades
Schools grade is shown separately in the Schools card above.
Census & demographics
- Census place
- Yakima, WA
- County
- Yakima County · 134,789 people
- City population
- 115,918
- Metro
- Yakima, WA
- Population (ZIP)
- 46,492
- Household income
- $63,092
- Rent vs Own
- Severe rent burden
- 1607.0
Population outlook (Yakima County) Hauer SSP2
- Today (2025)
- 256,514 people
- By 2030
- 259,403 · +1.1%
- By 2040
- 265,677 · +3.6%
- By 2050
- 273,061 · +6.5%
- By 2075
- 296,991 · +15.8%
- By 2100
- 315,291 · +22.9%
Race, ethnicity, and origin ACS 2023
- Neighborhood character
- Diverse neighborhood (Simpson 0.59)
- Race & ethnicity
- Hispanic / Latino 50% White 40% Two or more races 24% Black 2% Pacific Islander 2% Native American 1% Asian 1%
- Hispanic origin (detail)
- Mexican 44%
- Common ancestry
- Lithuanian 2% Slovak 1% Italian 1%
- Foreign-born
- 20% · Canada
- Languages at home
- 60% English-only · Spanish 37% Other Asian/Pacific 1%
Political lean MEDSL · Yakima
- 2024 margin
- R (+14.3) · D 41.6% · R 55.9% · Other 2.5%
- 2008→2024 swing
- -3.8pp toward R · 2008: -10.6pp · 2024: -14.3pp
- All cycles
- 2024: R+14.3 2020: R+7.7 2016: R+15.4 2012: R+15.1 2008: R+10.6
Not yet ingested
- Civics
- —
Market trends
- HPI YoY
- ▼ -363.66%
- Current HPI
- 294.559
- Rent YoY
- ▲ 5.07%
- Metro
- Yakima, WA
- State GDP YoY
- ▲ 4.65%
- F500 in state
- 22
Industry mix (Fortune 500 HQ in WA)
| Industry | F500 HQs | Revenue |
|---|---|---|
| Retail | 2 | $269B |
|
||
| Technology / Retail | 1 | $638B |
|
||
| Technology | 1 | $245B |
|
||
| Telecommunications | 1 | $38B |
|
||
| Food / Beverage | 1 | $36B |
|
||
| Automotive / Trucks | 1 | $34B |
|
||
Price history
1 event — show timeline
- 2026-05-11 Listed $325,000 YAMLS
Cash-flow waterfall
monthlySold comps — $/sqft
last 12 mo · ≤1 miLoading sold comps…