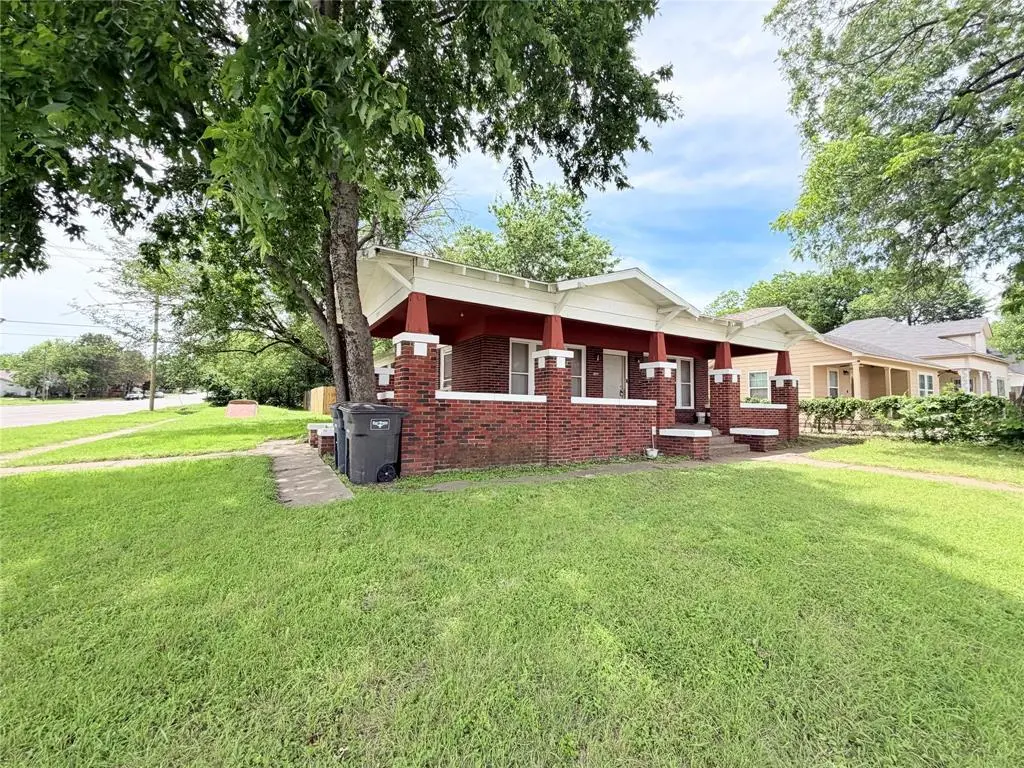
900 W Central Ave · Fort Worth, TX
Flood risk 1/10 · Minimal
- FEMA flood zone
- X (unshaded)
- Chance of flooding over 30 yrs
- 0.0%
- Est. flood insurance / yr
- $507 – $1,088
Fire risk 1/10 · Minimal
- Est. fire insurance / yr
- $1,222 – $2,270
Heat risk 7/10 · Major
- Hot days now (above 109°F)
- 7 days/yr
- Hot days in 30 yrs
- 23 days/yr
Wind risk 4/10 · Minor
- Chance of severe wind over 30 yrs
- 24.0%
Air-quality risk 3/10 · Minor
- Unhealthy air days now
- 3 days/yr
- Unhealthy air days in 30 yrs
- 4 days/yr
Risk factors via First Street. Map © Google.
Why this score? — see what drove the C+ grade
The composite is a weighted blend of 9 inputs, each scored 0–100. Each bar is that input's sub-score; the figure is the points it added to the 100-point composite (weight × sub-score).
- Cash flow +18.3/30.0
- ARV discount +15.0/15.0
- Appreciation +8.1/10.0
- DSCR +5.7/10.0
- 1% rule +5.3/10.0
- Livability +4.0/5.0
- Rent growth +2.5/5.0
- Condition / age +2.5/5.0
- Schools +2.0/10.0
$220,000
🖨 Deal sheet 📄 Offer letter ✓ Due diligence
Listing remarks
INVESTORS OPPORTUNITY- JUST MINUTES FROM THE HISTORICAL FORT WORTH STOCKYARDS!! Looking for your next project with BIG potential? This 4 bed, 1 bath brick home sits on a corner lot in a fast developing area. A specious living area with a wood burning fireplace. Conveniently located directly across the street from Rufino Mendoza Elementary School, and surrounded by restaurants, shopping centers, and entertainment! This home comes with a tornado shelter and a spacious backyard. The property does need some TLC, and with vision and care you can transform it into your dream home or an amazing rental investment. Located in a growing area with tons of future potential. This is your chance to inves
Key facts
- Downtown fort worth
- Spacious layout
- Major highways
Tags
Property features AI
Finance
- Financial info: Listing is for cash offers
- HOA & community: No association
Exterior
- Parking: Driveway; No garage or carport spaces
- Utilities: City water; City sewer; Not in a municipal utility district
- Home design: Single-family residence; One story; Residential property
- Construction: Built in 1924; Composition roof
- Exterior features: Wood fencing; Other exterior features; Corner lot
Interior
- Kitchen: No appliances included
- Bedrooms: Primary bedroom on level 1; Three additional bedrooms on level 1 (total 4 bedrooms)
- Bathrooms: 1 full bathroom
- Heating & cooling: No heating; No cooling
- Interior features: Cable TV available; One living area; One dining area; 5 total rooms
- Laundry & utility: Washer hookup
Neighborhood map
What this means for you Summary
Snapshot
- This is a 3-bed/2.0-bath single-family listed at $220k.
Deal economics
- At list price, monthly cash flow is $202 ($2k/yr) — positive.
- The deal already cash-flows at list — no discount required.
- Meets the 1% rule at list price ($2k rent vs $220k).
- Recommended offer: $213k (3.0% below list) — sets the bar for market timing.
- Cap rate 7.4% vs local median 3.9% in Fort Worth — top-decile yield for the area; either an underpriced asset or a hidden risk that comps aren't pricing in. Stress-test before assuming the spread holds.
Location & tenants
- Location reads 80/100 on livability (#49 in TX, #1,954 nationally) — a professional / high-income tenant draw. Strengths: amenities A+, cost of living A+, housing A+; Watch: crime F.
- Fort Worth ISD (urban): math 18% / reading 28% proficiency, ranked #742 of 826 in TX (top 90%) — low school quality limits family demand, transient renter base, plan for 1-2y turnover; 73% free/reduced lunch — lower-income household profile, screen leases tightly.
- Zoned schools: Rufino Mendoza Sr El (math 8% / reading 17%, grade F, #4,180 of 4,322 statewide, top 97%, 337 students, 90% FRL) — zoned schools average 90% FRL vs 73% district-wide (18 pts higher); higher-poverty schools than district average — tighter screening recommended.
- Market conditions: Rents flat; 33 active listings in the ZIP; 40 comparable units currently listed for rent nearby; rentals at typical pace (median 22d on market — plan ~3-4 weeks tenant-placement turnaround); 42% of comp listings sitting > 30 days — soft ceiling on asking rent; 18,938 units permitted in Tarrant County in 2024 (8,336 in 5+ unit buildings).
- At $2,258/mo this rent would consume 51% of the median local household income ($53k/yr) (locally 406% of renters already pay >50% of income on rent) — very limited rent-growth headroom before tenants either downsize or default.
Forward outlook
- In year one you build about $15k of equity ($2k loan paydown + $14k appreciation (6.3% local appreciation)).
- Tarrant County population projected at +41% by 2050 — long-run rental-demand tailwind backs the buy-and-hold thesis.
- At projected returns (6.3% appreciation + 0.0% rent growth), your $62k cash investment doubles in ~4 years — after that, you're playing with house money.
- By year 3, paydown + projected appreciation supports a ~$38k cash-out refi (75% LTV) — recoverable capital for the next deal without selling this one.
Negotiation context
- It's been on market 42 days — a 3% lower offer ($213k) is reasonable based on typical stale-listing flexibility.
Risks & watch-outs
- Watch-outs: built in 1924 — expect roof / HVAC / electrical / plumbing capex.
- Climate carrying-cost: extreme-heat days projected 7→23/yr by 2055 (HVAC capex compounding) — expect insurance premiums to compound above CPI over the hold.
Questions for the listing agent
- It's been on market 42 days. Have you received any prior offers? Is the seller open to a 3% concession, seller financing, or rate buy-down credit?
- Built in 1924 — when were the roof, HVAC, electrical panel, plumbing, and water heater last replaced?
- Is there a deadline driving the sale (1031 exchange, divorce, estate, relocation)? That informs how much negotiation room exists.
- Schools are D-rated, which usually means shorter tenancies and higher turnover. Who's the typical renter profile here, and what's been the actual vacancy rate?
- Crime grade is F in this area — have there been break-ins, vandalism, or insurance claims at this property in the last 3 years? What carrier currently insures it and at what premium?
- What's the average days-on-market for RENTAL listings here right now (not sales)? A rising rental-DOM trend means longer vacancies and softer asking-rent achievability than the comps imply.
- What's the recent tenant-quality profile in this submarket — average credit score on applications, eviction rate, late-payment / NSF rate, and stable-employment percentage? A property-management company in the area should have these aggregated.
- How much new for-sale + rental construction is in the pipeline within 1–3 miles? Heavy new supply typically softens prices + rents 12–24 months out; constrained supply supports both.
Investment metrics
- 1% rule
- 1.03% ✓
- Cap rate
- 7.39%
- Cash-on-cash
- 3.93%
- DSCR
- 1.17
- GRM
- 8.1
CMA / ARV
- ARV (median comp)
- $267,292
- List price
- $220,000
- Delta
- -17.69%
- Verdict
- UNDERPRICED
- Comps
- 20 within 1.0 mi
Show comp detail 12 sales within ~0.75 mi
| Address | Dist | Beds/Ba | Sqft | Sold | Price | $/sf | Match |
|---|---|---|---|---|---|---|---|
| 1606 Denver Ave | 0.28mi | 3/2.0 | 1,619 (+0%) | 6mo | $390,000 | $241 | 81 |
| 1410 Lee Ave | 0.35mi | 3/2.0 | 1,635 (+1%) | 10mo | $349,900 | $214 | 73 |
| 1201 15th Pl | 0.27mi | 3/2.0 | 1,560 (-3%) | 12mo | $335,000 | $215 | 72 |
| 906 14th St | 0.13mi | 3/1.0 | 1,716 (+6%) | 13mo | $259,000 | $151 | 69 |
| 1307 Clinton Ave | 0.40mi | 3/2.0 | 1,500 (-7%) | 6mo | $285,000 | $190 | 65 |
| 1715 Homan Ave | 0.49mi | 3/1.0 | 1,568 (-3%) | 9mo | $225,000 | $143 | 61 |
| 1105 Park St | 0.49mi | 3/2.0 | 1,551 (-4%) | 14mo | $268,000 | $173 | 59 |
| 1710 Gould Ave | 0.42mi | 3/2.0 | 1,405 (-13%) | 0mo | $280,000 | $199 | 59 |
| 1612 Lee Ave | 0.45mi | 4/3.0 (+1) | 1,636 (+2%) | 15mo | $375,000 | $229 | 55 |
| 1702 Lee Ave | 0.51mi | 3/2.0 | 1,544 (-4%) | 21mo | $370,000 | $240 | 52 |
| 1710 Denver Ave | 0.42mi | 4/2.0 (+1) | 1,821 (+13%) | 14mo | $368,900 | $203 | 42 |
| 1616 Belmont Ave | 0.41mi | 3/1.0 | 1,426 (-12%) | 23mo | $188,900 | $132 | 38 |
Match score weights: distance 35% · size 25% · config 20% · recency 20%. Top-matched comps best support the ARV.
Projected returns pro-forma
6.29% appreciation · 0.03% rent growth · sell at horizon
- IRR
- 17.9%
- Equity multiple
- 2.20×
- Total profit
- $73,638
- Equity at exit
- $142,286
- IRR
- 16.4%
- Equity multiple
- 4.15×
- Total profit
- $193,977
- Equity at exit
- $261,539
Cash invested: $61,600 (down + closing). Projections, not guarantees.
Landlord ↔ Tenant lean methodology
- Overall (STATE)
- 87 Strongly Landlord-Friendly
- State Texas
- 87 Strongly Landlord-Friendly · R+5
- County
- — inherits STATE
- City
- — inherits STATE
ZIP-level market 76164
- Home prices YoY
- 2.1%
- Rents YoY
- 0.0%
- Active inventory
- 33
- Price-to-rent
- 8.1×
Monthly cashflow live
- Estimated rent
- $2,258 high interval (Pro) →
- Mortgage (P&I)
- −$1,154
- Tax from tax record
- −$337 /mo · $4,041/yr
- Insurance
- −$92
- HOA
- −$0
- Vacancy / Maint / Mgmt
- −$474
- Net cashflow
- $202
Break-even live
UW: 25.0% down · 7.5% · 30yr · 1.5% tax · 5.0% vac · 8.0% maint · 8.0% mgmt
Financing live
Cash to close
- Down payment
- $55,000
- Closing costs
- $6,600
- Reserves months
- —
- Total cash needed
- —
Loan-product check · same deal, 3 products live
Conventional
25% down · 7.5% · 30yr
- Down + closing
- —
- Monthly P&I
- —
- Monthly cashflow
- —
- DSCR
- —
- Eligible?
- —
Personal DTI + credit; lowest rate.
DSCR
20% down · 8.5% · 30yr
- Down + closing
- —
- Monthly P&I
- —
- Monthly cashflow
- —
- DSCR
- —
- Eligible?
- —
No personal income docs; deal must DSCR.
Hard money
10% down · 12.0% · 12mo
- Down + closing
- —
- Monthly P&I
- —
- Monthly cashflow
- —
- DSCR
- —
- Eligible?
- —
Short-term bridge; refi at stabilization.
Rent comps 40 comps
| Address | Beds | Baths | Sqft | Rent | $/sqft | DOM | Units | Dist |
|---|---|---|---|---|---|---|---|---|
| 1321 Denver Ave Fort Worth, TX | 3.0 | 1.0 | 1288 | $1,800 | $1.40 | 43d | 1 | 0.05mi |
| 1217 Clinton Ave Fort Worth, TX | 4.0 | 2.0 | 1698 | $1,795 | $1.06 | 43d | 1 | 0.46mi |
| 207 Adrian Dr Fort Worth, TX | 3.0 | 2.5 | 2042 | $3,300 | $1.62 | 15d | 1 | 1.08mi |
| 2820 Weisenberger St Unit 102 Fort Worth, TX | 2.0 | 2.5 | 1628 | $3,000 | $1.84 | 43d | 1 | 1.08mi |
| 2820 Weisenberger St Unit 110 Fort Worth, TX | 2.0 | 2.5 | 1628 | $3,100 | $1.90 | 43d | 1 | 1.08mi |
| 209 Wimberly St Unit 1-205 Fort Worth, TX | 2.0 | 2.0 | 1223 | $2,037 | $1.67 | 14d | 1 | 1.08mi |
| 209 Wimberly St Unit 2-109 Fort Worth, TX | 2.0 | 2.0 | 1277 | $1,999 | $1.57 | 43d | 1 | 1.08mi |
| 2824 Weisenberger St Unit 102 Fort Worth, TX | 2.0 | 2.5 | 1628 | $3,000 | $1.84 | 43d | 1 | 1.09mi |
| 218 Wimberly St Fort Worth, TX | 3.0 | 2.5 | 2080 | $3,400 | $1.63 | 5d | 1 | 1.10mi |
| 2801 Weisenberger St Fort Worth, TX | 3.0 | 4.0 | 2053 | $3,395 | $1.65 | 43d | 1 | 1.11mi |
| 217 Adrian Dr Fort Worth, TX | 2.0 | 1.0 | 1152 | $1,900 | $1.65 | 43d | 1 | 1.11mi |
| 2805 Weisenberger St #502 Fort Worth, TX | 3.0 | 3.5 | 2024 | $3,250 | $1.61 | 43d | 1 | 1.11mi |
| 300 Foch St Unit 120 Fort Worth, TX | 2.0 | 2.5 | 1668 | $2,950 | $1.77 | 43d | 1 | 1.16mi |
| 2721 Wingate St Fort Worth, TX | 1.0–2.0 | 1.0–2.0 | 996 | $2,520 | $2.53 | 43d | 4 | 1.17mi |
| 150 Boland St Unit 187 Fort Worth, TX | 2.0 | 2.0 | 1385 | $1,881 | $1.36 | 3d | 1 | 1.21mi |
| 2726 Mercedes Ave Unit 2763 Fort Worth, TX | 2.0 | 2.0 | 1129 | $1,778 | $1.57 | 3d | 1 | 1.25mi |
| 2600 W 7th St Unit 1726 Fort Worth, TX | 2.0 | 2.0 | 1263 | $3,095 | $2.45 | 15d | 1 | 1.25mi |
| 447 N Main St Fort Worth, TX | 1.0–2.0 | 1.0–2.0 | 955 | $2,383 | $2.50 | 2d | 12 | 1.26mi |
| 852 Northwood Rd Fort Worth, TX | 3.0 | 2.0 | 1438 | $2,845 | $1.98 | 43d | 1 | 1.26mi |
| 154 N Bailey Ave Fort Worth, TX | 1.0–2.0 | 1.0–2.0 | 985 | $1,659 | $1.68 | 22d | 7 | 1.26mi |
| 408 Foch St Fort Worth, TX | 2.0 | 2.0 | 1132 | $2,100 | $1.86 | 24d | 1 | 1.29mi |
| 411 Harrold St Fort Worth, TX | 2.0 | 1.0–2.0 | 868 | $3,089 | $3.56 | 1d | 68 | 1.32mi |
| 2514 Columbus Ave Fort Worth, TX | 3.0 | 2.0 | 1432 | $2,500 | $1.75 | 43d | 1 | 1.37mi |
| 601 Stockyards Blvd Fort Worth, TX | 2.0 | 1.0–2.0 | 815 | $2,814 | $3.45 | 1d | 62 | 1.37mi |
| 2621 Lee Ave Unit B Fort Worth, TX | 3.0 | 2.0 | 1400 | $1,550 | $1.11 | 22d | 1 | 1.38mi |
| 2621 Lee Ave Unit B Fort Worth, TX | 3.0 | 2.0 | 1400 | $1,595 | $1.14 | 43d | 1 | 1.38mi |
| 2621 Lee Ave Unit B Fort Worth, TX | 3.0 | 2.0 | 1400 | $1,550 | $1.11 | 6d | 1 | 1.38mi |
| 2621 Lee Ave Fort Worth, TX | 3.0 | 2.0 | 1400 | $1,550 | $1.11 | 22d | 1 | 1.38mi |
| 2901 W 5th St Fort Worth, TX | 1.0–2.0 | 1.0–2.0 | 851 | $2,199 | $2.58 | 2d | 7 | 1.41mi |
| 3900 White Settlement Rd Fort Worth, TX | 2.0 | 1.0–2.0 | 1089 | $1,424 | $1.31 | 1d | 2 | 1.41mi |
| 101 Lindenwood Dr Fort Worth, TX | 3.0 | 2.0 | 2064 | $3,895 | $1.89 | 43d | 1 | 1.42mi |
| 769 Samuels Ave Fort Worth, TX | 1.0–3.0 | 1.0–3.0 | 1113 | $2,708 | $2.43 | 3d | 27 | 1.42mi |
| 2424 Mckinley Ave Fort Worth, TX | 2.0 | 2.0 | 1200 | $1,750 | $1.46 | 14d | 1 | 1.43mi |
| 2424 Mckinley Ave Fort Worth, TX | 2.0 | 2.0 | 1200 | $1,750 | $1.46 | 22d | 1 | 1.43mi |
| 916 W Peach St Fort Worth, TX | 3.0 | 3.5 | 2231 | $5,200 | $2.33 | 43d | 1 | 1.43mi |
| 600 Harrold St Unit 611 Fort Worth, TX | 3.0 | 2.0 | 1506 | $2,602 | $1.73 | 3d | 1 | 1.43mi |
| 600 Harrold St Unit 637 Fort Worth, TX | 2.0 | 2.0 | 1157 | $2,057 | $1.78 | 3d | 1 | 1.43mi |
| 600 Harrold St Fort Worth, TX | 2.0 | 2.0 | 1330 | $2,455 | $1.85 | 24d | 1 | 1.45mi |
| 2600 W 7th St Fort Worth, TX | 2.0 | 2.0 | 1350 | $2,725 | $2.02 | 3d | 5 | 1.47mi |
| 2600 W 7th St Fort Worth, TX | 2.0 | 2.0 | 1263 | $3,100 | $2.45 | 43d | 5 | 1.47mi |
Listing history 15 events
-
2026-06-18days on market $220,000 Active 42 DOM
-
2026-06-17days on market $220,000 Active 41 DOM
-
2026-06-16days on market $220,000 Active 40 DOM
-
2026-06-15days on market $220,000 Active 39 DOM
-
2026-06-13days on market $220,000 Active 37 DOM
-
2026-06-09days on market $220,000 Active 33 DOM
-
2026-06-08days on market $220,000 Active 32 DOM
-
2026-06-07days on market $220,000 Active 31 DOM
-
2026-06-04days on market $220,000 Active 28 DOM
-
2026-06-03days on market $220,000 Active 27 DOM
-
2026-06-02days on market $220,000 Active 26 DOM
-
2026-06-01days on market $220,000 Active 25 DOM
-
2026-05-31days on market $220,000 Active 24 DOM
-
2026-04-09$220,000 Active 794-char remark
-
1990-05-23soldstatus
ⓘ Source: listings_history table (triggers on properties + properties_extension) + one-shot
backfill from property_details.listing_events for pre-trigger history.
Tax reassessment forecast TX · Resets to sale price
- Current annual tax
- $4,041 · $337/mo
- Projected year-2 tax
- $4,041 · $337/mo
- Expected delta
- $0/yr ($0/mo · 0.0%)
ⓘ Screening estimate from a state-policy table — verify with the county assessor before closing.
Climate risk First Street
- Flood 1/10 Low FEMA zone X (unshaded) · 0% chance over 30 yrs
- Wildfire 1/10 Low
- Heat 7/10 Severe 7 d/yr ≥109°F today · 23 d/yr by 30 yrs out
- Wind 4/10 Moderate 24% chance of damaging wind over 30 yrs
- Air quality 3/10 Moderate 3 unhealthy d/yr today · 4 by 30 yrs out
Nearby sold comps map
Loading sold comps map…
Walkable amenities ~0.75 mi
Loading nearby amenities…
Taxation est. · year 1
- Rental income
- $27,098
- − Mortgage interest
- −$12,323
- − Property taxes
- −$4,041
- − Insurance
- −$1,100
- − Repairs & maintenance
- −$2,168
- − Management
- −$2,168
- − Depreciation
- −$6,400
- Taxable loss
- −$1,102
- Est. tax savings @ 24.0%
- +$264
- After-tax cash flow
- $2,687/yr
For passive investors: Depreciation is non-cash, so a rental often shows a tax loss while cash-flowing — sheltering income. Rental losses are passive: they offset passive income freely, and up to $25,000/yr can offset ordinary (W-2) income if you actively participate and your MAGI is under $100k (phasing out to $0 by $150k); unused losses carry forward. On sale, claimed depreciation is recaptured at up to 25%, and gains may owe capital-gains tax (a 1031 exchange can defer both). Figures are a year-1 estimate at your 24.0% rate — not tax advice; consult a CPA.
Schools (NCES district)
- District
- Fort Worth ISD
- NCES district ID
- 4819700
- Math proficiency
- 18% ▼ -16.00%
- Reading proficiency
- 28% ▼ -6.00%
- Median HH income
- $42,109
- Composite
- 19.61/100
- National rank
- #8753
- State rank
- #742 of 826 in TX
Livability — Fort Worth
- Score
- 80/100
- State rank
- #49
- US rank
- #1954
Category grades
Schools grade is shown separately in the Schools card above.
Census & demographics
- Census place
- Fort Worth, TX
- County
- Tarrant County · 2,033,669 people
- City population
- 911,619
- Metro
- Dallas-Fort Worth-Arlington, TX
- Population (ZIP)
- 13,457
- Household income
- $52,882
- Rent vs Own
- Severe rent burden
- 406.0
Population outlook (Tarrant County) Hauer SSP2
- Today (2025)
- 2,380,417 people
- By 2030
- 2,578,900 · +8.3%
- By 2040
- 2,974,995 · +25.0%
- By 2050
- 3,350,489 · +40.8%
- By 2075
- 4,216,909 · +77.2%
- By 2100
- 4,741,527 · +99.2%
Race, ethnicity, and origin ACS 2023
- Neighborhood character
- Predominantly Hispanic (92%)
- Race & ethnicity
- Hispanic / Latino 92% Two or more races 28% White 5% Black 2%
- Hispanic origin (detail)
- Mexican 86%
- Foreign-born
- 35% · Canada
- Languages at home
- 27% English-only · Spanish 73%
Political lean MEDSL · Tarrant
- 2024 margin
- Lean R (+5.1) · D 46.7% · R 51.9% · Other 1.4%
- 2008→2024 swing
- +6.6pp toward D · 2008: -11.7pp · 2024: -5.1pp
- All cycles
- 2024: R+5.1 2020: D+0.2 2016: R+8.7 2012: R+15.7 2008: R+11.7
Not yet ingested
- Civics
- —
Market trends
- HPI YoY
- ▲ 6.29%
- Current HPI
- 305.7594
- Rent YoY
- ▬ 0.03%
- Metro
- Dallas-Fort Worth-Arlington, TX
- State GDP YoY
- ▲ 3.95%
- F500 in state
- 110
Industry mix (Fortune 500 HQ in TX)
| Industry | F500 HQs | Revenue |
|---|---|---|
| Energy | 16 | $1,198B |
|
||
| Technology | 5 | $198B |
|
||
| Engineering / Construction | 4 | $72B |
|
||
| Energy Services | 3 | $60B |
|
||
| Utilities | 3 | $41B |
|
||
| Healthcare | 2 | $330B |
|
||
Price history
2 events — show timeline
- 2026-04-09 Listed $220,000 NTREIS
- 1990-05-23 Sold (Public Records) — Public Records
Property tax history
+4.9%/yrLatest (2025): $4,041 · -20.7% YoY. Source: county tax records.
Cash-flow waterfall
monthlySold comps — $/sqft
last 12 mo · ≤1 miLoading sold comps…