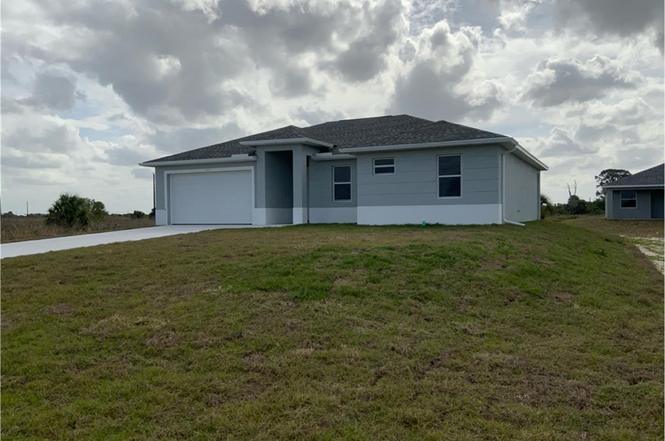
125 Bethlehem Pl · Pioneer, FL
Flood risk 6/10 · Moderate
- FEMA flood zone
- X (unshaded)
- Chance of flooding over 30 yrs
- 0.89%
- Est. flood insurance / yr
- $507 – $1,088
Fire risk 5/10 · Moderate
- Est. fire insurance / yr
- $947 – $1,759
Heat risk 9/10 · Severe
- Hot days now (above 108°F)
- 7 days/yr
- Hot days in 30 yrs
- 27 days/yr
Wind risk 10/10 · Severe
- Chance of severe wind over 30 yrs
- 99.0%
Air-quality risk 2/10 · Minimal
- Unhealthy air days now
- 1 days/yr
- Unhealthy air days in 30 yrs
- 1 days/yr
Risk factors via First Street. Map © Google.
Why this score? — see what drove the D+ grade
The composite is a weighted blend of 9 inputs, each scored 0–100. Each bar is that input's sub-score; the figure is the points it added to the 100-point composite (weight × sub-score).
- ARV discount +12.1/15.0
- Appreciation +10.0/10.0
- Cash flow +7.6/30.0
- Livability +3.2/5.0
- Schools +3.1/10.0
- 1% rule +2.9/10.0
- Rent growth +2.5/5.0
- Condition / age +2.5/5.0
- DSCR +1.7/10.0
$298,900
🖨 Deal sheet (PDF) 📄 Offer letter ✓ Due diligence
Listing remarks
Charming 3-Bedroom, 2-Bath Home with Spacious Backyard in LaBelle 3 Bedrooms | 2 Bathrooms | Open Layout Spacious living area perfect for family gatherings Well-equipped kitchen with plenty of storage Master suite with ample closet space Private backyard ideal for entertaining, gardening, or relaxing Natural light throughout enhances the bright, airy feel Convenient location close to schools, shops, and amenities Move-in ready home with comfortable, practical living spaces This home offers charm, comfort, and a great location—perfect for families or anyone looking to enjoy LaBelle living.
Key facts
- Spacious backyard
- Private backyard
- Natural light
Tags
Property features AI
Finance
- Financial info: Pets allowed
- HOA & community: No association fee; Non-gated community
Exterior
- Parking: Attached 2-car garage with garage door opener; Detached 2-space carport; 4 covered parking spaces
- Security: Smoke detector(s); Security/high-impact doors
- Utilities: Public water; Public sewer; Cable not available
- Home design: Single-story; Entry level: 1; Faces west; Resale property; Non-gated community
- Construction: Block, concrete and stucco construction; Shingle roof
- Exterior features: Patio; Security/high-impact doors; Smoke detector(s); Rectangular lot; Public maintained road; East exposure; Has view
Interior
- Kitchen: Dishwasher; Electric cooktop; Microwave; Refrigerator; Kitchen island; Breakfast bar; Pantry; Eat-in kitchen
- Bedrooms: Bedroom on main level; Family room
- Flooring: Tile
- Bathrooms: 2 full bathrooms; Shower only (separate shower); Bathtub; Dual sinks
- Heating & cooling: Central heating (electric); Central air conditioning (electric); Ceiling fans
- Interior features: Impact glass windows; Breakfast bar; Built-in features; Bathtub; Dual sinks; Eat-in kitchen; Family/Dining room; Kitchen island; Living/Dining room; Custom mirrors; Pantry; Separate shower; Walk-in closet(s); Split bedrooms
- Laundry & utility: Washer hookup; Dryer hookup; Inside laundry; Laundry tub
Neighborhood map
What this means for you Summary
Snapshot
- This is a 3-bed/2.0-bath single-family listed at $299k.
Deal economics
- At list price, monthly cash flow is $-353 ($-4k/yr) — negative.
- To cash-flow at today's rent, offer at most $236k (20.9% below list).
- To meet the 1% rule (rent ≥ 1% of price), the offer needs to be $235k (21.5% below list).
- Recommended offer: $235k (21.5% below list) — sets the bar for 1% rule.
Location & tenants
- Location reads 63/100 on livability (#727 in FL) — a middle-class / working-renter tenant base. Strengths: cost of living A+, health & safety A+, crime A; Watch: amenities F, commute F, employment F.
- Hendry (town): math 35% / reading 40% proficiency, ranked #65 of 73 in FL (top 89%) — families likely to look elsewhere, expect single-tenant / working-renter base with shorter leases; 75% free/reduced lunch — lower-income household profile, screen leases tightly.
- Zoned schools: Country Oaks Elementary School (math 48% / reading 45%, grade D-, #1,223 of 2,144 statewide, top 57%, 893 students, 75% FRL); Labelle Middle School (math 37% / reading 38%, grade F, #395 of 571 statewide, top 70%, 817 students, 72% FRL); Labelle High School (math 42% / reading 41%, grade F, #284 of 667 statewide, top 43%, 1,451 students, 62% FRL).
- Market conditions: 950 active listings in the ZIP; 3 comparable units currently listed for rent nearby; rentals at typical pace (median 26d on market — plan ~3-4 weeks tenant-placement turnaround); 557 units permitted in Hendry County in 2024 (45 in 5+ unit buildings).
- At $2,347/mo this rent would consume 49% of the median local household income ($57k/yr) (locally 498% of renters already pay >50% of income on rent) — very limited rent-growth headroom before tenants either downsize or default.
Forward outlook
- In year one you build about $32k of equity ($2k loan paydown + $30k appreciation (10.0% local appreciation)).
- Hendry County population projected to shrink 7% by 2050 — rents likely to lag national; underwrite the cash flow, not the appreciation.
- By year 2, paydown + projected appreciation supports a ~$51k cash-out refi (75% LTV) — recoverable capital for the next deal without selling this one.
Negotiation context
- It's been on market 130 days — a 12% lower offer ($263k) is reasonable based on typical stale-listing flexibility.
- 4 sale attempts since 2y ago; this cycle's ask is 14845% above the opening price — seller raised mid-cycle; expect resistance to lowballs.
Risks & watch-outs
- Climate carrying-cost: major flood risk; severe wind risk, 99% chance of damaging wind over 30y; moderate wildfire risk; extreme-heat days projected 7→27/yr by 2055 (HVAC capex compounding) — expect insurance premiums to compound above CPI over the hold.
Questions for the listing agent
- What do current leases actually rent for vs. the listed asking? Can we see a recent rent roll and the last 12 months of T-12 income?
- It's been on market 130 days. Have you received any prior offers? Is the seller open to a 21% concession, seller financing, or rate buy-down credit?
- Why hasn't it sold? Are there any deal-killer items the seller is aware of (foundation, flood, title, zoning, code violations)?
- Is there a deadline driving the sale (1031 exchange, divorce, estate, relocation)? That informs how much negotiation room exists.
- Schools are A-rated — typically a magnet for longer-tenancy family renters. What's the average tenant stay here, and is there a school-zone premium baked into asking?
- The area grade is low — what's the realistic commute time and amenity access for the typical tenant pool here? Any planned neighborhood developments (good or bad) we should know about?
- What's the average days-on-market for RENTAL listings here right now (not sales)? A rising rental-DOM trend means longer vacancies and softer asking-rent achievability than the comps imply.
- What's the recent tenant-quality profile in this submarket — average credit score on applications, eviction rate, late-payment / NSF rate, and stable-employment percentage? A property-management company in the area should have these aggregated.
- How much new for-sale + rental construction is in the pipeline within 1–3 miles? Heavy new supply typically softens prices + rents 12–24 months out; constrained supply supports both.
Investment metrics
- 1% rule
- 0.79% ✗
- Cap rate
- 4.87%
- Cash-on-cash
- -5.07%
- DSCR
- 0.77
- GRM
- 10.6
CMA / ARV
- ARV (on-the-fly)
- $332,536
- Comps found
- 12
Show comp detail 12 sales within ~0.75 mi
| Address | Dist | Beds/Ba | Sqft | Sold | Price | $/sf | Match |
|---|---|---|---|---|---|---|---|
| 1207 Andover Dr | 0.29mi | 3/2.0 | 1,662 (-2%) | 1mo | $327,500 | $197 | 83 |
| 1215 Andover Dr | 0.33mi | 3/2.0 | 1,662 (-2%) | 7mo | $329,000 | $198 | 77 |
| 324 Kansas Ter | 0.18mi | 3/2.0 | 1,536 (-9%) | 2mo | $284,900 | $185 | 75 |
| 526 Braelyn St | 0.53mi | 3/2.0 | 1,662 (-2%) | 1mo | $327,000 | $197 | 72 |
| 124 Bethlehem Pl | 0.04mi | 3/2.0 | 1,536 (-9%) | 13mo | $302,900 | $197 | 72 |
| 1213 Andover Dr | 0.32mi | 4/2.0 (+1) | 1,662 (-2%) | 10mo | $330,000 | $199 | 70 |
| 1014 Lockwood St | 0.59mi | 3/2.0 | 1,666 (-1%) | 2mo | $320,000 | $192 | 69 |
| 215 Nautilus Ave | 0.39mi | 3/2.0 | 1,798 (+6%) | 9mo | $284,000 | $158 | 63 |
| 637 Royce Rd | 0.70mi | 3/2.0 | 1,662 (-2%) | 6mo | $329,000 | $198 | 60 |
| 1004 Silverfish Dr | 0.34mi | 3/2.0 | 1,536 (-9%) | 14mo | $302,900 | $197 | 57 |
| 605 Marcella Ave | 0.73mi | 4/2.0 (+1) | 1,662 (-2%) | 4mo | $330,000 | $199 | 55 |
| 626 Royce Rd | 0.75mi | 4/2.0 (+1) | 1,662 (-2%) | 7mo | $330,000 | $199 | 52 |
Match score weights: distance 35% · size 25% · config 20% · recency 20%. Top-matched comps best support the ARV.
Projected returns pro-forma
10.0% appreciation · 3.0% rent growth · sell at horizon
- IRR
- 20.7%
- Equity multiple
- 2.68×
- Total profit
- $140,402
- Equity at exit
- $269,273
- IRR
- 18.8%
- Equity multiple
- 6.15×
- Total profit
- $431,406
- Equity at exit
- $580,697
Cash invested: $83,692 (down + closing). Projections, not guarantees.
Landlord ↔ Tenant lean methodology
- Overall (STATE)
- 87 Strongly Landlord-Friendly
- State Florida
- 87 Strongly Landlord-Friendly · R+3
- County
- — inherits STATE
- City
- — inherits STATE
ZIP-level market 33935
- Home prices YoY
- 16.3%
- Active inventory
- 950
- Price-to-rent
- 10.6×
Monthly cashflow live
- Estimated rent
- $2,347 medium interval (Pro) →
- Mortgage (P&I)
- −$1,567
- Tax from tax record
- −$516 /mo · $6,186/yr
- Insurance
- −$125
- HOA
- −$0
- Vacancy / Maint / Mgmt
- −$493
- Net cashflow
- $-353
Break-even live
Sensitivity live
| Price | -10% $-184 | -5% $-269 | +0% $-353 | +5% $-438 | +10% $-523 |
|---|---|---|---|---|---|
| Rent | -10% $-539 | -5% $-446 | +0% $-353 | +5% $-261 | +10% $-168 |
| Rate | -1.0pp $-203 | -0.5pp $-277 | base $-353 | +0.5pp $-431 | +1.0pp $-510 |
UW: 25.0% down · 7.5% · 30yr · 1.5% tax · 5.0% vac · 8.0% maint · 8.0% mgmt
Financing live
Cash to close
- Down payment
- $74,725
- Closing costs
- $8,967
- Reserves months
- —
- Total cash needed
- —
Loan-product check · same deal, 3 products live
Conventional
25% down · 7.5% · 30yr
- Down + closing
- —
- Monthly P&I
- —
- Monthly cashflow
- —
- DSCR
- —
- Eligible?
- —
Personal DTI + credit; lowest rate.
DSCR
20% down · 8.5% · 30yr
- Down + closing
- —
- Monthly P&I
- —
- Monthly cashflow
- —
- DSCR
- —
- Eligible?
- —
No personal income docs; deal must DSCR.
Hard money
10% down · 12.0% · 12mo
- Down + closing
- —
- Monthly P&I
- —
- Monthly cashflow
- —
- DSCR
- —
- Eligible?
- —
Short-term bridge; refi at stabilization.
Rent comps 3 comps
| Address | Beds | Baths | Sqft | Rent | $/sqft | DOM | Units | Dist |
|---|---|---|---|---|---|---|---|---|
| 1305 Andover Dr Labelle, FL | 3.0 | 2.0 | 1750 | $2,400 | $1.37 | 25d | 1 | 0.38mi |
| 634 Royce Rd Labelle, FL | 3.0 | 2.0 | 1462 | $2,100 | $1.44 | 16d | 1 | 0.69mi |
| 513 Ella Jean Pl Labelle, FL | 4.0 | 2.0 | 1485 | $2,000 | $1.35 | 25d | 1 | 0.72mi |
Listing history 31 events
-
2026-06-22days on market $298,900 Active 130 DOM
-
2026-06-18days on market $298,900 Active 127 DOM
-
2026-06-17days on market $298,900 Active 126 DOM
-
2026-06-16days on market $298,900 Active 125 DOM
-
2026-06-15days on market $298,900 Active 124 DOM
-
2026-06-13days on market $298,900 Active 122 DOM
-
2026-06-13days on market $298,900 Active 121 DOM
-
2026-06-10days on market $298,900 Active 119 DOM
-
2026-06-09days on market $298,900 Active 118 DOM
-
2026-06-08days on market $298,900 Active 117 DOM
-
2026-06-07days on market $298,900 Active 116 DOM
-
2026-06-03days on market $298,900 Active 112 DOM
-
2026-06-02days on market $298,900 Active 111 DOM
-
2026-06-01days on market $298,900 Active 110 DOM
-
2026-05-31days on market $298,900 Active 109 DOM
-
2026-05-22historical $1,950
-
2026-04-20price $298,900
-
2026-03-24price $1,950
-
2026-03-24price $299,000
-
2026-03-15$2,000
-
2026-03-15historical $2,000
-
2026-03-15$2,000
-
2026-03-08price $304,999
-
2026-02-11$325,000 Active
-
2024-04-28historical $2,300
-
2024-04-10price $2,300
-
2024-04-09price $2,250
-
2024-03-22price $2,400
-
2024-03-06$2,500
-
2024-03-05soldstatus $295,000
-
2003-05-30soldstatus $550,000
ⓘ Source: listings_history table (triggers on properties + properties_extension) + one-shot
backfill from property_details.listing_events for pre-trigger history.
Tax reassessment forecast FL · Resets to sale price
- Current annual tax
- $6,186 · $516/mo
- Projected year-2 tax
- $6,186 · $516/mo
- Expected delta
- $0/yr ($0/mo · 0.0%)
ⓘ Screening estimate from a state-policy table — verify with the county assessor before closing.
Climate risk First Street
- Flood 6/10 Major FEMA zone X (unshaded) · 89% chance over 30 yrs
- Wildfire 5/10 Major
- Heat 9/10 Extreme 7 d/yr ≥108°F today · 27 d/yr by 30 yrs out
- Wind 10/10 Extreme 99% chance of damaging wind over 30 yrs
- Air quality 2/10 Low 1 unhealthy d/yr today · 1 by 30 yrs out
Nearby sold comps map
Loading sold comps map…
Walkable amenities ~0.75 mi
Loading nearby amenities…
Taxation est. · year 1
- Rental income
- $28,164
- − Mortgage interest
- −$16,743
- − Property taxes
- −$6,186
- − Insurance
- −$1,494
- − Repairs & maintenance
- −$2,253
- − Management
- −$2,253
- − Depreciation
- −$8,695
- Taxable loss
- −$9,462
- Est. tax savings @ 24.0%
- +$2,271
- After-tax cash flow
- $-1,970/yr
For passive investors: Depreciation is non-cash, so a rental often shows a tax loss while cash-flowing — sheltering income. Rental losses are passive: they offset passive income freely, and up to $25,000/yr can offset ordinary (W-2) income if you actively participate and your MAGI is under $100k (phasing out to $0 by $150k); unused losses carry forward. On sale, claimed depreciation is recaptured at up to 25%, and gains may owe capital-gains tax (a 1031 exchange can defer both). Figures are a year-1 estimate at your 24.0% rate — not tax advice; consult a CPA.
Schools (NCES district)
- District
- Hendry
- NCES district ID
- 1200780
- Math proficiency
- 35% ▼ -11.00%
- Reading proficiency
- 40% ▼ -4.00%
- Median HH income
- $37,043
- Composite
- 31.16/100
- National rank
- #6054
- State rank
- #65 of 73 in FL
Livability — Pioneer
- Score
- 63/100
- State rank
- #727
- US rank
- #15534
Category grades
Schools grade is shown separately in the Schools card above.
Census & demographics
- County
- Hendry County · 23,186 people
- City population
- 23,186
- Metro
- Clewiston, FL
- Population (ZIP)
- 23,186
- Household income
- $57,009
- Rent vs Own
- Severe rent burden
- 498.0
Population outlook (Hendry County) Hauer SSP2
- Today (2025)
- 38,866 people
- By 2030
- 38,558 · -0.8%
- By 2040
- 37,743 · -2.9%
- By 2050
- 36,117 · -7.1%
- By 2075
- 30,070 · -22.6%
- By 2100
- 21,966 · -43.5%
Race, ethnicity, and origin ACS 2023
- Neighborhood character
- Majority Hispanic (56%)
- Race & ethnicity
- Hispanic / Latino 56% White 39% Two or more races 21% Black 2% Native American 2%
- Hispanic origin (detail)
- Mexican 40% Puerto Rican 3% Cuban 5%
- Common ancestry
- Lithuanian 2% Serbian 2% Slovak 1%
- Foreign-born
- 27% · Canada, Jamaica
- Languages at home
- 50% English-only · Spanish 50%
Political lean MEDSL · Hendry
- 2024 margin
- Solid R (+38.3) · D 30.4% · R 68.7%
- 2008→2024 swing
- -31.1pp toward R · 2008: -7.2pp · 2024: -38.3pp
- All cycles
- 2024: R+38.3 2020: R+23.0 2016: R+14.2 2012: R+5.9 2008: R+7.2
Not yet ingested
- Civics
- —
Market trends
- HPI YoY
- ▲ 75.20%
- Current HPI
- 537.4928
- Rent YoY
- —
- Metro
- Clewiston, FL
- State GDP YoY
- ▲ 3.28%
- F500 in state
- 36
Industry mix (Fortune 500 HQ in FL)
| Industry | F500 HQs | Revenue |
|---|---|---|
| Industrial Technology | 2 | $29B |
|
||
| Insurance | 2 | $17B |
|
||
| Retail | 1 | $60B |
|
||
| Technology Distribution | 1 | $58B |
|
||
| Homebuilding | 1 | $35B |
|
||
| Technology Manufacturing | 1 | $35B |
|
||
Price history
-99.6% since first listed16 events — show timeline
- 2026-05-22 Rental Removed $1,950 NAPLESMLS
- 2026-04-20 Price Changed $298,900 FORTMLS
- 2026-03-24 Price Changed $1,950 NAPLESMLS
- 2026-03-24 Price Changed $299,000 FORTMLS
- 2026-03-15 Listed for Rent $2,000 NAPLESMLS
- 2026-03-15 Rental Removed $2,000 FGCMLS
- 2026-03-15 Listed for Rent $2,000 FGCMLS
- 2026-03-08 Price Changed $304,999 FORTMLS
- 2026-02-11 Listed $325,000 FORTMLS
- 2024-04-28 Rental Removed $2,300 FORTMLS
- 2024-04-10 Price Changed $2,300 FORTMLS
- 2024-04-09 Price Changed $2,250 FORTMLS
- 2024-03-22 Price Changed $2,400 FORTMLS
- 2024-03-06 Listed for Rent $2,500 FORTMLS
- 2024-03-05 Sold (Public Records) $295,000 Public Records
- 2003-05-30 Sold (Public Records) $550,000 Public Records
Property tax history
+31.6%/yrLatest (2025): $6,186 · +4.4% YoY. Source: county tax records.
Cash-flow waterfall
monthlySold comps — $/sqft
last 12 mo · ≤1 miLoading sold comps…