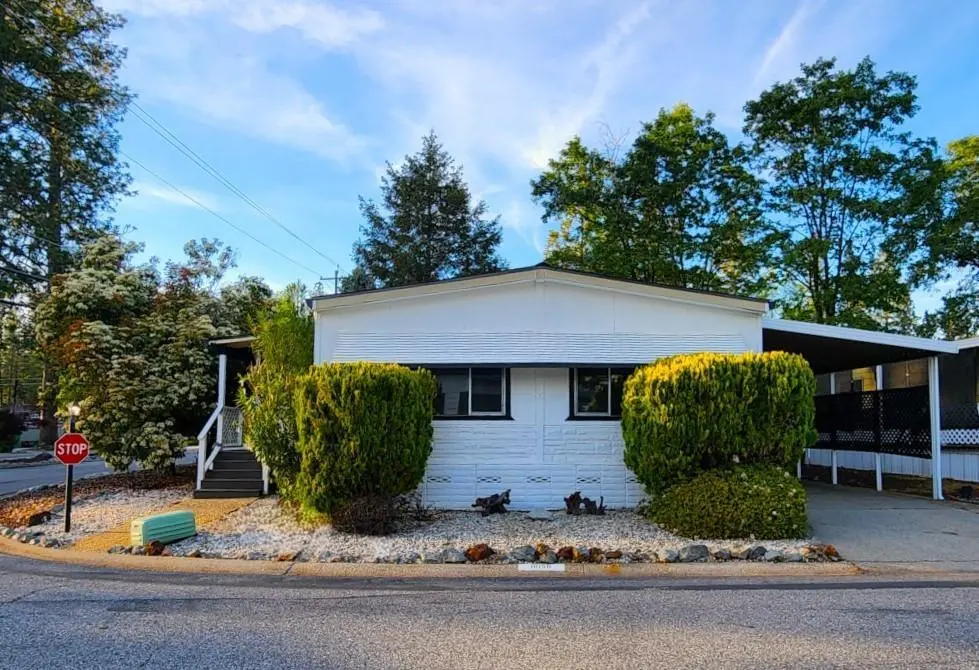
10150 Stone Arch Dr · Alta Sierra, CA
Flood risk 1/10 · Minimal
- FEMA flood zone
- X (unshaded)
- Chance of flooding over 30 yrs
- 0.0%
- Est. flood insurance / yr
- $507 – $1,088
Fire risk 9/10 · Severe
- Est. fire insurance / yr
- $659 – $1,223
Heat risk 5/10 · Moderate
- Hot days now (above 96°F)
- 7 days/yr
- Hot days in 30 yrs
- 16 days/yr
Wind risk 1/10 · Minimal
- Chance of severe wind over 30 yrs
- —
Air-quality risk 10/10 · Severe
- Unhealthy air days now
- 33 days/yr
- Unhealthy air days in 30 yrs
- 40 days/yr
Risk factors via First Street. Map © Google.
Why this score? — see what drove the B+ grade
The composite is a weighted blend of 9 inputs, each scored 0–100. Each bar is that input's sub-score; the figure is the points it added to the 100-point composite (weight × sub-score).
- Cash flow +30.0/30.0
- ARV discount +15.0/15.0
- 1% rule +10.0/10.0
- DSCR +10.0/10.0
- Schools +3.8/10.0
- Livability +3.0/5.0
- Rent growth +2.5/5.0
- Condition / age +2.5/5.0
- Appreciation +0.0/10.0
$65,000
🖨 Deal sheet (PDF) 📄 Offer letter ✓ Due diligence
Listing remarks
Priced to sell! Light fixer, most of the hard work has already been done. This 1344 sq. ft. home features a light and bright living room, dining room, spacious kitchen, family room, separate laundry room, guest bedroom with direct access to guest bathroom, and a master bedroom with a large master bathroom. The exterior includes a spacious deck, shed, storage area, 3 car carport and a cement patio area in the back yard. The roof, HVAC system, and deck are 2 years new and the water heater was replaced last year. The home has great bones and a nice floor plan with lots of potential. Forest Springs is a Premier Park for residence 55+ and features a remodeled Clubhouse with a Full Kitchen, Activ
Key facts
- Spacious kitchen
- Spacious deck
- Storage area
Tags
Property features AI
Finance
- Other: Postal address: 10150 Stone Arch Dr, Grass Valley, CA 95949; Located near Forest Springs Drive and La Barr Meadows Road; Lot lease amount listed separately by park
- HOA & community: No homeowners association; Located in a senior community; Land lease: no
Exterior
- Parking: 3 parking spaces; Attached covered parking and guest parking available; No enclosed garage (carport-style covered parking)
- Utilities: Propane service; Individual electric meter; Individual gas meter; 220V in kitchen; Internet available; Cable connected; Public water (water district); Septic system
- Home design: Manufactured home (double wide) sited in a park; Original condition; Built in 1976; Corner lot, regular-shaped, close to clubhouse
- Construction: Composition roof; Manufactured construction (Lancer make); Skirting: other
- Exterior features: Patio awning, carport awning and porch awning; Covered deck and uncovered patio; Attached porch with steps; Storage area / shed
Interior
- Kitchen: Breakfast area; Pantry closet; Island; Laminate counters; Built-in electric oven, gas cook top, hood over range; Dishwasher, disposal, ice maker
- Bedrooms: 2 bedrooms (includes master bedroom, guest quarters)
- Flooring: Carpet; Vinyl
- Bathrooms: 2 full bathrooms with tub and separate shower stall(s)
- Heating & cooling: Central heating (propane); Central cooling; Ceiling fan(s)
- Interior features: Built-in electric oven; Gas cook top; Hood over range; Free standing refrigerator; Dishwasher; Disposal; Ice maker (plumbed); Gas water heater; Dual-pane full windows with screens; Porch steps, covered deck, uncovered patio and porch; Storage area / shed; Unfurnished
- Laundry & utility: Inside laundry room with stacked washer and dryer included; 220V in laundry; Washer and dryer included
Neighborhood map
What this means for you Summary
Snapshot
- This is a 2-bed/2.0-bath manufactured listed at $65k.
Deal economics
- At list price, monthly cash flow is $1k ($16k/yr) — positive.
- The deal already cash-flows at list — no discount required.
- Meets the 1% rule at list price ($2k rent vs $65k).
- Recommended offer: $63k (3.0% below list) — sets the bar for market timing.
- Cap rate 30.6% vs local median 3.4% in Alta Sierra — top-decile yield for the area; either an underpriced asset or a hidden risk that comps aren't pricing in. Stress-test before assuming the spread holds.
Location & tenants
- Location reads 59/100 on livability (#662 in CA) — a working-class tenant base; expect higher turnover. Strengths: employment A+, housing A+; Watch: crime C-, schools D+, amenities F.
- Nevada Joint Union High (town): math 25% / reading 61% proficiency, ranked #201 of 517 in CA (top 39%) — families likely to look elsewhere, expect single-tenant / working-renter base with shorter leases.
- Market conditions: 252 active listings in the ZIP; 1 comparable units currently listed for rent nearby; solid renter incomes; 215 units permitted in Nevada County in 2024 (0 in 5+ unit buildings).
Forward outlook
- Local home prices are declining (-3.0%/yr); year-one equity from $449 of loan paydown is wiped out by about $2k of value loss. Plan a longer hold.
- Nevada County population projected at -14% by 2050 — secular population decline; favor cash flow + early exit over multi-decade hold.
- At projected returns (-3.0% appreciation + 3.0% rent growth), your $18k cash investment doubles in ~2 years — after that, you're playing with house money.
Negotiation context
- It's been on market 31 days — a 3% lower offer ($63k) is reasonable based on typical stale-listing flexibility.
Risks & watch-outs
- Climate carrying-cost: severe wildfire risk; extreme-heat days projected 7→16/yr by 2055 (HVAC capex compounding) — expect insurance premiums to compound above CPI over the hold.
Questions for the listing agent
- It's been on market 31 days. Have you received any prior offers? Is the seller open to a 3% concession, seller financing, or rate buy-down credit?
- Built in 1976 — when were the roof, HVAC, electrical panel, plumbing, and water heater last replaced?
- Is there a deadline driving the sale (1031 exchange, divorce, estate, relocation)? That informs how much negotiation room exists.
- Schools are D-rated, which usually means shorter tenancies and higher turnover. Who's the typical renter profile here, and what's been the actual vacancy rate?
- What's the average days-on-market for RENTAL listings here right now (not sales)? A rising rental-DOM trend means longer vacancies and softer asking-rent achievability than the comps imply.
- What's the recent tenant-quality profile in this submarket — average credit score on applications, eviction rate, late-payment / NSF rate, and stable-employment percentage? A property-management company in the area should have these aggregated.
- How much new for-sale + rental construction is in the pipeline within 1–3 miles? Heavy new supply typically softens prices + rents 12–24 months out; constrained supply supports both.
Investment metrics
- 1% rule
- 3.43% ✓
- Cap rate
- 30.56%
- Cash-on-cash
- 86.68%
- DSCR
- 4.86
- GRM
- 2.4
CMA / ARV
- ARV (on-the-fly)
- $90,048
- Comps found
- 12
Show comp detail 12 sales within ~0.75 mi
| Address | Dist | Beds/Ba | Sqft | Sold | Price | $/sf | Match |
|---|---|---|---|---|---|---|---|
| 10150 Stone Arch Dr | 0.00mi | 2/2.0 | 1,344 (0%) | 1mo | $55,000 | $41 | 99 |
| 14821 Hidden Rock Dr #282 | 0.22mi | 2/2.0 | 1,337 (-0%) | 1mo | $89,500 | $67 | 88 |
| 10042 Grinding Rock Dr | 0.04mi | 2/2.0 | 1,440 (+7%) | 5mo | $90,000 | $63 | 82 |
| 10040 Stone Arch Dr | 0.07mi | 2/2.0 | 1,440 (+7%) | 4mo | $85,000 | $59 | 82 |
| 10131 Shamrock Lode | 0.10mi | 2/2.0 | 1,488 (+11%) | 1mo | $60,000 | $40 | 77 |
| 10086 Grinding Rock Dr #208 | 0.15mi | 2/2.0 | 1,536 (+14%) | 1mo | $75,000 | $49 | 68 |
| 10088 Dalewood Way | 0.49mi | 2/2.0 | 1,440 (+7%) | 0mo | $138,000 | $96 | 65 |
| 10046 Dalewood Way | 0.45mi | 2/2.0 | 1,440 (+7%) | 2mo | $160,000 | $111 | 65 |
| 10073 Dalewood Way | 0.49mi | 2/2.0 | 1,440 (+7%) | 1mo | $115,000 | $80 | 64 |
| 13927 Meda Dr | 0.69mi | 3/2.0 (+1) | 1,368 (+2%) | 1mo | $140,000 | $102 | 59 |
| 14969 N Country Rd | 0.49mi | 3/2.0 (+1) | 1,456 (+8%) | 1mo | $82,500 | $57 | 57 |
| 10070 Dalewood Way | 0.47mi | 2/2.0 | 1,152 (-14%) | 4mo | $130,000 | $113 | 51 |
Match score weights: distance 35% · size 25% · config 20% · recency 20%. Top-matched comps best support the ARV.
Projected returns pro-forma
-3.0% appreciation · 3.0% rent growth · sell at horizon
- IRR
- 87.2%
- Equity multiple
- 5.02×
- Total profit
- $73,230
- Equity at exit
- $9,692
- IRR
- 90.3%
- Equity multiple
- 10.44×
- Total profit
- $171,718
- Equity at exit
- $5,620
Cash invested: $18,200 (down + closing). Projections, not guarantees.
Landlord ↔ Tenant lean methodology
- Overall (STATE)
- 18 Strongly Tenant-Friendly
- State California
- 18 Strongly Tenant-Friendly · D+13
- County
- — inherits STATE
- City
- — inherits STATE
ZIP-level market 95949
- Home prices YoY
- -34.7%
- Active inventory
- 252
- Price-to-rent
- 2.4×
Monthly cashflow live
- Estimated rent
- $2,233 medium interval (Pro) →
- Mortgage (P&I)
- −$341
- Tax est. 1.5%
- −$81 /mo · $975/yr
- Insurance
- −$27
- HOA
- −$0
- Vacancy / Maint / Mgmt
- −$469
- Net cashflow
- $1,315
Break-even live
Sensitivity live
| Price | -10% $1,360 | -5% $1,337 | +0% $1,315 | +5% $1,292 | +10% $1,270 |
|---|---|---|---|---|---|
| Rent | -10% $1,138 | -5% $1,226 | +0% $1,315 | +5% $1,403 | +10% $1,491 |
| Rate | -1.0pp $1,347 | -0.5pp $1,331 | base $1,315 | +0.5pp $1,298 | +1.0pp $1,281 |
UW: 25.0% down · 7.5% · 30yr · 1.5% tax · 5.0% vac · 8.0% maint · 8.0% mgmt
Financing live
Cash to close
- Down payment
- $16,250
- Closing costs
- $1,950
- Reserves months
- —
- Total cash needed
- —
Loan-product check · same deal, 3 products live
Conventional
25% down · 7.5% · 30yr
- Down + closing
- —
- Monthly P&I
- —
- Monthly cashflow
- —
- DSCR
- —
- Eligible?
- —
Personal DTI + credit; lowest rate.
DSCR
20% down · 8.5% · 30yr
- Down + closing
- —
- Monthly P&I
- —
- Monthly cashflow
- —
- DSCR
- —
- Eligible?
- —
No personal income docs; deal must DSCR.
Hard money
10% down · 12.0% · 12mo
- Down + closing
- —
- Monthly P&I
- —
- Monthly cashflow
- —
- DSCR
- —
- Eligible?
- —
Short-term bridge; refi at stabilization.
Rent comps 1 comps
| Address | Beds | Baths | Sqft | Rent | $/sqft | DOM | Units | Dist |
|---|---|---|---|---|---|---|---|---|
| 15487 Kingsbury Cir Grass Valley, CA | 2.0 | 2.0 | 1200 | $2,000 | $1.67 | 3d | 1 | 1.28mi |
Climate risk First Street
- Flood 1/10 Low FEMA zone X (unshaded) · 0% chance over 30 yrs
- Wildfire 9/10 Extreme
- Heat 5/10 Major 7 d/yr ≥96°F today · 16 d/yr by 30 yrs out
- Wind 1/10 Low
- Air quality 10/10 Extreme 33 unhealthy d/yr today · 40 by 30 yrs out
Nearby sold comps map
Loading sold comps map…
Walkable amenities ~0.75 mi
Loading nearby amenities…
Taxation est. · year 1
- Rental income
- $26,792
- − Mortgage interest
- −$3,641
- − Property taxes
- −$975
- − Insurance
- −$325
- − Repairs & maintenance
- −$2,143
- − Management
- −$2,143
- − Depreciation
- −$1,891
- Taxable income
- $15,673
- Est. tax owed @ 24.0%
- −$3,762
- After-tax cash flow
- $12,014/yr
For passive investors: Depreciation is non-cash, so a rental often shows a tax loss while cash-flowing — sheltering income. Rental losses are passive: they offset passive income freely, and up to $25,000/yr can offset ordinary (W-2) income if you actively participate and your MAGI is under $100k (phasing out to $0 by $150k); unused losses carry forward. On sale, claimed depreciation is recaptured at up to 25%, and gains may owe capital-gains tax (a 1031 exchange can defer both). Figures are a year-1 estimate at your 24.0% rate — not tax advice; consult a CPA.
Schools (NCES district)
- District
- Nevada Joint Union High
- NCES district ID
- 0626880
- Math proficiency
- 25% ▼ -14.00%
- Reading proficiency
- 61% ▼ -7.00%
- Median HH income
- $57,336
- Composite
- 37.53/100
- National rank
- #4393
- State rank
- #201 of 517 in CA
Livability — Alta Sierra
- Score
- 59/100
- State rank
- #662
- US rank
- #20497
Category grades
Schools grade is shown separately in the Schools card above.
Census & demographics
- County
- Nevada County · 85,339 people
- Metro
- Truckee-Grass Valley, CA
- Population (ZIP)
- 20,552
- Household income
- $98,181
- Rent vs Own
- Severe rent burden
- 181.0
Population outlook (Nevada County) Hauer SSP2
- Today (2025)
- 98,490 people
- By 2030
- 97,295 · -1.2%
- By 2040
- 92,041 · -6.5%
- By 2050
- 85,164 · -13.5%
- By 2075
- 68,436 · -30.5%
- By 2100
- 49,536 · -49.7%
Race, ethnicity, and origin ACS 2023
- Neighborhood character
- Predominantly White (84%)
- Race & ethnicity
- White 84% Hispanic / Latino 8% Two or more races 8% Native American 1%
- Hispanic origin (detail)
- Mexican 6%
- Common ancestry
- Lithuanian 4% Italian 4% Slovak 2%
- Foreign-born
- 4% · Canada
- Languages at home
- 94% English-only · Spanish 3% Other Indo-European 1%
Political lean MEDSL · Nevada
- 2024 margin
- D (+12.2) · D 54.4% · R 42.1% · Other 3.5%
- 2008→2024 swing
- +6.9pp toward D · 2008: 5.3pp · 2024: 12.2pp
- All cycles
- 2024: D+12.2 2020: D+14.8 2016: D+4.5 2012: R+4.7 2008: D+5.3
Not yet ingested
- Civics
- —
Market trends
- HPI YoY
- ▼ -122.41%
- Current HPI
- 230.2373
- Rent YoY
- —
- Metro
- Truckee-Grass Valley, CA
- State GDP YoY
- ▲ 3.21%
- F500 in state
- 116
Industry mix (Fortune 500 HQ in CA)
| Industry | F500 HQs | Revenue |
|---|---|---|
| Technology | 27 | $1,492B |
|
||
| Financial Services | 3 | $174B |
|
||
| Retail | 3 | $44B |
|
||
| Insurance | 3 | $26B |
|
||
| Media / Entertainment | 2 | $115B |
|
||
| Pharmaceuticals / Biotech | 2 | $62B |
|
||
Property tax history
-44.0%/yrLatest (2021): $30 · -44.1% YoY. Source: county tax records.
Cash-flow waterfall
monthlySold comps — $/sqft
last 12 mo · ≤1 miLoading sold comps…