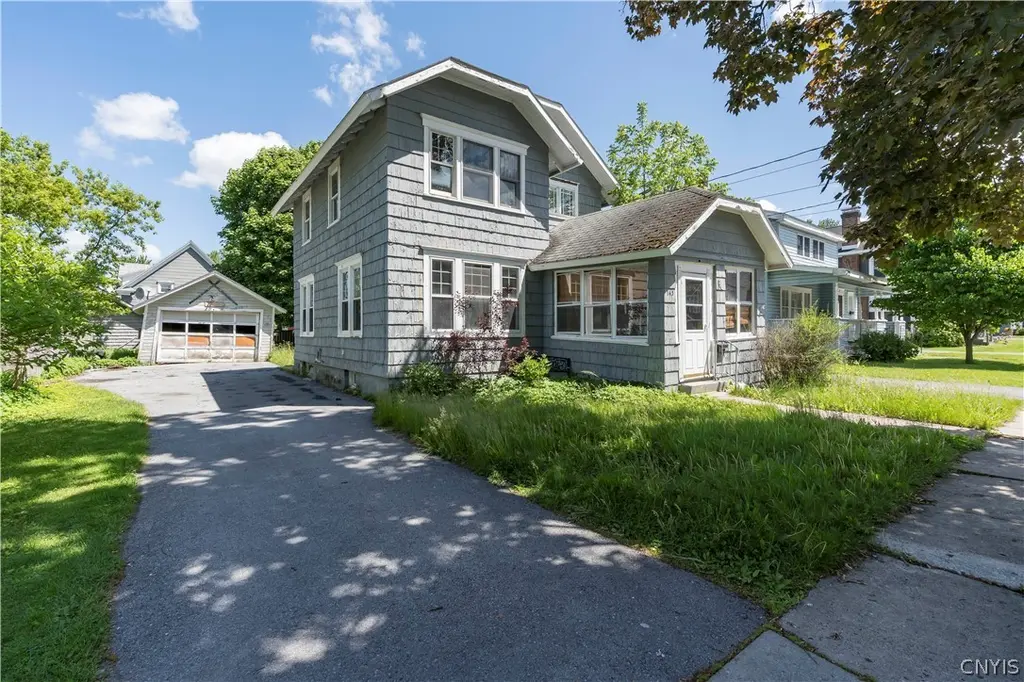
145 Ward St · Watertown, NY
Flood risk 1/10 · Minimal
- FEMA flood zone
- X
- Chance of flooding over 30 yrs
- 0.0%
- Est. flood insurance / yr
- $473 – $860
Fire risk 1/10 · Minimal
- Est. fire insurance / yr
- $691 – $1,283
Heat risk 2/10 · Minimal
- Hot days now (above 91°F)
- 7 days/yr
- Hot days in 30 yrs
- 15 days/yr
Wind risk 1/10 · Minimal
- Chance of severe wind over 30 yrs
- 0.0%
Air-quality risk 2/10 · Minimal
- Unhealthy air days now
- 1 days/yr
- Unhealthy air days in 30 yrs
- 1 days/yr
Risk factors via First Street. Map © Google.
Why this score? — see what drove the C grade
The composite is a weighted blend of 9 inputs, each scored 0–100. Each bar is that input's sub-score; the figure is the points it added to the 100-point composite (weight × sub-score).
- Cash flow +19.1/30.0
- ARV discount +15.0/15.0
- DSCR +6.0/10.0
- 1% rule +5.1/10.0
- Rent growth +5.0/5.0
- Schools +3.7/10.0
- Livability +3.4/5.0
- Condition / age +2.5/5.0
- Appreciation +0.0/10.0
$138,900
🖨 Deal sheet 📄 Offer letter ✓ Due diligence
Listing remarks MLS
A true Craftsman style home with beautiful refinished gleaming hardwood floors and original woodwork in excellent condition. French doors lead you from the foyer to the living room. Woodburning fireplace insert makes long winter nights cozy. Then on into the formal dining room and lastly the tiled kitchen with plenty of storage. Sliding doors lead out to a nice backyard and dining deck. Upstairs you'll find a beautifully remodeled bathroom with tile shower and floor and new fixtures. Master bedroom has lots of closet space. Clean dry basement and a one stall garage. Close to school & hospital
Key facts
- 5,000 sq ft lot
- Garage
- Built 1925
Property features AI
Exterior
- Parking: Detached garage; 1 garage space
- Utilities: Public water connected; Sewer connected
- Home design: Two-story residence; Existing (previously built) condition; Shake and wood siding construction
- Construction: Stone foundation
- Exterior features: Blacktop driveway; Rectangular residential lot; City street frontage; Lot dimensions approximately 50 x 100
Interior
- Kitchen: Dishwasher; Gas oven; Gas range; Refrigerator; Gas water heater
- Bedrooms: 7 total rooms (includes bedroom count within room total)
- Flooring: Ceramic tile; Hardwood; Laminate; Tile; Varies
- Bathrooms: 1 full bathroom; 1 half bathroom; One main-level bathroom
- Heating & cooling: Gas forced-air heating
- Interior features: Separate/formal dining room; Full basement
- Laundry & utility: Laundry located in basement
Neighborhood map
What this means for you Summary
Snapshot
- This is a 3-bed/1.5-bath single-family listed at $139k.
Deal economics
- At list price, monthly cash flow is $149 ($2k/yr) — positive.
- The deal already cash-flows at list — no discount required.
- Meets the 1% rule at list price ($1k rent vs $139k).
- Cap rate 7.6% vs local median 6.2% in Watertown — meaningfully above typical; check what's discounted (condition, days-on-market, listing class) to confirm the premium yield is real.
Location & tenants
- Location reads 68/100 on livability (#540 in NY) — a middle-class / working-renter tenant base. Strengths: health & safety A+, cost of living A-, housing A-; Watch: amenities C-, schools D, crime F.
- Watertown City School District (urban): math 34% / reading 54% proficiency, ranked #481 of 590 in NY (top 82%) — families likely to look elsewhere, expect single-tenant / working-renter base with shorter leases.
- Market conditions: Rents rising fast (+10.0%/yr); 223 active listings in the ZIP; 14 comparable units currently listed for rent nearby; rentals lingering (median 44d on market — plan ~5-8 weeks vacancy on turnover, expect pricing pressure); 100% of comp listings sitting > 30 days — soft ceiling on asking rent; 196 units permitted in Jefferson County in 2024 (0 in 5+ unit buildings).
Forward outlook
- Local home prices are declining (-3.0%/yr); year-one equity from $960 of loan paydown is wiped out by about $4k of value loss. Plan a longer hold.
- Jefferson County population projected at -12% by 2050 — secular population decline; favor cash flow + early exit over multi-decade hold.
- At projected returns (-3.0% appreciation + 8.0% rent growth), your $39k cash investment doubles in ~10 years — after that, you're playing with house money.
Negotiation context
- Only 3 days on market — expect competitive offers; lowballing is unlikely to land.
- 3 sale attempts since 16y ago with the ask held roughly flat each time — persistent listings suggest the price (not the market) is what's stuck; bring a comps-based counter.
Risks & watch-outs
- Watch-outs: built in 1925 — expect roof / HVAC / electrical / plumbing capex.
Questions for the listing agent
- Built in 1925 — when were the roof, HVAC, electrical panel, plumbing, and water heater last replaced?
- Is there a deadline driving the sale (1031 exchange, divorce, estate, relocation)? That informs how much negotiation room exists.
- Schools are D-rated, which usually means shorter tenancies and higher turnover. Who's the typical renter profile here, and what's been the actual vacancy rate?
- Crime grade is F in this area — have there been break-ins, vandalism, or insurance claims at this property in the last 3 years? What carrier currently insures it and at what premium?
- What's the average days-on-market for RENTAL listings here right now (not sales)? A rising rental-DOM trend means longer vacancies and softer asking-rent achievability than the comps imply.
- What's the recent tenant-quality profile in this submarket — average credit score on applications, eviction rate, late-payment / NSF rate, and stable-employment percentage? A property-management company in the area should have these aggregated.
- How much new for-sale + rental construction is in the pipeline within 1–3 miles? Heavy new supply typically softens prices + rents 12–24 months out; constrained supply supports both.
Investment metrics
- 1% rule
- 1.01% ✓
- Cap rate
- 7.58%
- Cash-on-cash
- 4.58%
- DSCR
- 1.20
- GRM
- 8.2
CMA / ARV
- ARV (on-the-fly)
- $220,320
- Comps found
- 12
Show comp detail 12 sales within ~0.75 mi
| Address | Dist | Beds/Ba | Sqft | Sold | Price | $/sf | Match |
|---|---|---|---|---|---|---|---|
| 131 Barben Ave | 0.37mi | 3/2.0 | 1,204 (-2%) | 5mo | $217,000 | $180 | 74 |
| 1 Academy Pl | 0.55mi | 3/1.5 | 1,244 (+2%) | 2mo | $85,000 | $68 | 70 |
| 181 Ward St | 0.08mi | 4/1.5 (+1) | 1,388 (+13%) | 2mo | $273,000 | $197 | 68 |
| 1304 Sherman St | 0.43mi | 3/3.0 | 1,263 (+3%) | 6mo | $235,000 | $186 | 64 |
| 1028 Holcomb St | 0.53mi | 3/2.5 | 1,298 (+6%) | 1mo | $240,000 | $185 | 60 |
| 415 Thompson Blvd | 0.66mi | 3/1.0 | 1,240 (+1%) | 6mo | $185,000 | $149 | 60 |
| 643 S Hamilton St | 0.48mi | 3/1.0 | 1,335 (+9%) | 1mo | $261,700 | $196 | 60 |
| 607 S Hamilton St | 0.54mi | 3/1.5 | 1,142 (-7%) | 4mo | $179,900 | $158 | 60 |
| 405 Brainard St | 0.52mi | 3/1.0 | 1,308 (+7%) | 4mo | $146,000 | $112 | 59 |
| 312 W Woodruff St | 0.54mi | 3/1.5 | 1,398 (+14%) | 2mo | $215,900 | $154 | 50 |
| 1398 Cosgrove St | 0.69mi | 3/1.5 | 1,116 (-9%) | 5mo | $235,000 | $211 | 49 |
| 1366 Washington St | 0.56mi | 2/1.5 (-1) | 1,107 (-10%) | 5mo | $191,000 | $173 | 49 |
Match score weights: distance 35% · size 25% · config 20% · recency 20%. Top-matched comps best support the ARV.
Projected returns pro-forma
-3.0% appreciation · 8.0% rent growth · sell at horizon
- IRR
- -3.7%
- Equity multiple
- 0.86×
- Total profit
- $-5,606
- Equity at exit
- $20,710
- IRR
- 11.0%
- Equity multiple
- 2.06×
- Total profit
- $41,152
- Equity at exit
- $12,010
Cash invested: $38,892 (down + closing). Projections, not guarantees.
Landlord ↔ Tenant lean methodology
- Overall (STATE)
- 15 Strongly Tenant-Friendly
- State New York
- 15 Strongly Tenant-Friendly · D+10
- County
- — inherits STATE
- City
- — inherits STATE
ZIP-level market 13601
- Home prices YoY
- -5.6%
- Rents YoY
- 10.0%
- Active inventory
- 223
- Price-to-rent
- 8.2×
Monthly cashflow live
- Estimated rent
- $1,404 high interval (Pro) →
- Mortgage (P&I)
- −$728
- Tax from tax record
- −$174 /mo · $2,089/yr
- Insurance
- −$58
- HOA
- −$0
- Vacancy / Maint / Mgmt
- −$295
- Net cashflow
- $149
Break-even live
UW: 25.0% down · 7.5% · 30yr · 1.5% tax · 5.0% vac · 8.0% maint · 8.0% mgmt
Financing live
Cash to close
- Down payment
- $34,725
- Closing costs
- $4,167
- Reserves months
- —
- Total cash needed
- —
Loan-product check · same deal, 3 products live
Conventional
25% down · 7.5% · 30yr
- Down + closing
- —
- Monthly P&I
- —
- Monthly cashflow
- —
- DSCR
- —
- Eligible?
- —
Personal DTI + credit; lowest rate.
DSCR
20% down · 8.5% · 30yr
- Down + closing
- —
- Monthly P&I
- —
- Monthly cashflow
- —
- DSCR
- —
- Eligible?
- —
No personal income docs; deal must DSCR.
Hard money
10% down · 12.0% · 12mo
- Down + closing
- —
- Monthly P&I
- —
- Monthly cashflow
- —
- DSCR
- —
- Eligible?
- —
Short-term bridge; refi at stabilization.
Rent comps 14 comps
| Address | Beds | Baths | Sqft | Rent | $/sqft | DOM | Units | Dist |
|---|---|---|---|---|---|---|---|---|
| 720 Cadwell St Watertown, NY | 2.0 | 1.5 | 1300 | $995 | $0.77 | 43d | 1 | 0.49mi |
| 159 Mullin St Unit 2 Watertown, NY | 2.0 | 1.0 | 900 | $1,200 | $1.33 | 43d | 1 | 0.58mi |
| 328 Clay St Unit 3 Watertown, NY | 3.0 | 2.0 | 1500 | $1,650 | $1.10 | 43d | 1 | 0.59mi |
| 816 Boyd St Unit 1 Watertown, NY | 2.0 | 1.0 | 980 | $1,500 | $1.53 | 43d | 1 | 0.82mi |
| 123 State Pl Watertown, NY | 3.0 | 1.5 | 1500 | $1,750 | $1.17 | 43d | 1 | 0.89mi |
| 2240 Kristina Park Watertown, NY | 1.0–3.0 | 1.0–2.0 | 1072 | $1,615 | $1.51 | 43d | 5 | 0.89mi |
| 911 State St Unit 3 Watertown, NY | 3.0 | 1.0 | 1200 | $995 | $0.83 | 43d | 1 | 0.94mi |
| 927 State St Watertown, NY | 2.0 | 1.0 | 900 | $1,000 | $1.11 | 43d | 1 | 0.96mi |
| 311 High St Watertown, NY | 2.0 | 1.0 | 851 | $1,200 | $1.41 | 43d | 1 | 1.07mi |
| 136 N Meadow St Unit A Watertown, NY | 2.0 | 1.0 | 1000 | $995 | $0.99 | 43d | 1 | 1.10mi |
| 1029 Gill St Watertown, NY | 3.0 | 1.0 | 1275 | $1,950 | $1.53 | 43d | 1 | 1.18mi |
| 611 Cooper St Watertown, NY | 3.0 | 1.0 | 1190 | $1,495 | $1.26 | 43d | 1 | 1.30mi |
| 109 Spring Ave Watertown, NY | 2.0 | 1.0 | 1344 | $1,200 | $0.89 | 43d | 1 | 1.45mi |
| 256 Michigan Ave Watertown, NY | 2.0–4.0 | 1.0–2.5 | 1435 | $1,440 | $1.00 | 43d | 9 | 1.50mi |
Listing history 3 events
-
2026-06-07statusdays on market $138,900 Pending 3 DOM
-
2026-06-05remarks 618-char remark
-
2026-06-05$138,900 Active 1 DOM
ⓘ Source: listings_history table (triggers on properties + properties_extension) + one-shot
backfill from property_details.listing_events for pre-trigger history.
Tax reassessment forecast NY · Partial reset (capped growth)
- Current annual tax
- $2,089 · $174/mo
- Projected year-2 tax
- $2,218 · $185/mo
- Expected delta
- +$129/yr (+$11/mo · 6.2%)
ⓘ Screening estimate from a state-policy table — verify with the county assessor before closing.
Climate risk First Street
- Flood 1/10 Low FEMA zone X · 0% chance over 30 yrs
- Wildfire 1/10 Low
- Heat 2/10 Low 7 d/yr ≥91°F today · 15 d/yr by 30 yrs out
- Wind 1/10 Low 0% chance of damaging wind over 30 yrs
- Air quality 2/10 Low 1 unhealthy d/yr today · 1 by 30 yrs out
Nearby sold comps map
Loading sold comps map…
Walkable amenities ~0.75 mi
Loading nearby amenities…
Taxation est. · year 1
- Rental income
- $16,844
- − Mortgage interest
- −$7,781
- − Property taxes
- −$2,089
- − Insurance
- −$694
- − Repairs & maintenance
- −$1,348
- − Management
- −$1,348
- − Depreciation
- −$4,041
- Taxable loss
- −$456
- Est. tax savings @ 24.0%
- +$109
- After-tax cash flow
- $1,892/yr
For passive investors: Depreciation is non-cash, so a rental often shows a tax loss while cash-flowing — sheltering income. Rental losses are passive: they offset passive income freely, and up to $25,000/yr can offset ordinary (W-2) income if you actively participate and your MAGI is under $100k (phasing out to $0 by $150k); unused losses carry forward. On sale, claimed depreciation is recaptured at up to 25%, and gains may owe capital-gains tax (a 1031 exchange can defer both). Figures are a year-1 estimate at your 24.0% rate — not tax advice; consult a CPA.
Schools (NCES district)
- District
- Watertown City School District
- NCES district ID
- 3630120
- Math proficiency
- 34% ▼ -10.00%
- Reading proficiency
- 54% ▲ 12.00%
- Median HH income
- $40,919
- Composite
- 36.86/100
- National rank
- #4551
- State rank
- #481 of 590 in NY
Livability — Watertown
- Score
- 68/100
- State rank
- #540
- US rank
- #9700
Category grades
Schools grade is shown separately in the Schools card above.
Census & demographics
- Census place
- Watertown, NY
- County
- Jefferson County · 47,417 people
- City population
- 36,839
- Metro
- Watertown-Fort Drum, NY
- Population (ZIP)
- 36,839
- Household income
- $58,791
- Rent vs Own
- Severe rent burden
- 1634.0
Population outlook (Jefferson County) Hauer SSP2
- Today (2025)
- 111,748 people
- By 2030
- 109,370 · -2.1%
- By 2040
- 103,828 · -7.1%
- By 2050
- 98,523 · -11.8%
- By 2075
- 91,422 · -18.2%
- By 2100
- 78,214 · -30.0%
Race, ethnicity, and origin ACS 2023
- Neighborhood character
- Predominantly White (82%)
- Race & ethnicity
- White 82% Two or more races 7% Hispanic / Latino 6% Black 4% Asian 2%
- Hispanic origin (detail)
- Mexican 2% Puerto Rican 2%
- Common ancestry
- Lithuanian 7% Romanian 3% Slovak 2%
- Foreign-born
- 4% · Canada
- Languages at home
- 94% English-only · Spanish 3% Other Indo-European 1% German/W. Germanic 1%
Political lean MEDSL · Jefferson
- 2024 margin
- Strong R (+23.6) · D 38.2% · R 61.8%
- 2008→2024 swing
- -18.3pp toward R · 2008: -5.3pp · 2024: -23.6pp
- All cycles
- 2024: R+23.6 2020: R+19.0 2016: R+22.4 2012: R+2.9 2008: R+5.3
Not yet ingested
- Civics
- —
Market trends
- HPI YoY
- ▼ -18.86%
- Current HPI
- 316.636
- Rent YoY
- ▲ 9.96%
- Metro
- Watertown-Fort Drum, NY
- State GDP YoY
- ▲ 2.60%
- F500 in state
- 92
Industry mix (Fortune 500 HQ in NY)
| Industry | F500 HQs | Revenue |
|---|---|---|
| Financial Services | 10 | $950B |
|
||
| Consumer Goods | 9 | $162B |
|
||
| Insurance | 4 | $225B |
|
||
| Telecommunications | 2 | $144B |
|
||
| Pharmaceuticals | 2 | $112B |
|
||
| Media / Entertainment | 2 | $69B |
|
||
Price history
-6.8% since first listed7 events — show timeline
- 2026-06-03 Listed $138,900 CNYIS
- 2014-06-13 Sold (Public Records) $172,000 Public Records
- 2014-06-13 Sold (MLS) $172,000 CNYIS
- 2013-09-11 Listed $172,000 CNYIS
- 2010-06-01 Sold (Public Records) $145,000 Public Records
- 2010-05-28 Sold (MLS) $145,000 CNYIS
- 2010-02-18 Listed $149,000 CNYIS
Property tax history
+18.7%/yrLatest (2025): $2,089 · +3.9% YoY. Source: county tax records.
Cash-flow waterfall
monthlySold comps — $/sqft
last 12 mo · ≤1 miLoading sold comps…