 Triplex
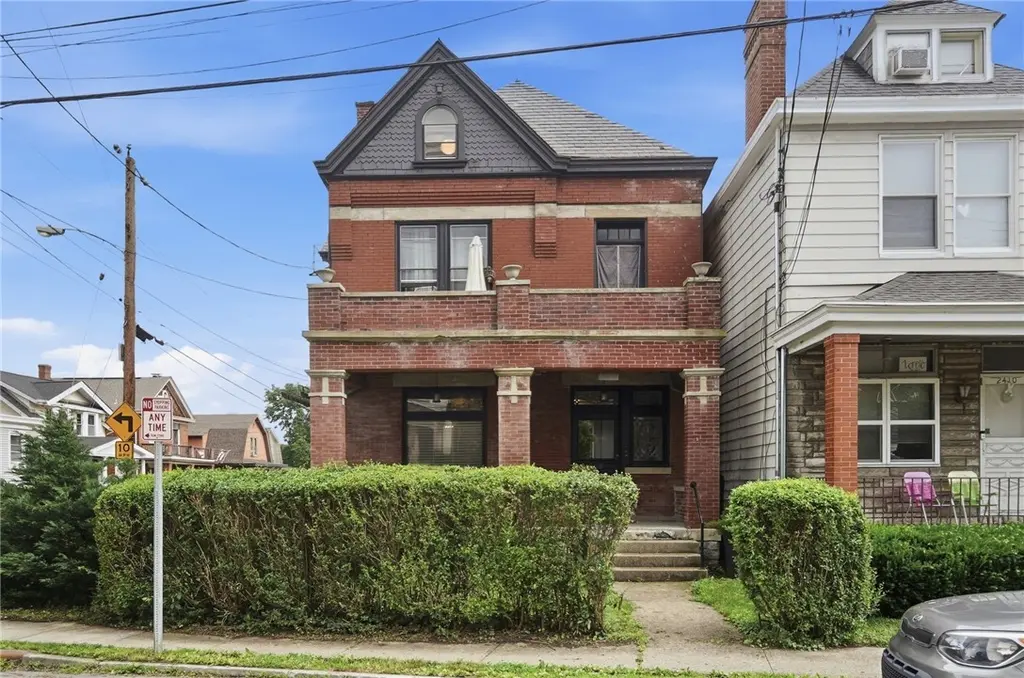
2412 Fairview Ave · Cincinnati, OH
Flood risk 1/10 · Minimal
- FEMA flood zone
- X (unshaded)
- Chance of flooding over 30 yrs
- 0.0%
- Est. flood insurance / yr
- $473 – $860
Fire risk 1/10 · Minimal
- Est. fire insurance / yr
- $713 – $1,323
Heat risk 4/10 · Minor
- Hot days now (above 103°F)
- 7 days/yr
- Hot days in 30 yrs
- 19 days/yr
Wind risk 2/10 · Minimal
- Chance of severe wind over 30 yrs
- 1.0%
Air-quality risk 3/10 · Minor
- Unhealthy air days now
- 2 days/yr
- Unhealthy air days in 30 yrs
- 3 days/yr
Risk factors via First Street. Map © Google.
Why this score? — see what drove the D+ grade
The composite is a weighted blend of 9 inputs, each scored 0–100. Each bar is that input's sub-score; the figure is the points it added to the 100-point composite (weight × sub-score).
- Cash flow +23.7/30.0
- DSCR +7.6/10.0
- 1% rule +6.0/10.0
- Livability +4.0/5.0
- Rent growth +3.0/5.0
- Schools +2.5/10.0
- Condition / age +2.5/5.0
- ARV discount +0.0/15.0
- Appreciation +0.0/10.0
$425,000
🖨 Deal sheet 📄 Offer letter ✓ Due diligence
Multi-family units
County records classify this as Multi-Family (2-4 Unit). Listing-text estimate: 3 units. confirmed
Listing remarks MLS
Investment opportunity in the heart of Clifton! This well-maintained three-family property offers the perfect blend of location, flexibility, and long-term potential while still maintaining the beautiful character and charm Clifton is known for, complete with natural woodwork throughout. Each of the three units features 2 bedrooms with separate utilities, making management simple and appealing for both investors and owner-occupants alike. Two of the units have been updated with newer kitchens, adding modern style and value where it counts. Positioned just minutes from University of Cincinnati, local hospitals, dining, shopping, and entertainment, this property is ideal for those looking to expand their portfolio or secure housing in a highly desirable rental area. Whether you’re searching for a smart income-producing property or exploring an alternative to campus-area renting, this is an opportunity you won’t want to miss.
Key facts
- Natural woodwork
- Newer kitchens
- 3,267 sq ft lot
Tags
Property features AI
Finance
- Other: Zoned for multi-family
- Financial info: Property has 3 rental units; Typical 2-bedroom rent listed at $1,300; Unit 2 currently listed at $1,300; Second-floor lease expires in September
- HOA & community: No HOA information provided
Exterior
- Parking: On-street parking
- Security: No security details provided
- Utilities: Public water; Public sewer; Natural gas
- Home design: Triplex; Three or more levels; Stone foundation; Slate roof; Brick construction
- Construction: Stone foundation; Brick exterior; Slate roof
- Exterior features: Patio; Porch; Balcony; Corner lot
Interior
- Kitchen: No appliance details provided
- Bedrooms: Three 2-bedroom units (each unit has 2 bedrooms)
- Flooring: No flooring details provided
- Bathrooms: Each unit has one full bathroom
- Heating & cooling: Forced air heating (gas); Central air conditioning; Separate furnaces and separate A/C for units; Separate gas and electric for units; Heat paid by tenants; water paid by owner
- Interior features: Full basement; Coin laundry; Three fireplaces (currently inoperable)
- Laundry & utility: Coin laundry on site
Neighborhood map
What this means for you Summary
Snapshot
- This is a 3 × 2-bed/1.0-bath units multifamily listed at $425k.
Deal economics
- At list price, monthly cash flow is $812 ($10k/yr) — positive. Per door: $271/mo.
- The deal already cash-flows at list — no discount required.
- Meets the 1% rule at list price ($5k rent vs $425k).
- Recommended offer: $419k (1.5% below list) — sets the bar for market timing.
- Cap rate 8.6% vs local median 3.9% in Cincinnati — top-decile yield for the area; either an underpriced asset or a hidden risk that comps aren't pricing in. Stress-test before assuming the spread holds.
Location & tenants
- Location reads 80/100 on livability (#130 in OH, #1,856 nationally) — a professional / high-income tenant draw. Strengths: amenities A+, commute A+, cost of living A+; Watch: employment D, crime F.
- Cincinnati Public Schools (urban): math 25% / reading 36% proficiency, ranked #581 of 656 in OH (top 89%) — families likely to look elsewhere, expect single-tenant / working-renter base with shorter leases; 70% free/reduced lunch — lower-income household profile, screen leases tightly.
- Market conditions: Rents rising (+2.1%/yr); 71 active listings in the ZIP; 20 comparable units currently listed for rent nearby; rentals at typical pace (median 14d on market — plan ~3-4 weeks tenant-placement turnaround); lower-income renter base — watch delinquency; 801 units permitted in Hamilton County in 2024 (190 in 5+ unit buildings).
- At $4,685/mo this rent would consume 158% of the median local household income ($36k/yr) (locally 2461% of renters already pay >50% of income on rent) — very limited rent-growth headroom before tenants either downsize or default.
Forward outlook
- Local home prices are declining (-3.0%/yr); year-one equity from $3k of loan paydown is wiped out by about $13k of value loss. Plan a longer hold.
Negotiation context
- It's been on market 20 days — a 2% lower offer ($419k) is reasonable based on typical stale-listing flexibility.
- 4 sale attempts since 10y ago with the ask held roughly flat each time — persistent listings suggest the price (not the market) is what's stuck; bring a comps-based counter.
- Current owner paid $153k; list at $425k implies a 178% gain — meaningful room to come down on a strong offer.
Risks & watch-outs
- Watch-outs: built in 1905 — expect roof / HVAC / electrical / plumbing capex.
Questions for the listing agent
- Can we see the unit-by-unit rent roll, current vacancy, and any below-market leases? What's the average tenancy length?
- What capital expenditures (roof, boiler, parking lot, exteriors) have been made in the last 5 years, and what's planned in the next 2?
- Built in 1905 — when were the roof, HVAC, electrical panel, plumbing, and water heater last replaced?
- Is there a deadline driving the sale (1031 exchange, divorce, estate, relocation)? That informs how much negotiation room exists.
- Schools are B-rated — typically a magnet for longer-tenancy family renters. What's the average tenant stay here, and is there a school-zone premium baked into asking?
- Crime grade is F in this area — have there been break-ins, vandalism, or insurance claims at this property in the last 3 years? What carrier currently insures it and at what premium?
- The area grade is low — what's the realistic commute time and amenity access for the typical tenant pool here? Any planned neighborhood developments (good or bad) we should know about?
- What's the average days-on-market for RENTAL listings here right now (not sales)? A rising rental-DOM trend means longer vacancies and softer asking-rent achievability than the comps imply.
- What's the recent tenant-quality profile in this submarket — average credit score on applications, eviction rate, late-payment / NSF rate, and stable-employment percentage? A property-management company in the area should have these aggregated.
- How much new apartment / multifamily construction is in the pipeline within 1–3 miles? Heavy new supply (>2% of stock underway) typically softens rents 12–24 months out; light construction supports rent growth.
Investment metrics
- 1% rule
- 1.10% ✓
- Cap rate
- 8.59%
- Cash-on-cash
- 8.19%
- DSCR
- 1.36
- GRM
- 7.6
CMA / ARV
- ARV (on-the-fly)
- $361,194
- Comps found
- 6
Show comp detail 6 sales within ~0.75 mi
| Address | Dist | Beds/Ba | Sqft | Sold | Price | $/sf | Match |
|---|---|---|---|---|---|---|---|
| 447 Warner St | 0.14mi | 4/4.0 | 2,958 (-9%) | 4mo | $360,000 | $122 | 67 |
| 316 Emming St | 0.33mi | 4/3.0 | 2,941 (-10%) | 12mo | $310,000 | $105 | 55 |
| 1 Foxhall Ct | 0.08mi | 4/4.5 | 3,000 (-8%) | 23mo | $332,500 | $111 | 54 |
| 458 W Mcmicken Ave | 0.36mi | 3/2.0 (-1) | 2,832 (-13%) | 11mo | $215,000 | $76 | 48 |
| 2232 Flora St | 0.29mi | 5/3.0 (+1) | 2,844 (-13%) | 13mo | $290,000 | $102 | 45 |
| 502 Riddle Rd | 0.64mi | 5/3.0 (+1) | 2,949 (-9%) | 6mo | $475,000 | $161 | 41 |
Match score weights: distance 35% · size 25% · config 20% · recency 20%. Top-matched comps best support the ARV.
Projected returns pro-forma
-3.0% appreciation · 2.07% rent growth · sell at horizon
- IRR
- -4.9%
- Equity multiple
- 0.82×
- Total profit
- $-21,434
- Equity at exit
- $63,369
- IRR
- 3.7%
- Equity multiple
- 1.26×
- Total profit
- $30,627
- Equity at exit
- $36,746
Cash invested: $119,000 (down + closing). Projections, not guarantees.
Landlord ↔ Tenant lean methodology
- Overall (STATE)
- 73 Landlord-Friendly
- State Ohio
- 73 Landlord-Friendly · R+6
- County
- — inherits STATE
- City
- — inherits STATE
ZIP-level market 45219
- Home prices YoY
- -28.3%
- Rents YoY
- 2.1%
- Active inventory
- 71
- Price-to-rent
- 22.7×
Monthly cashflow live
- Estimated rent
- $4,685 high interval (Pro) →
- Mortgage (P&I)
- −$2,229
- Tax from tax record
- −$483 /mo · $5,796/yr
- Insurance
- −$177
- HOA
- −$0
- Vacancy / Maint / Mgmt
- −$984
- Net cashflow
- $812
Break-even live
3-unit breakdown (identical units grouped — click to expand)
| Units | Beds | Baths | Est. rent |
|---|---|---|---|
| 3× units | 2 | 1 | $4,686 |
| #1 | 2 | 1 | $1,562 |
| #2 | 2 | 1 | $1,562 |
| #3 | 2 | 1 | $1,562 |
| Total (3 units) | $4,685 | ||
UW: 25.0% down · 7.5% · 30yr · 1.5% tax · 5.0% vac · 8.0% maint · 8.0% mgmt
Financing live
Cash to close
- Down payment
- $106,250
- Closing costs
- $12,750
- Reserves months
- —
- Total cash needed
- —
Loan-product check · same deal, 3 products live
Conventional
25% down · 7.5% · 30yr
- Down + closing
- —
- Monthly P&I
- —
- Monthly cashflow
- —
- DSCR
- —
- Eligible?
- —
Personal DTI + credit; lowest rate.
DSCR
20% down · 8.5% · 30yr
- Down + closing
- —
- Monthly P&I
- —
- Monthly cashflow
- —
- DSCR
- —
- Eligible?
- —
No personal income docs; deal must DSCR.
Hard money
10% down · 12.0% · 12mo
- Down + closing
- —
- Monthly P&I
- —
- Monthly cashflow
- —
- DSCR
- —
- Eligible?
- —
Short-term bridge; refi at stabilization.
Rent comps 20 comps
| Address | Beds | Baths | Sqft | Rent | $/sqft | DOM | Units | Dist |
|---|---|---|---|---|---|---|---|---|
| 2421 Fairview Ave Cincinnati, OH | 5.0 | 2.0 | 2400 | $3,300 | $1.38 | 23d | 1 | 0.04mi |
| 2317 Chickasaw St Cincinnati, OH | 5.0 | 2.0 | 2826 | $2,750 | $0.97 | 14d | 1 | 0.31mi |
| 2017 Elm St Unit 1056145P Cincinnati, OH | 5.0 | 2.0 | 3939 | $7,694 | $1.95 | 12d | 1 | 0.73mi |
| 107 E Clifton Ave Unit 1234537P Cincinnati, OH | 2.0–3.0 | 1.0–2.0 | 2260 | $6,619 | $2.93 | 14d | 2 | 0.74mi |
| 55 Mulberry St Cincinnati, OH | 3.0 | 3.0 | 2500 | $3,500 | $1.40 | 23d | 1 | 0.90mi |
| 122 W Elder St Unit 1056110P Cincinnati, OH | 5.0 | 3.0 | 3444 | $7,875 | $2.29 | 1d | 1 | 0.92mi |
| 111 W Elder St Unit 1056044P Cincinnati, OH | 1.0–4.0 | 1.0–4.0 | 1835 | $7,140 | $3.89 | 10d | 2 | 0.96mi |
| 2800 Jefferson Ave Cincinnati, OH | 4.0 | 2.0 | 2500 | $625 | $0.25 | 19d | 1 | 0.98mi |
| 1610 Pleasant St Unit 1056041P Cincinnati, OH | 3.0–4.0 | 2.0–3.0 | 2960 | $7,037 | $2.38 | 10d | 2 | 1.06mi |
| 1537 Republic St Unit 1058850P Cincinnati, OH | 4.0 | 3.0 | 2421 | $10,677 | $4.41 | 21d | 1 | 1.15mi |
| 328 Mulberry St Cincinnati, OH | 3.0 | 3.5 | 2640 | $5,500 | $2.08 | 23d | 1 | 1.23mi |
| 328 Mulberry St Cincinnati, OH | 3.0 | 3.5 | 2640 | $5,500 | $2.08 | 14d | 1 | 1.23mi |
| 1424 Pleasant St Unit 1056038P Cincinnati, OH | 4.0 | 3.0 | 2960 | $7,167 | $2.42 | 14d | 1 | 1.23mi |
| 21 E 15th St Unit 1512946P Cincinnati, OH | 3.0 | 2.0 | 2852 | $12,830 | $4.50 | 23d | 1 | 1.25mi |
| 3476 Cornell Pl Cincinnati, OH | 5.0 | 2.5 | 2930 | $3,095 | $1.06 | 4d | 1 | 1.39mi |
| 242 Stetson St Unit NA Cincinnati, OH | 3.0 | 2.5 | 2300 | $3,500 | $1.52 | 21d | 1 | 1.40mi |
| 120 E 13th St Unit 1056091P Cincinnati, OH | 4.0 | 2.0 | 3229 | $10,667 | $3.30 | 21d | 1 | 1.44mi |
| 2105 Burnet Ave Unit 1056017P Cincinnati, OH | 4.0 | 2.0 | 2960 | $7,384 | $2.49 | 1d | 1 | 1.44mi |
| 1354 Broadway Unit 1056136P Cincinnati, OH | 4.0 | 3.0 | 2529 | $7,307 | $2.89 | 2d | 1 | 1.45mi |
| 126 E 13th St Unit 1056025P Cincinnati, OH | 5.0 | 4.0 | 2960 | $5,339 | $1.80 | 2d | 1 | 1.45mi |
Listing history 13 events
-
2026-06-18days on market $425,000 Active 20 DOM
-
2026-06-17days on market $425,000 Active 19 DOM
-
2026-06-16days on market $425,000 Active 18 DOM
-
2026-06-15days on market $425,000 Active 17 DOM
-
2026-06-13days on market $425,000 Active 15 DOM
-
2026-06-13statusdays on market $425,000 Active 14 DOM
-
2026-06-09days on market $425,000 Contingency Pending 11 DOM
-
2026-06-08days on market $425,000 Contingency Pending 10 DOM
-
2026-06-07days on market $425,000 Contingency Pending 9 DOM
-
2026-06-03days on market $425,000 Contingency Pending 5 DOM
-
2026-06-02statusdays on market $425,000 Contingency Pending 4 DOM
-
2026-06-01days on market $425,000 Active 3 DOM
-
2026-05-31days on market $425,000 Active 2 DOM
ⓘ Source: listings_history table (triggers on properties + properties_extension) + one-shot
backfill from property_details.listing_events for pre-trigger history.
Tax reassessment forecast OH · Partial reset (capped growth)
- Current annual tax
- $5,796 · $483/mo
- Projected year-2 tax
- $6,213 · $518/mo
- Expected delta
- +$417/yr (+$35/mo · 7.2%)
ⓘ Screening estimate from a state-policy table — verify with the county assessor before closing.
Climate risk First Street
- Flood 1/10 Low FEMA zone X (unshaded) · 0% chance over 30 yrs
- Wildfire 1/10 Low
- Heat 4/10 Moderate 7 d/yr ≥103°F today · 19 d/yr by 30 yrs out
- Wind 2/10 Low 100% chance of damaging wind over 30 yrs
- Air quality 3/10 Moderate 2 unhealthy d/yr today · 3 by 30 yrs out
Nearby sold comps map
Loading sold comps map…
Walkable amenities ~0.75 mi
Loading nearby amenities…
Taxation est. · year 1
- Rental income
- $56,220
- − Mortgage interest
- −$23,807
- − Property taxes
- −$5,796
- − Insurance
- −$2,125
- − Repairs & maintenance
- −$4,498
- − Management
- −$4,498
- − Depreciation
- −$12,364
- Taxable income
- $3,133
- Est. tax owed @ 24.0%
- −$752
- After-tax cash flow
- $8,996/yr
For passive investors: Depreciation is non-cash, so a rental often shows a tax loss while cash-flowing — sheltering income. Rental losses are passive: they offset passive income freely, and up to $25,000/yr can offset ordinary (W-2) income if you actively participate and your MAGI is under $100k (phasing out to $0 by $150k); unused losses carry forward. On sale, claimed depreciation is recaptured at up to 25%, and gains may owe capital-gains tax (a 1031 exchange can defer both). Figures are a year-1 estimate at your 24.0% rate — not tax advice; consult a CPA.
Schools (NCES district)
- District
- Cincinnati Public Schools
- NCES district ID
- 3904375
- Math proficiency
- 25% ▼ -19.00%
- Reading proficiency
- 36% ▼ -14.00%
- Median HH income
- $35,743
- Composite
- 25.21/100
- National rank
- #7508
- State rank
- #581 of 656 in OH
Livability — Cincinnati
- Score
- 80/100
- State rank
- #130
- US rank
- #1856
Category grades
Schools grade is shown separately in the Schools card above.
Census & demographics
- Census place
- Cincinnati, OH
- County
- Hamilton County · 701,295 people
- City population
- 505,555
- Metro
- Cincinnati, OH-KY-IN
- Population (ZIP)
- 20,012
- Household income
- $35,657
- Rent vs Own
- Severe rent burden
- 2461.0
Population outlook (Hamilton County) Hauer SSP2
- Today (2025)
- 826,054 people
- By 2030
- 830,947 · +0.6%
- By 2040
- 832,319 · +0.8%
- By 2050
- 822,428 · -0.4%
- By 2075
- 788,688 · -4.5%
- By 2100
- 710,674 · -14.0%
Race, ethnicity, and origin ACS 2023
- Neighborhood character
- Predominantly White (67%)
- Race & ethnicity
- White 67% Black 16% Asian 7% Two or more races 6% Hispanic / Latino 4%
- Common ancestry
- Romanian 3% Italian 2% Slovak 1%
- Foreign-born
- 10% · China, Canada
- Languages at home
- 88% English-only · Chinese 3% Spanish 2% Other Indo-European 2%
Political lean MEDSL · Hamilton
- 2024 margin
- D (+14.9) · D 57.0% · R 42.1%
- 2008→2024 swing
- +7.9pp toward D · 2008: 7.0pp · 2024: 14.9pp
- All cycles
- 2024: D+14.9 2020: D+15.9 2016: D+9.5 2012: D+4.9 2008: D+7.0
Not yet ingested
- Civics
- —
Market trends
- HPI YoY
- ▼ -134.46%
- Current HPI
- 340.1262
- Rent YoY
- ▲ 2.07%
- Metro
- Cincinnati, OH-KY-IN
- State GDP YoY
- ▲ 1.98%
- F500 in state
- 48
Industry mix (Fortune 500 HQ in OH)
| Industry | F500 HQs | Revenue |
|---|---|---|
| Insurance | 3 | $145B |
|
||
| Industrial Machinery | 3 | $49B |
|
||
| Financial Services | 3 | $24B |
|
||
| Consumer Goods | 2 | $93B |
|
||
| Aerospace / Defense | 2 | $47B |
|
||
| Utilities | 2 | $33B |
|
||
Price history
+347.4% since first listed10 events — show timeline
- 2026-05-29 Listed $425,000 Dayton MLS
- 2026-05-28 Listed $425,000 Cincy MLS
- 2024-02-28 Rental Removed $1,200 CINCYMLS
- 2024-01-15 Listed for Rent $1,200 CINCYMLS
- 2016-10-17 Sold (MLS) $153,000 Cincy MLS
- 2016-08-09 Contingent — Cincy MLS
- 2016-07-11 Price Changed $179,900 Cincy MLS
- 2016-04-29 Listed $189,900 Cincy MLS
- 2002-04-08 Sold (Public Records) $75,000 Public Records
- 1994-09-23 Sold (Public Records) $95,000 Public Records
Property tax history
+5.1%/yrLatest (2025): $5,796 · +0.1% YoY. Source: county tax records.
Cash-flow waterfall
monthlySold comps — $/sqft
last 12 mo · ≤1 miLoading sold comps…