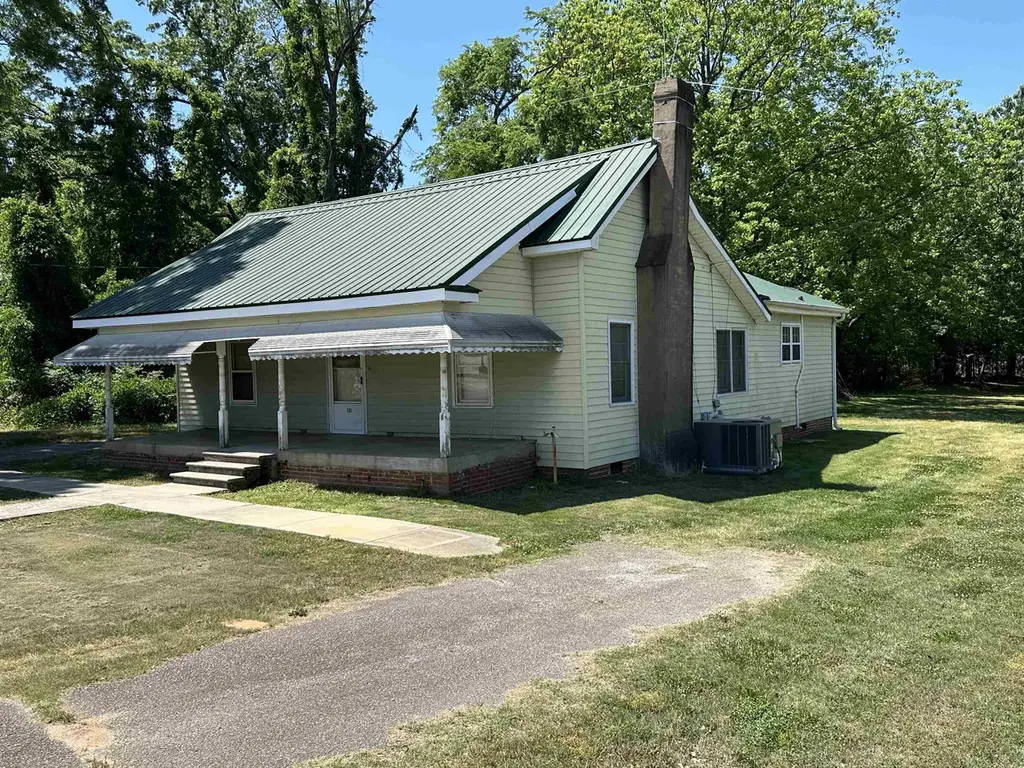
131 Church St · Pacolet, SC
Flood risk 1/10 · Minimal
- FEMA flood zone
- X (unshaded)
- Chance of flooding over 30 yrs
- 0.0%
- Est. flood insurance / yr
- $507 – $1,088
Fire risk 4/10 · Minor
- Est. fire insurance / yr
- $783 – $1,453
Heat risk 6/10 · Moderate
- Hot days now (above 105°F)
- 7 days/yr
- Hot days in 30 yrs
- 16 days/yr
Wind risk 3/10 · Minor
- Chance of severe wind over 30 yrs
- 4.0%
Air-quality risk 4/10 · Minor
- Unhealthy air days now
- 4 days/yr
- Unhealthy air days in 30 yrs
- 4 days/yr
Risk factors via First Street. Map © Google.
Why this score? — see what drove the B- grade
The composite is a weighted blend of 9 inputs, each scored 0–100. Each bar is that input's sub-score; the figure is the points it added to the 100-point composite (weight × sub-score).
- Cash flow +26.4/30.0
- ARV discount +15.0/15.0
- DSCR +9.0/10.0
- 1% rule +6.1/10.0
- Schools +3.7/10.0
- Livability +3.5/5.0
- Rent growth +2.5/5.0
- Condition / age +2.5/5.0
- Appreciation +0.0/10.0
$99,900
🖨 Deal sheet 📄 Offer letter ✓ Due diligence
Listing remarks MLS
Home for sale
Key facts
- 0.68 acre lot
- 2 garage spots
- Built 1897
Neighborhood map
What this means for you Summary
Snapshot
- This is a 2-bed/1.0-bath single-family listed at $100k.
Deal economics
- At list price, monthly cash flow is $260 ($3k/yr) — positive.
- The deal already cash-flows at list — no discount required.
- Meets the 1% rule at list price ($1k rent vs $100k).
- Cap rate 9.4% vs local median 3.4% in Pacolet — top-decile yield for the area; either an underpriced asset or a hidden risk that comps aren't pricing in. Stress-test before assuming the spread holds.
Location & tenants
- Location reads 69/100 on livability (#69 in SC) — a middle-class / working-renter tenant base. Strengths: cost of living A+, housing A+; Watch: employment D, amenities F, commute F.
- Spartanburg 03 (suburban): math 39% / reading 49% proficiency, ranked #28 of 80 in SC (top 35%) — families likely to look elsewhere, expect single-tenant / working-renter base with shorter leases.
- Zoned schools: Clifdale Middle (695 students, 78% FRL); Broome High (math 42% / reading 80%, grade C+, #105 of 196 statewide, top 54%, 825 students, 68% FRL) — zoned schools average 73% FRL vs 57% district-wide (16 pts higher); higher-poverty schools than district average — tighter screening recommended.
- Zoned-school proficiency averages 61% at this address vs 44% district-wide (+17 pts) — the actual schools serving this property are materially stronger than the Spartanburg 03 average implies; a family-tenant draw the district grade alone would hide.
- Market conditions: 40 active listings in the ZIP; 3,129 units permitted in Spartanburg County in 2024 (40 in 5+ unit buildings).
Forward outlook
- Local home prices are declining (-3.0%/yr); year-one equity from $691 of loan paydown is wiped out by about $3k of value loss. Plan a longer hold.
- Spartanburg County population projected at +18% by 2050 — long-run rental-demand tailwind backs the buy-and-hold thesis.
- At projected returns (-3.0% appreciation + 3.0% rent growth), your $28k cash investment doubles in ~10 years — after that, you're playing with house money.
Negotiation context
- Only 5 days on market — expect competitive offers; lowballing is unlikely to land.
- 3 sale attempts with the ask held roughly flat each time — persistent listings suggest the price (not the market) is what's stuck; bring a comps-based counter.
- Current owner paid $73k; 37% above their basis — modest negotiation headroom, anchor on the comps not their cost.
Risks & watch-outs
- Watch-outs: built in 1897 — expect roof / HVAC / electrical / plumbing capex.
- Climate carrying-cost: extreme-heat days projected 7→16/yr by 2055 (HVAC capex compounding) — expect insurance premiums to compound above CPI over the hold.
Questions for the listing agent
- Built in 1897 — when were the roof, HVAC, electrical panel, plumbing, and water heater last replaced?
- Is there a deadline driving the sale (1031 exchange, divorce, estate, relocation)? That informs how much negotiation room exists.
- Schools are F-rated, which usually means shorter tenancies and higher turnover. Who's the typical renter profile here, and what's been the actual vacancy rate?
- What's the average days-on-market for RENTAL listings here right now (not sales)? A rising rental-DOM trend means longer vacancies and softer asking-rent achievability than the comps imply.
- What's the recent tenant-quality profile in this submarket — average credit score on applications, eviction rate, late-payment / NSF rate, and stable-employment percentage? A property-management company in the area should have these aggregated.
- How much new for-sale + rental construction is in the pipeline within 1–3 miles? Heavy new supply typically softens prices + rents 12–24 months out; constrained supply supports both.
Investment metrics
- 1% rule
- 1.11% ✓
- Cap rate
- 9.42%
- Cash-on-cash
- 11.16%
- DSCR
- 1.50
- GRM
- 7.5
CMA / ARV
- ARV (on-the-fly)
- $173,568
- Comps found
- 5
Show comp detail 5 sales within ~0.75 mi
| Address | Dist | Beds/Ba | Sqft | Sold | Price | $/sf | Match |
|---|---|---|---|---|---|---|---|
| 131 Church St | 0.00mi | 3/1.0 (+1) | 1,536 (0%) | 0mo | $105,900 | $69 | 95 |
| 540 W Main St | 0.43mi | 2/1.0 | 1,575 (+2%) | 6mo | $173,000 | $110 | 70 |
| 221 Hillbrook Cir Cir | 0.26mi | 3/3.0 (+1) | 1,590 (+4%) | 3mo | $242,000 | $152 | 66 |
| 170 Sunset Dr | 0.33mi | 3/1.5 (+1) | 1,333 (-13%) | 9mo | $150,000 | $113 | 48 |
| 330 Sunset | 0.51mi | 3/2.0 (+1) | 1,385 (-10%) | 21mo | $250,000 | $181 | 33 |
Match score weights: distance 35% · size 25% · config 20% · recency 20%. Top-matched comps best support the ARV.
Projected returns pro-forma
-3.0% appreciation · 3.0% rent growth · sell at horizon
- IRR
- 0.3%
- Equity multiple
- 1.01×
- Total profit
- $354
- Equity at exit
- $14,895
- IRR
- 10.0%
- Equity multiple
- 1.77×
- Total profit
- $21,522
- Equity at exit
- $8,638
Cash invested: $27,972 (down + closing). Projections, not guarantees.
Landlord ↔ Tenant lean methodology
- Overall (STATE)
- 90 Strongly Landlord-Friendly
- State South Carolina
- 90 Strongly Landlord-Friendly · R+6
- County
- — inherits STATE
- City
- — inherits STATE
ZIP-level market 29372
- Home prices YoY
- -12.1%
- Active inventory
- 40
- Price-to-rent
- 7.5×
Monthly cashflow live
- Estimated rent
- $1,104 medium interval (Pro) →
- Mortgage (P&I)
- −$524
- Tax from tax record
- −$47 /mo · $560/yr
- Insurance
- −$42
- HOA
- −$0
- Vacancy / Maint / Mgmt
- −$232
- Net cashflow
- $260
Break-even live
UW: 25.0% down · 7.5% · 30yr · 1.5% tax · 5.0% vac · 8.0% maint · 8.0% mgmt
Financing live
Cash to close
- Down payment
- $24,975
- Closing costs
- $2,997
- Reserves months
- —
- Total cash needed
- —
Loan-product check · same deal, 3 products live
Conventional
25% down · 7.5% · 30yr
- Down + closing
- —
- Monthly P&I
- —
- Monthly cashflow
- —
- DSCR
- —
- Eligible?
- —
Personal DTI + credit; lowest rate.
DSCR
20% down · 8.5% · 30yr
- Down + closing
- —
- Monthly P&I
- —
- Monthly cashflow
- —
- DSCR
- —
- Eligible?
- —
No personal income docs; deal must DSCR.
Hard money
10% down · 12.0% · 12mo
- Down + closing
- —
- Monthly P&I
- —
- Monthly cashflow
- —
- DSCR
- —
- Eligible?
- —
Short-term bridge; refi at stabilization.
Listing history 10 events
-
2026-04-28status Pending
-
2026-04-23$99,900 Active
-
2026-03-16price $110,000
-
2026-02-12price $120,000
-
2026-01-27price $125,000
-
2025-12-19$135,000 Active
-
2025-09-04soldstatus $73,000
-
2025-08-18soldstatus $73,000 Closed 13-char remark
Show marketing remark (13 chars)
Home for sale
-
2025-08-04status Pending 13-char remark
Show marketing remark (13 chars)
Home for sale
-
2025-08-04$73,000 Active 13-char remark
Show marketing remark (13 chars)
Home for sale
ⓘ Source: listings_history table (triggers on properties + properties_extension) + one-shot
backfill from property_details.listing_events for pre-trigger history.
Tax reassessment forecast SC · Resets to sale price
- Current annual tax
- $560 · $47/mo
- Projected year-2 tax
- $569 · $47/mo
- Expected delta
- +$10/yr (+$1/mo · 1.7%)
ⓘ Screening estimate from a state-policy table — verify with the county assessor before closing.
Climate risk First Street
- Flood 1/10 Low FEMA zone X (unshaded) · 0% chance over 30 yrs
- Wildfire 4/10 Moderate
- Heat 6/10 Major 7 d/yr ≥105°F today · 16 d/yr by 30 yrs out
- Wind 3/10 Moderate 4% chance of damaging wind over 30 yrs
- Air quality 4/10 Moderate 4 unhealthy d/yr today · 4 by 30 yrs out
Nearby sold comps map
Loading sold comps map…
Walkable amenities ~0.75 mi
Loading nearby amenities…
Taxation est. · year 1
- Rental income
- $13,251
- − Mortgage interest
- −$5,596
- − Property taxes
- −$560
- − Insurance
- −$500
- − Repairs & maintenance
- −$1,060
- − Management
- −$1,060
- − Depreciation
- −$2,906
- Taxable income
- $1,570
- Est. tax owed @ 24.0%
- −$377
- After-tax cash flow
- $2,746/yr
For passive investors: Depreciation is non-cash, so a rental often shows a tax loss while cash-flowing — sheltering income. Rental losses are passive: they offset passive income freely, and up to $25,000/yr can offset ordinary (W-2) income if you actively participate and your MAGI is under $100k (phasing out to $0 by $150k); unused losses carry forward. On sale, claimed depreciation is recaptured at up to 25%, and gains may owe capital-gains tax (a 1031 exchange can defer both). Figures are a year-1 estimate at your 24.0% rate — not tax advice; consult a CPA.
Schools (NCES district)
- District
- Spartanburg 03
- NCES district ID
- 4503540
- Math proficiency
- 39% ▼ -5.00%
- Reading proficiency
- 49% ▲ 6.00%
- Median HH income
- $36,898
- Composite
- 36.52/100
- National rank
- #4645
- State rank
- #28 of 80 in SC
Livability — Pacolet
- Score
- 69/100
- State rank
- #69
- US rank
- #8417
Category grades
Schools grade is shown separately in the Schools card above.
Census & demographics
- Census place
- Pacolet, SC
- City population
- 293
- Population (ZIP)
- 3,440
Population outlook (Spartanburg County) Hauer SSP2
- Today (2025)
- 325,495 people
- By 2030
- 338,800 · +4.1%
- By 2040
- 363,471 · +11.7%
- By 2050
- 384,156 · +18.0%
- By 2075
- 430,137 · +32.1%
- By 2100
- 442,733 · +36.0%
Race, ethnicity, and origin ACS 2023
- Neighborhood character
- Predominantly White (79%)
- Race & ethnicity
- White 79% Black 16% Hispanic / Latino 3% Two or more races 2%
- Common ancestry
- Lithuanian 1% Slovak 1% Iranian 1%
- Foreign-born
- 2% · Canada
- Languages at home
- 95% English-only · Spanish 4% German/W. Germanic 1%
Political lean MEDSL · Spartanburg
- 2024 margin
- Solid R (+33.6) · D 32.6% · R 66.2% · Other 1.2%
- 2008→2024 swing
- -12.0pp toward R · 2008: -21.6pp · 2024: -33.6pp
- All cycles
- 2024: R+33.6 2020: R+27.3 2016: R+30.0 2012: R+23.1 2008: R+21.6
Not yet ingested
- Civics
- —
Market trends
- HPI YoY
- ▼ -30.46%
- Current HPI
- 222.0245
- Rent YoY
- —
- Metro
- —
- State GDP YoY
- ▲ 4.51%
- F500 in state
- 2
Industry mix (Fortune 500 HQ in SC)
| Industry | F500 HQs | Revenue |
|---|---|---|
| Packaging | 1 | $7B |
|
||
Price history
+36.8% since first listed10 events — show timeline
- 2026-04-28 Pending — SPMLS
- 2026-04-23 Listed $99,900 SPMLS
- 2026-03-16 Price Changed $110,000 SPMLS
- 2026-02-12 Price Changed $120,000 SPMLS
- 2026-01-27 Price Changed $125,000 SPMLS
- 2025-12-19 Listed $135,000 SPMLS
- 2025-09-04 Sold (Public Records) $73,000 Public Records
- 2025-08-18 Sold (MLS) $73,000 SPMLS
- 2025-08-04 Pending — SPMLS
- 2025-08-04 Listed $73,000 SPMLS
Property tax history
+17.8%/yrLatest (2025): $560 · +67.4% YoY. Source: county tax records.
Cash-flow waterfall
monthlySold comps — $/sqft
last 12 mo · ≤1 miLoading sold comps…