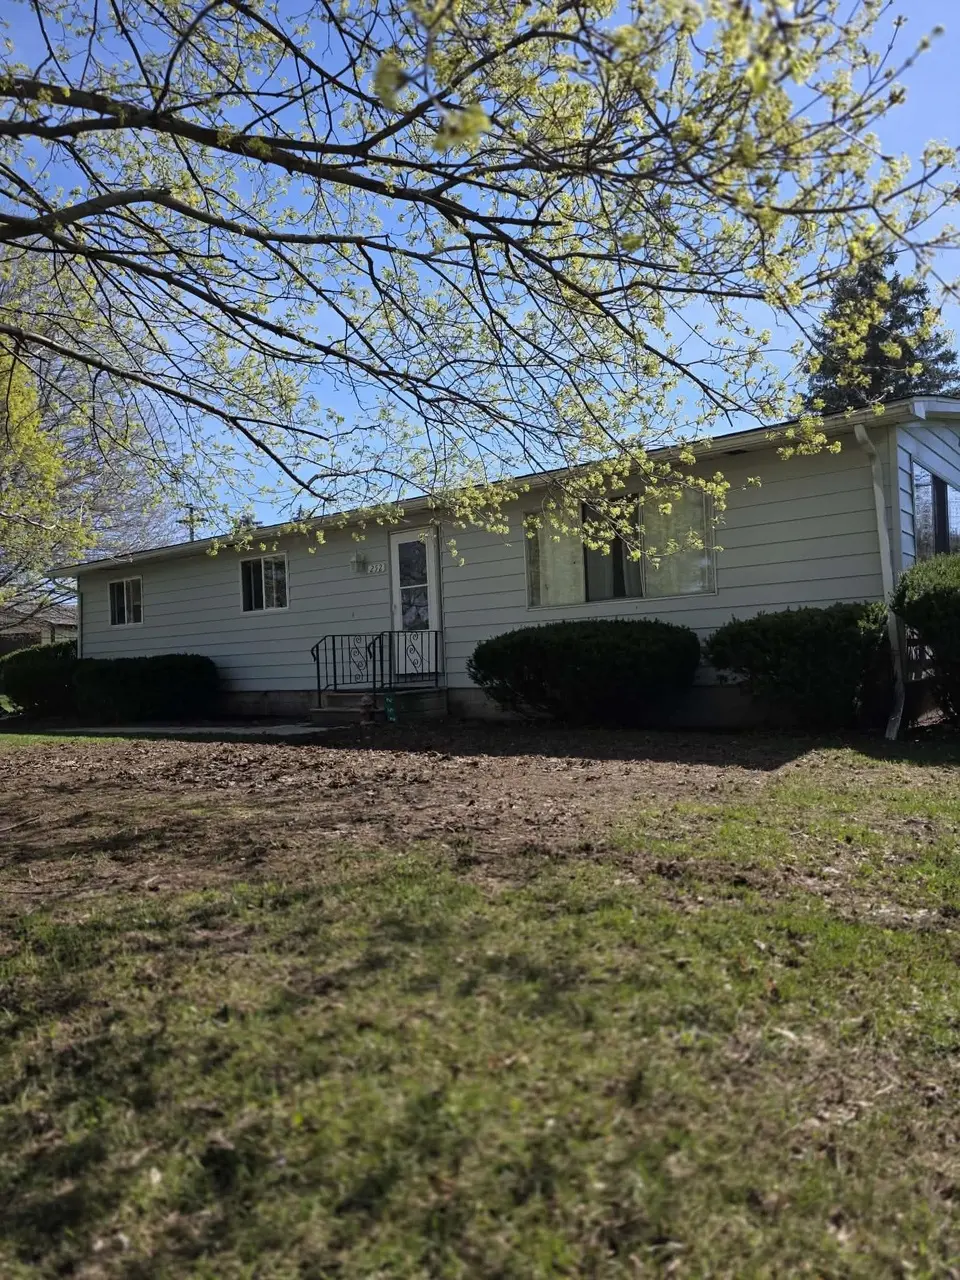
252 Dodge Ct · Sebewaing, MI
Flood risk 1/10 · Minimal
- FEMA flood zone
- X (unshaded)
- Chance of flooding over 30 yrs
- 0.0%
- Est. flood insurance / yr
- $473 – $860
Fire risk 1/10 · Minimal
- Est. fire insurance / yr
- $784 – $1,456
Heat risk 2/10 · Minimal
- Hot days now (above 97°F)
- 7 days/yr
- Hot days in 30 yrs
- 14 days/yr
Wind risk 1/10 · Minimal
- Chance of severe wind over 30 yrs
- —
Air-quality risk 2/10 · Minimal
- Unhealthy air days now
- 1 days/yr
- Unhealthy air days in 30 yrs
- 2 days/yr
Risk factors via First Street. Map © Google.
Why this score? — see what drove the B- grade
The composite is a weighted blend of 9 inputs, each scored 0–100. Each bar is that input's sub-score; the figure is the points it added to the 100-point composite (weight × sub-score).
- Cash flow +27.0/30.0
- ARV discount +15.0/15.0
- DSCR +9.3/10.0
- 1% rule +6.1/10.0
- Livability +3.7/5.0
- Schools +3.4/10.0
- Rent growth +2.5/5.0
- Condition / age +2.5/5.0
- Appreciation +0.0/10.0
$99,900
🖨 Deal sheet 📄 Offer letter ✓ Due diligence
Listing remarks MLS
Welcome to 252 Dodge Ct. Nestled on a private drive in a quiet neighborhood. This cute home is located just outside the village of Sebewaing. Featuring 3 bedrooms and 1.5 bathrooms with a large living room. In the backyard you will find a large cement patio great for gatherings or watching the sunrise. Amenities include city water and natural gas. Also including a small shed gives room for extra storage. New high efficiency furnace installed in February of 2025. This home is move in ready.
Key facts
- Small shed
- City water
- Quiet private street
Tags
Property features AI
Exterior
- Utilities: Public water; Septic system; Natural gas
- Home design: Manufactured double-wide home; Single-story
- Construction: Built in 1968; Crawl space foundation
- Exterior features: Aluminum exterior; Road frontage
Interior
- Kitchen: Kitchen approx. 9 x 12; Includes range/oven, microwave, refrigerator, dishwasher
- Bedrooms: Three bedrooms on the main level: 14 x 11, 12 x 11, and 8 (approx.)
- Bathrooms: Two total bathrooms (one full); Main-level bath approx. 8 x 5 (lavatory area 7 x 6)
- Heating & cooling: Forced air heating; Natural gas fuel
- Interior features: Open 1-story layout; Living room (22 x 14)
- Laundry & utility: Washer and dryer included
Neighborhood map
What this means for you Summary
Snapshot
- This is a 3-bed/1.0-bath single-family listed at $100k.
Deal economics
- At list price, monthly cash flow is $279 ($3k/yr) — positive.
- The deal already cash-flows at list — no discount required.
- Meets the 1% rule at list price ($1k rent vs $100k).
- Recommended offer: $97k (3.0% below list) — sets the bar for market timing.
Location & tenants
- Location reads 73/100 on livability (#205 in MI) — a middle-class / working-renter tenant base. Strengths: cost of living A+, housing A+, health & safety A+; Watch: schools C-, amenities F, commute F.
- Unionville-Sebewaing Area S.D. (rural): math 34% / reading 46% proficiency, ranked #212 of 540 in MI (top 39%) — families likely to look elsewhere, expect single-tenant / working-renter base with shorter leases.
- Market conditions: 7 active listings in the ZIP; 67 units permitted in Huron County in 2024 (0 in 5+ unit buildings).
Forward outlook
- Local home prices are declining (-3.0%/yr); year-one equity from $691 of loan paydown is wiped out by about $3k of value loss. Plan a longer hold.
- Huron County population projected at -26% by 2050 — secular population decline; favor cash flow + early exit over multi-decade hold.
- At projected returns (-3.0% appreciation + 3.0% rent growth), your $28k cash investment doubles in ~10 years — after that, you're playing with house money.
Negotiation context
- It's been on market 32 days — a 3% lower offer ($97k) is reasonable based on typical stale-listing flexibility.
- 2 sale attempts; this cycle's ask has dropped $10k (9%) from the opening price — seller is motivated, your offer sets the floor, not the list.
Questions for the listing agent
- It's been on market 32 days. Have you received any prior offers? Is the seller open to a 3% concession, seller financing, or rate buy-down credit?
- Built in 1968 — when were the roof, HVAC, electrical panel, plumbing, and water heater last replaced?
- Is there a deadline driving the sale (1031 exchange, divorce, estate, relocation)? That informs how much negotiation room exists.
- What's the average days-on-market for RENTAL listings here right now (not sales)? A rising rental-DOM trend means longer vacancies and softer asking-rent achievability than the comps imply.
- What's the recent tenant-quality profile in this submarket — average credit score on applications, eviction rate, late-payment / NSF rate, and stable-employment percentage? A property-management company in the area should have these aggregated.
- How much new for-sale + rental construction is in the pipeline within 1–3 miles? Heavy new supply typically softens prices + rents 12–24 months out; constrained supply supports both.
Investment metrics
- 1% rule
- 1.11% ✓
- Cap rate
- 9.65%
- Cash-on-cash
- 11.97%
- DSCR
- 1.53
- GRM
- 7.5
CMA / ARV
- ARV (on-the-fly)
- $129,024
- Comps found
- 5
Show comp detail 5 sales within ~0.75 mi
| Address | Dist | Beds/Ba | Sqft | Sold | Price | $/sf | Match |
|---|---|---|---|---|---|---|---|
| 930 E Pine St | 0.46mi | 2/1.0 (-1) | 1,200 (+4%) | 4mo | $85,000 | $71 | 63 |
| 113 Auch St | 0.67mi | 3/1.0 | 1,071 (-7%) | 9mo | $120,000 | $112 | 49 |
| 64 Auch St | 0.61mi | 3/1.0 | 1,295 (+12%) | 4mo | $135,000 | $104 | 47 |
| 345 Tenth St St | 0.41mi | 3/2.0 | 1,020 (-12%) | 21mo | $177,000 | $174 | 40 |
| 77 Auch St | 0.61mi | 2/2.0 (-1) | 1,320 (+15%) | 11mo | $155,000 | $117 | 29 |
Match score weights: distance 35% · size 25% · config 20% · recency 20%. Top-matched comps best support the ARV.
Projected returns pro-forma
-3.0% appreciation · 3.0% rent growth · sell at horizon
- IRR
- 1.4%
- Equity multiple
- 1.06×
- Total profit
- $1,551
- Equity at exit
- $14,895
- IRR
- 11.0%
- Equity multiple
- 1.86×
- Total profit
- $24,084
- Equity at exit
- $8,638
Cash invested: $27,972 (down + closing). Projections, not guarantees.
Landlord ↔ Tenant lean methodology
- Overall (STATE)
- 62 Landlord-Friendly
- State Michigan
- 62 Landlord-Friendly · EVEN
- County
- — inherits STATE
- City
- — inherits STATE
ZIP-level market 48759
- Home prices YoY
- -7.7%
- Active inventory
- 7
- Price-to-rent
- 7.5×
Monthly cashflow live
- Estimated rent
- $1,113 medium interval (Pro) →
- Mortgage (P&I)
- −$524
- Tax from tax record
- −$34 /mo · $412/yr
- Insurance
- −$42
- HOA
- −$0
- Vacancy / Maint / Mgmt
- −$234
- Net cashflow
- $279
Break-even live
UW: 25.0% down · 7.5% · 30yr · 1.5% tax · 5.0% vac · 8.0% maint · 8.0% mgmt
Financing live
Cash to close
- Down payment
- $24,975
- Closing costs
- $2,997
- Reserves months
- —
- Total cash needed
- —
Loan-product check · same deal, 3 products live
Conventional
25% down · 7.5% · 30yr
- Down + closing
- —
- Monthly P&I
- —
- Monthly cashflow
- —
- DSCR
- —
- Eligible?
- —
Personal DTI + credit; lowest rate.
DSCR
20% down · 8.5% · 30yr
- Down + closing
- —
- Monthly P&I
- —
- Monthly cashflow
- —
- DSCR
- —
- Eligible?
- —
No personal income docs; deal must DSCR.
Hard money
10% down · 12.0% · 12mo
- Down + closing
- —
- Monthly P&I
- —
- Monthly cashflow
- —
- DSCR
- —
- Eligible?
- —
Short-term bridge; refi at stabilization.
Listing history 18 events
-
2026-06-18days on market $99,900 Active 32 DOM
-
2026-06-17days on market $99,900 Active 31 DOM
-
2026-06-16days on market $99,900 Active 30 DOM
-
2026-06-15days on market $99,900 Active 29 DOM
-
2026-06-13days on market $99,900 Active 27 DOM
-
2026-06-12days on market $99,900 Active 26 DOM
-
2026-06-09days on market $99,900 Active 23 DOM
-
2026-06-08days on market $99,900 Active 22 DOM
-
2026-06-07days on market $99,900 Active 21 DOM
-
2026-06-05days on market $99,900 Active 19 DOM
-
2026-06-04days on market $99,900 Active 17 DOM
-
2026-06-02days on market $99,900 Active 16 DOM
-
2026-06-01days on market $99,900 Active 15 DOM
-
2026-05-31days on market $99,900 Active 14 DOM
-
2026-05-31days on market $99,900 Active 13 DOM
-
2026-05-22price $99,900
-
2026-05-17$109,900 Active
-
2026-05-12$109,900 Active 494-char remark
Show marketing remark (494 chars)
Welcome to 252 Dodge Ct. Nestled on a private drive in a quiet neighborhood. This cute home is located just outside the village of Sebewaing. Featuring 3 bedrooms and 1.5 bathrooms with a large living room. In the backyard you will find a large cement patio great for gatherings or watching the sunrise. Amenities include city water and natural gas. Also including a small shed gives room for extra storage. New high efficiency furnace installed in February of 2025. This home is move in ready.
ⓘ Source: listings_history table (triggers on properties + properties_extension) + one-shot
backfill from property_details.listing_events for pre-trigger history.
Tax reassessment forecast MI · Partial reset (capped growth)
- Current annual tax
- $412 · $34/mo
- Projected year-2 tax
- $975 · $81/mo
- Expected delta
- +$563/yr (+$47/mo · 136.7%)
ⓘ Screening estimate from a state-policy table — verify with the county assessor before closing.
Climate risk First Street
- Flood 1/10 Low FEMA zone X (unshaded) · 0% chance over 30 yrs
- Wildfire 1/10 Low
- Heat 2/10 Low 7 d/yr ≥97°F today · 14 d/yr by 30 yrs out
- Wind 1/10 Low
- Air quality 2/10 Low 1 unhealthy d/yr today · 2 by 30 yrs out
Nearby sold comps map
Loading sold comps map…
Walkable amenities ~0.75 mi
Loading nearby amenities…
Taxation est. · year 1
- Rental income
- $13,352
- − Mortgage interest
- −$5,596
- − Property taxes
- −$412
- − Insurance
- −$500
- − Repairs & maintenance
- −$1,068
- − Management
- −$1,068
- − Depreciation
- −$2,906
- Taxable income
- $1,802
- Est. tax owed @ 24.0%
- −$432
- After-tax cash flow
- $2,917/yr
For passive investors: Depreciation is non-cash, so a rental often shows a tax loss while cash-flowing — sheltering income. Rental losses are passive: they offset passive income freely, and up to $25,000/yr can offset ordinary (W-2) income if you actively participate and your MAGI is under $100k (phasing out to $0 by $150k); unused losses carry forward. On sale, claimed depreciation is recaptured at up to 25%, and gains may owe capital-gains tax (a 1031 exchange can defer both). Figures are a year-1 estimate at your 24.0% rate — not tax advice; consult a CPA.
Schools (NCES district)
- District
- Unionville-Sebewaing Area S.D.
- NCES district ID
- 2634440
- Math proficiency
- 34% ▼ -7.00%
- Reading proficiency
- 46% ▼ -1.00%
- Median HH income
- $46,715
- Composite
- 34.14/100
- National rank
- #5280
- State rank
- #212 of 540 in MI
Livability — Sebewaing
- Score
- 73/100
- State rank
- #205
- US rank
- #5193
Category grades
Schools grade is shown separately in the Schools card above.
Census & demographics
- Population (ZIP)
- 3,439
Population outlook (Huron County) Hauer SSP2
- Today (2025)
- 29,325 people
- By 2030
- 27,810 · -5.2%
- By 2040
- 24,571 · -16.2%
- By 2050
- 21,573 · -26.4%
- By 2075
- 16,120 · -45.0%
- By 2100
- 11,097 · -62.2%
Race, ethnicity, and origin ACS 2023
- Neighborhood character
- Predominantly White (95%)
- Race & ethnicity
- White 95% Two or more races 3% Hispanic / Latino 3%
- Common ancestry
- Romanian 7% Lithuanian 3% Scotch-Irish 3%
- Foreign-born
- 1% · Canada
- Languages at home
- 98% English-only · Spanish 2%
Political lean MEDSL · Huron
- 2024 margin
- Solid R (+40.6) · D 29.1% · R 69.7% · Other 1.2%
- 2008→2024 swing
- -40.2pp toward R · 2008: -0.4pp · 2024: -40.6pp
- All cycles
- 2024: R+40.6 2020: R+39.3 2016: R+38.2 2012: R+14.8 2008: R+0.4
Not yet ingested
- Civics
- —
Market trends
- HPI YoY
- ▼ -26.92%
- Current HPI
- 321.0491
- Rent YoY
- —
- Metro
- —
- State GDP YoY
- ▲ 1.37%
- F500 in state
- 28
Industry mix (Fortune 500 HQ in MI)
| Industry | F500 HQs | Revenue |
|---|---|---|
| Automotive Parts | 3 | $48B |
|
||
| Automotive | 2 | $372B |
|
||
| Chemicals | 1 | $45B |
|
||
| Automotive Retail | 1 | $29B |
|
||
| Healthcare / Medical Devices | 1 | $23B |
|
||
| Automotive Technology | 1 | $20B |
|
||
Price history
-9.1% since first listed3 events — show timeline
- 2026-05-22 Price Changed $99,900 MiRealSource-MiMLS
- 2026-05-17 Listed $109,900 MiRealSource-MiMLS
- 2026-05-12 Listed $109,900 FSBO.com
Property tax history
-7.8%/yrLatest (2025): $412 · -55.8% YoY. Source: county tax records.
Cash-flow waterfall
monthlySold comps — $/sqft
last 12 mo · ≤1 miLoading sold comps…