 Multi-family
169 171 Windish Cir · Lakeview, GA
Flood risk 1/10 · Minimal
- FEMA flood zone
- X (unshaded)
- Chance of flooding over 30 yrs
- 0.0%
- Est. flood insurance / yr
- $507 – $1,088
Fire risk 1/10 · Minimal
- Est. fire insurance / yr
- $963 – $1,789
Heat risk 5/10 · Moderate
- Hot days now (above 105°F)
- 7 days/yr
- Hot days in 30 yrs
- 19 days/yr
Wind risk 4/10 · Minor
- Chance of severe wind over 30 yrs
- 12.0%
Air-quality risk 3/10 · Minor
- Unhealthy air days now
- 2 days/yr
- Unhealthy air days in 30 yrs
- 2 days/yr
Risk factors via First Street. Map © Google.
Why this score? — see what drove the B+ grade
The composite is a weighted blend of 9 inputs, each scored 0–100. Each bar is that input's sub-score; the figure is the points it added to the 100-point composite (weight × sub-score).
- Cash flow +30.0/30.0
- ARV discount +15.0/15.0
- 1% rule +10.0/10.0
- DSCR +10.0/10.0
- Rent growth +4.4/5.0
- Livability +3.5/5.0
- Schools +3.3/10.0
- Condition / age +1.0/5.0
- Appreciation +0.0/10.0
$199,000
🖨 Deal sheet 📄 Offer letter ✓ Due diligence
Multi-family units
County records classify this as Multi-Family (2-4 Unit). Listing-text estimate: 1 unit. estimate disagrees with records
Listing remarks MLS
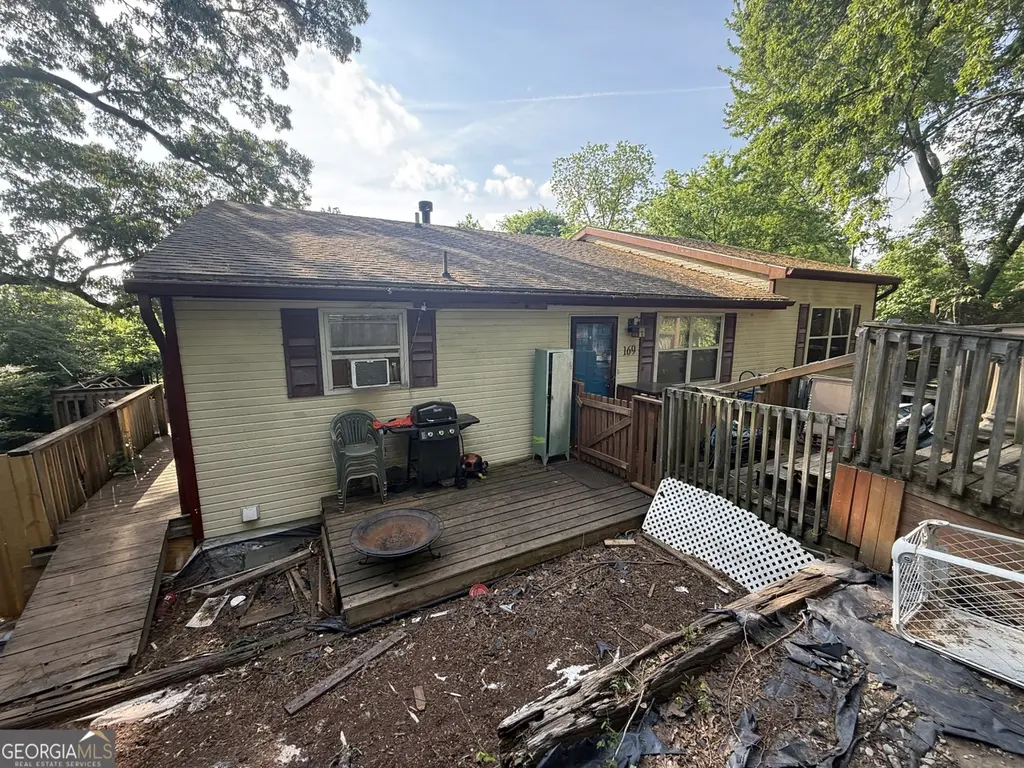
Duplex-style MF property featuring an upper level with 3 bedrooms, 2 bathrooms, dining room, living room, and attic access. The lower level offers a full kitchen, full bath, living room, and 3 bonus rooms, with potential to convert into additional bedrooms. Enjoy a four-seasons room, spacious yard on both sides, privacy fence, and two decks (large deck added in 2021, plus a smaller BBQ deck) great opportunity for investors or renovation projects.
Key facts
- Full kitchen
- Four seasons room
- Full bath
Tags
Property features AI
Exterior
- Parking: Other parking
- Utilities: Public water; Public sewer; Electricity connected; Water connected
- Home design: Single family residence; Residential property
- Construction: Brick construction; Slab foundation; Built area above grade: 3,500
- Exterior features: Outdoor grill; Other lot features
Interior
- Bedrooms: Total rooms: 6
- Bathrooms: 3 full bathrooms
- Heating & cooling: Window unit cooling; Other heating
- Interior features: Other interior features
Neighborhood map
What this means for you Summary
Snapshot
- This is a 6-bed/3.0-bath multifamily listed at $199k. Condition is rated poor.
Deal economics
- At list price, monthly cash flow is $1k ($18k/yr) — positive.
- The deal already cash-flows at list — no discount required.
- Meets the 1% rule at list price ($4k rent vs $199k).
- Cap rate 15.3% vs local median 4.9% in Lakeview — top-decile yield for the area; either an underpriced asset or a hidden risk that comps aren't pricing in. Stress-test before assuming the spread holds.
Location & tenants
- Location reads 69/100 on livability (#106 in GA) — a middle-class / working-renter tenant base. Strengths: cost of living A+, housing A+, crime B; Watch: amenities F, commute F.
- Catoosa County (suburban): math 36% / reading 41% proficiency, ranked #49 of 174 in GA (top 28%) — families likely to look elsewhere, expect single-tenant / working-renter base with shorter leases.
- Zoned schools: Cloud Springs Elementary School (math 32% / reading 32%, grade F, #582 of 1,228 statewide, top 50%, 279 students, 74% FRL); Lakeview Middle School (math 24% / reading 32%, grade F, #265 of 470 statewide, top 57%, 690 students, 67% FRL); Lakeview-Fort Oglethorpe High School (math 14% / reading 22%, grade F, #258 of 424 statewide, top 62%, 1,023 students, 55% FRL) — zoned schools average 65% FRL vs 41% district-wide (24 pts higher); higher-poverty schools than district average — tighter screening recommended.
- Zoned-school proficiency averages 26% at this address vs 38% district-wide (-12 pts) — the specific schools serving this property underperform the Catoosa County average; the district grade overstates school quality for this exact location.
- Market conditions: Rents rising fast (+7.4%/yr); 425 active listings in the ZIP; 848 units permitted in Catoosa County in 2024 (256 in 5+ unit buildings).
- At $3,628/mo this rent would consume 74% of the median local household income ($59k/yr) (locally 834% of renters already pay >50% of income on rent) — very limited rent-growth headroom before tenants either downsize or default.
Forward outlook
- Local home prices are declining (-3.0%/yr); year-one equity from $1k of loan paydown is wiped out by about $6k of value loss. Plan a longer hold.
- Catoosa County population projected at +5% by 2050 — modest demand growth; plan on rents tracking national, not racing it.
- At projected returns (-3.0% appreciation + 7.4% rent growth), your $56k cash investment doubles in ~4 years — after that, you're playing with house money.
Negotiation context
- Only 9 days on market — expect competitive offers; lowballing is unlikely to land.
- 2 sale attempts with the ask held roughly flat each time — persistent listings suggest the price (not the market) is what's stuck; bring a comps-based counter.
- Current owner paid $141k; 41% above their basis — modest negotiation headroom, anchor on the comps not their cost.
Risks & watch-outs
- Climate carrying-cost: extreme-heat days projected 7→19/yr by 2055 (HVAC capex compounding) — expect insurance premiums to compound above CPI over the hold.
Questions for the listing agent
- Have any recent inspections been done? Can we get a copy of the seller's disclosures and any deferred-maintenance estimates?
- Built in 1960 — when were the roof, HVAC, electrical panel, plumbing, and water heater last replaced?
- Is there a deadline driving the sale (1031 exchange, divorce, estate, relocation)? That informs how much negotiation room exists.
- Schools are F-rated, which usually means shorter tenancies and higher turnover. Who's the typical renter profile here, and what's been the actual vacancy rate?
- What's the average days-on-market for RENTAL listings here right now (not sales)? A rising rental-DOM trend means longer vacancies and softer asking-rent achievability than the comps imply.
- What's the recent tenant-quality profile in this submarket — average credit score on applications, eviction rate, late-payment / NSF rate, and stable-employment percentage? A property-management company in the area should have these aggregated.
- How much new apartment / multifamily construction is in the pipeline within 1–3 miles? Heavy new supply (>2% of stock underway) typically softens rents 12–24 months out; light construction supports rent growth.
Investment metrics
- 1% rule
- 1.82% ✓
- Cap rate
- 15.28%
- Cash-on-cash
- 32.11%
- DSCR
- 2.43
- GRM
- 4.6
CMA / ARV
- ARV (median comp)
- $240,626
- List price
- $199,000
- Delta
- -39.74%
- Verdict
- UNDERPRICED
- Comps
- 13 within 1.0 mi
Projected returns pro-forma
-3.0% appreciation · 7.44% rent growth · sell at horizon
- IRR
- 32.1%
- Equity multiple
- 2.43×
- Total profit
- $79,695
- Equity at exit
- $29,672
- IRR
- 41.5%
- Equity multiple
- 5.81×
- Total profit
- $268,049
- Equity at exit
- $17,206
Cash invested: $55,720 (down + closing). Projections, not guarantees.
Landlord ↔ Tenant lean methodology
- Overall (STATE)
- 90 Strongly Landlord-Friendly
- State Georgia
- 90 Strongly Landlord-Friendly · R+3
- County
- — inherits STATE
- City
- — inherits STATE
ZIP-level market 30741
- Home prices YoY
- -30.7%
- Rents YoY
- 7.4%
- Active inventory
- 425
- Price-to-rent
- 9.1×
Monthly cashflow live
- Estimated rent
- $3,628 high interval (Pro) →
- Mortgage (P&I)
- −$1,044
- Tax est. 1.5%
- −$249 /mo · $2,985/yr
- Insurance
- −$83
- HOA
- −$0
- Vacancy / Maint / Mgmt
- −$762
- Net cashflow
- $1,491
Break-even live
2-unit breakdown (identical units grouped — click to expand)
| Units | Beds | Baths | Est. rent |
|---|---|---|---|
| 1× unit | 3 | 2 | $1,814 |
| 1× unit | 3 | 1 | $1,814 |
| Total (2 units) | $3,628 | ||
UW: 25.0% down · 7.5% · 30yr · 1.5% tax · 5.0% vac · 8.0% maint · 8.0% mgmt
Financing live
Cash to close
- Down payment
- $49,750
- Closing costs
- $5,970
- Reserves months
- —
- Total cash needed
- —
Loan-product check · same deal, 3 products live
Conventional
25% down · 7.5% · 30yr
- Down + closing
- —
- Monthly P&I
- —
- Monthly cashflow
- —
- DSCR
- —
- Eligible?
- —
Personal DTI + credit; lowest rate.
DSCR
20% down · 8.5% · 30yr
- Down + closing
- —
- Monthly P&I
- —
- Monthly cashflow
- —
- DSCR
- —
- Eligible?
- —
No personal income docs; deal must DSCR.
Hard money
10% down · 12.0% · 12mo
- Down + closing
- —
- Monthly P&I
- —
- Monthly cashflow
- —
- DSCR
- —
- Eligible?
- —
Short-term bridge; refi at stabilization.
Listing history 9 events
-
2026-06-18days on market $199,000 Active 9 DOM
-
2026-06-17days on market $199,000 Active 8 DOM
-
2026-06-16days on market $199,000 Active 7 DOM
-
2026-06-15days on market $199,000 Active 6 DOM
-
2026-06-14days on market $199,000 Active 4 DOM
-
2026-06-10remarks 699-char remark
-
2026-06-10pricestatusdays on market $199,000 Active 1 DOM
-
2026-05-05price $145,000 450-char remark
Show marketing remark (450 chars)
Duplex-style MF property featuring an upper level with 3 bedrooms, 2 bathrooms, dining room, living room, and attic access. The lower level offers a full kitchen, full bath, living room, and 3 bonus rooms, with potential to convert into additional bedrooms. Enjoy a four-seasons room, spacious yard on both sides, privacy fence, and two decks (large deck added in 2021, plus a smaller BBQ deck) great opportunity for investors or renovation projects.
-
2026-04-30$159,000 New 450-char remark
Show marketing remark (450 chars)
Duplex-style MF property featuring an upper level with 3 bedrooms, 2 bathrooms, dining room, living room, and attic access. The lower level offers a full kitchen, full bath, living room, and 3 bonus rooms, with potential to convert into additional bedrooms. Enjoy a four-seasons room, spacious yard on both sides, privacy fence, and two decks (large deck added in 2021, plus a smaller BBQ deck) great opportunity for investors or renovation projects.
ⓘ Source: listings_history table (triggers on properties + properties_extension) + one-shot
backfill from property_details.listing_events for pre-trigger history.
Climate risk First Street
- Flood 1/10 Low FEMA zone X (unshaded) · 0% chance over 30 yrs
- Wildfire 1/10 Low
- Heat 5/10 Major 7 d/yr ≥105°F today · 19 d/yr by 30 yrs out
- Wind 4/10 Moderate 12% chance of damaging wind over 30 yrs
- Air quality 3/10 Moderate 2 unhealthy d/yr today · 2 by 30 yrs out
Nearby sold comps map
Loading sold comps map…
Walkable amenities ~0.75 mi
Loading nearby amenities…
Taxation est. · year 1
- Rental income
- $43,536
- − Mortgage interest
- −$11,147
- − Property taxes
- −$2,985
- − Insurance
- −$995
- − Repairs & maintenance
- −$3,483
- − Management
- −$3,483
- − Depreciation
- −$5,789
- Taxable income
- $15,654
- Est. tax owed @ 24.0%
- −$3,757
- After-tax cash flow
- $14,134/yr
For passive investors: Depreciation is non-cash, so a rental often shows a tax loss while cash-flowing — sheltering income. Rental losses are passive: they offset passive income freely, and up to $25,000/yr can offset ordinary (W-2) income if you actively participate and your MAGI is under $100k (phasing out to $0 by $150k); unused losses carry forward. On sale, claimed depreciation is recaptured at up to 25%, and gains may owe capital-gains tax (a 1031 exchange can defer both). Figures are a year-1 estimate at your 24.0% rate — not tax advice; consult a CPA.
Condition & rehab AI · 9 photos
This property requires extensive repairs and maintenance, including a new deck, exterior painting, and landscaping. Significant value can be added through these improvements.
Repairs flagged
- Major deck — Missing planks and structural damage
- Major exterior siding — Weathered and peeling
- Major landscaping — Overgrown vegetation and debris
Value-add opportunities
- Both Landscaping and exterior painting — Enhances curb appeal and property value
- Both Replace damaged deck — Improves safety and functionality
- Both Paint interior walls and trim — Enhances interior appearance and value
Renovation cost estimate screening
| Repair item | Severity | Est. cost |
|---|---|---|
| deck · Missing planks and structural damage | Major | $15,000–50,000 |
| exterior siding · Weathered and peeling | Major | $15,000–50,000 |
| landscaping · Overgrown vegetation and debris | Major | $15,000–50,000 |
| Total estimated repair cost · 3 items | $45,000–150,000 |
Value-add ROI direction
- Both Landscaping and exterior painting — Enhances curb appeal and property value ↑
- Both Replace damaged deck — Improves safety and functionality ↑
- Both Paint interior walls and trim — Enhances interior appearance and value ↑
ⓘ Cost ranges are severity-bucket heuristics (US national rule-of-thumb). Get contractor quotes + a written scope before underwriting a rehab budget.
Schools (NCES district)
- District
- Catoosa County
- NCES district ID
- 1300930
- Math proficiency
- 36% ▼ -15.00%
- Reading proficiency
- 41% ▼ -8.00%
- Median HH income
- $48,913
- Composite
- 33.13/100
- National rank
- #5558
- State rank
- #49 of 174 in GA
Livability — Lakeview
- Score
- 69/100
- State rank
- #106
- US rank
- #8207
Category grades
Schools grade is shown separately in the Schools card above.
Census & demographics
- Census place
- Lakeview, GA
- County
- Walker County · 48,831 people
- Metro
- Chattanooga, TN-GA
- Population (ZIP)
- 30,041
- Household income
- $58,834
- Rent vs Own
- Severe rent burden
- 834.0
Population outlook (Catoosa County) Hauer SSP2
- Today (2025)
- 70,112 people
- By 2030
- 71,621 · +2.2%
- By 2040
- 73,595 · +5.0%
- By 2050
- 73,921 · +5.4%
- By 2075
- 72,135 · +2.9%
- By 2100
- 65,979 · -5.9%
Race, ethnicity, and origin ACS 2023
- Neighborhood character
- Predominantly White (86%)
- Race & ethnicity
- White 86% Black 5% Two or more races 5% Hispanic / Latino 5%
- Common ancestry
- Slovak 3% Iranian 2% Italian 1%
- Foreign-born
- 2% · Canada
- Languages at home
- 96% English-only · Spanish 3%
Political lean MEDSL · Catoosa
- 2024 margin
- Solid R (+55.5) · D 22.0% · R 77.5%
- 2008→2024 swing
- -5.7pp toward R · 2008: -49.8pp · 2024: -55.5pp
- All cycles
- 2024: R+55.5 2020: R+56.0 2016: R+60.7 2012: R+52.8 2008: R+49.8
Not yet ingested
- Civics
- —
Market trends
- HPI YoY
- ▼ -118.05%
- Current HPI
- 267.0047
- Rent YoY
- ▲ 7.44%
- Metro
- Chattanooga, TN-GA
- State GDP YoY
- ▲ 2.66%
- F500 in state
- 28
Industry mix (Fortune 500 HQ in GA)
| Industry | F500 HQs | Revenue |
|---|---|---|
| Paper / Packaging | 2 | $29B |
|
||
| Retail | 1 | $160B |
|
||
| Transportation / Logistics | 1 | $91B |
|
||
| Airlines | 1 | $62B |
|
||
| Consumer Goods | 1 | $47B |
|
||
| Utilities | 1 | $25B |
|
||
Price history
+25.2% since first listed5 events — show timeline
- 2026-06-09 Listed $199,000 GCAR
- 2026-06-08 Sold (MLS) $141,000 GAMLS
- 2026-05-20 Pending — GAMLS
- 2026-05-05 Price Changed $145,000 GAMLS
- 2026-04-30 Listed $159,000 GAMLS
Cash-flow waterfall
monthlySold comps — $/sqft
last 12 mo · ≤1 miLoading sold comps…