 Triplex
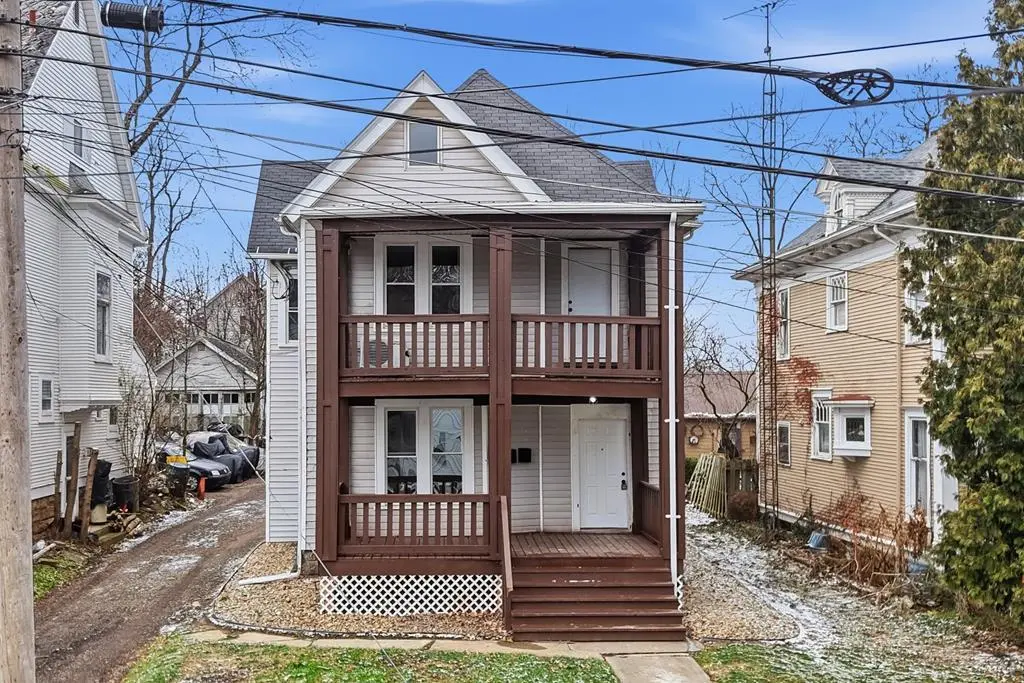
30 Douglas Ave · Mansfield, OH
Flood risk 1/10 · Minimal
- FEMA flood zone
- X (unshaded)
- Chance of flooding over 30 yrs
- 0.0%
- Est. flood insurance / yr
- $473 – $860
Fire risk 1/10 · Minimal
- Est. fire insurance / yr
- $713 – $1,323
Heat risk 3/10 · Minor
- Hot days now (above 96°F)
- 7 days/yr
- Hot days in 30 yrs
- 17 days/yr
Wind risk 2/10 · Minimal
- Chance of severe wind over 30 yrs
- —
Air-quality risk 2/10 · Minimal
- Unhealthy air days now
- 1 days/yr
- Unhealthy air days in 30 yrs
- 1 days/yr
Risk factors via First Street. Map © Google.
Why this score? — see what drove the C+ grade
The composite is a weighted blend of 9 inputs, each scored 0–100. Each bar is that input's sub-score; the figure is the points it added to the 100-point composite (weight × sub-score).
- Cash flow +27.9/30.0
- DSCR +9.9/10.0
- ARV discount +7.5/15.0
- 1% rule +6.6/10.0
- Livability +3.8/5.0
- Rent growth +2.5/5.0
- Condition / age +2.5/5.0
- Schools +2.3/10.0
- Appreciation +0.0/10.0
$174,900
🖨 Deal sheet 📄 Offer letter ✓ Due diligence
Multi-family units
County records classify this as Multi-Family (2-4 Unit). Listing-text estimate: 3 units. confirmed
Listing remarks
Welcome to 30 Douglas Ave, a fully rented triplex offering strong cash flow & newly completed updates throughout. All 3 units are equipped with electric baseboard heat, new mini-split heating & cooling systems, & brand-new fridges & stoves. Tenants enjoy private parking behind the property, with a gravel driveway. Exterior updates include fresh landscaping & a new front & rear deck. Unit A is a 3 bed, 1 bath unit featuring large beds & a full renovation in 2025, including new flooring, interior paint, a fully remodeled bathroom, new kitchen cabinets & countertops, & interior doors. Unit B is an updated efficiency including access to the up
Key facts
- Strong cash flow
- Cooling systems
- Built 1920
Tags
Property features AI
Exterior
- Parking: Gravel parking
- Security: Smoke detector(s)
- Utilities: Public water; Public sewer
- Home design: Multi-family residential income property; Vinyl siding
- Construction: Vinyl siding
- Exterior features: Smoke detector(s)
Interior
- Kitchen: Refrigerator; Range
- Bedrooms: One 3-bedroom unit; One 2-bedroom unit; One 1-bedroom unit
- Bathrooms: Three units with one bathroom each
- Heating & cooling: Baseboard heating; Has heating
- Interior features: Refrigerator; Range; Full basement
Neighborhood map
What this means for you Summary
Snapshot
- This is a 3 × 2-bed/1.0-bath units multifamily listed at $175k.
Deal economics
- At list price, monthly cash flow is $538 ($6k/yr) — positive. Per door: $179/mo.
- The deal already cash-flows at list — no discount required.
- Meets the 1% rule at list price ($2k rent vs $175k).
- Recommended offer: $172k (1.5% below list) — sets the bar for market timing.
- Cap rate 10.0% vs local median 4.2% in Mansfield — top-decile yield for the area; either an underpriced asset or a hidden risk that comps aren't pricing in. Stress-test before assuming the spread holds.
Location & tenants
- Location reads 76/100 on livability (#224 in OH, #3,525 nationally) — a middle-class / working-renter tenant base. Strengths: commute A+, cost of living A+, housing A+; Watch: schools C-, crime D-, amenities D-.
- Mansfield City (urban): math 24% / reading 33% proficiency, ranked #590 of 656 in OH (top 90%) — low school quality limits family demand, transient renter base, plan for 1-2y turnover; 80% free/reduced lunch — lower-income household profile, screen leases tightly.
- Market conditions: 117 active listings in the ZIP; 1 comparable units currently listed for rent nearby; 145 units permitted in Richland County in 2024 (0 in 5+ unit buildings).
- At $2,036/mo this rent would consume 48% of the median local household income ($51k/yr) — very limited rent-growth headroom before tenants either downsize or default.
Forward outlook
- Local home prices are declining (-3.0%/yr); year-one equity from $1k of loan paydown is wiped out by about $5k of value loss. Plan a longer hold.
- Richland County population projected at -18% by 2050 — secular population decline; favor cash flow + early exit over multi-decade hold.
- At projected returns (-3.0% appreciation + 3.0% rent growth), your $49k cash investment doubles in ~9 years — after that, you're playing with house money.
Negotiation context
- It's been on market 27 days — a 2% lower offer ($172k) is reasonable based on typical stale-listing flexibility.
- 6 sale attempts with the ask held roughly flat each time — persistent listings suggest the price (not the market) is what's stuck; bring a comps-based counter.
- Current owner paid $60k; list at $175k implies a 192% gain — meaningful room to come down on a strong offer.
Risks & watch-outs
- Watch-outs: built in 1920 — expect roof / HVAC / electrical / plumbing capex.
Questions for the listing agent
- Can we see the unit-by-unit rent roll, current vacancy, and any below-market leases? What's the average tenancy length?
- What capital expenditures (roof, boiler, parking lot, exteriors) have been made in the last 5 years, and what's planned in the next 2?
- Built in 1920 — when were the roof, HVAC, electrical panel, plumbing, and water heater last replaced?
- Is there a deadline driving the sale (1031 exchange, divorce, estate, relocation)? That informs how much negotiation room exists.
- Crime grade is D in this area — have there been break-ins, vandalism, or insurance claims at this property in the last 3 years? What carrier currently insures it and at what premium?
- What's the average days-on-market for RENTAL listings here right now (not sales)? A rising rental-DOM trend means longer vacancies and softer asking-rent achievability than the comps imply.
- What's the recent tenant-quality profile in this submarket — average credit score on applications, eviction rate, late-payment / NSF rate, and stable-employment percentage? A property-management company in the area should have these aggregated.
- How much new apartment / multifamily construction is in the pipeline within 1–3 miles? Heavy new supply (>2% of stock underway) typically softens rents 12–24 months out; light construction supports rent growth.
Investment metrics
- 1% rule
- 1.16% ✓
- Cap rate
- 9.98%
- Cash-on-cash
- 13.18%
- DSCR
- 1.59
- GRM
- 7.2
CMA / ARV
No comps found within radius.
Projected returns pro-forma
-3.0% appreciation · 3.0% rent growth · sell at horizon
- IRR
- 3.1%
- Equity multiple
- 1.12×
- Total profit
- $5,850
- Equity at exit
- $26,078
- IRR
- 12.6%
- Equity multiple
- 2.00×
- Total profit
- $48,970
- Equity at exit
- $15,122
Cash invested: $48,972 (down + closing). Projections, not guarantees.
Landlord ↔ Tenant lean methodology
- Overall (STATE)
- 73 Landlord-Friendly
- State Ohio
- 73 Landlord-Friendly · R+6
- County
- — inherits STATE
- City
- — inherits STATE
ZIP-level market 44906
- Home prices YoY
- -23.9%
- Active inventory
- 117
- Price-to-rent
- 21.5×
Monthly cashflow live
- Estimated rent
- $2,036 medium interval (Pro) →
- Mortgage (P&I)
- −$917
- Tax from tax record
- −$81 /mo · $968/yr
- Insurance
- −$73
- HOA
- −$0
- Vacancy / Maint / Mgmt
- −$428
- Net cashflow
- $538
Break-even live
3-unit breakdown (identical units grouped — click to expand)
| Units | Beds | Baths | Est. rent |
|---|---|---|---|
| 3× units | 2 | 1 | $2,037 |
| #1 | 2 | 1 | $679 |
| #2 | 2 | 1 | $679 |
| #3 | 2 | 1 | $679 |
| Total (3 units) | $2,036 | ||
UW: 25.0% down · 7.5% · 30yr · 1.5% tax · 5.0% vac · 8.0% maint · 8.0% mgmt
Financing live
Cash to close
- Down payment
- $43,725
- Closing costs
- $5,247
- Reserves months
- —
- Total cash needed
- —
Loan-product check · same deal, 3 products live
Conventional
25% down · 7.5% · 30yr
- Down + closing
- —
- Monthly P&I
- —
- Monthly cashflow
- —
- DSCR
- —
- Eligible?
- —
Personal DTI + credit; lowest rate.
DSCR
20% down · 8.5% · 30yr
- Down + closing
- —
- Monthly P&I
- —
- Monthly cashflow
- —
- DSCR
- —
- Eligible?
- —
No personal income docs; deal must DSCR.
Hard money
10% down · 12.0% · 12mo
- Down + closing
- —
- Monthly P&I
- —
- Monthly cashflow
- —
- DSCR
- —
- Eligible?
- —
Short-term bridge; refi at stabilization.
Rent comps 1 comps
| Address | Beds | Baths | Sqft | Rent | $/sqft | DOM | Units | Dist |
|---|---|---|---|---|---|---|---|---|
| 243 W 1st St Mansfield, OH | 4.0 | 1.0 | 1470 | $1,195 | $0.81 | 43d | 1 | 0.30mi |
Listing history 33 events
-
2026-06-18days on market $174,900 Active 27 DOM
-
2026-06-17days on market $174,900 Active 26 DOM
-
2026-06-16days on market $174,900 Active 25 DOM
-
2026-06-15days on market $174,900 Active 24 DOM
-
2026-06-14days on market $174,900 Active 22 DOM
-
2026-06-12days on market $174,900 Active 21 DOM
-
2026-06-09days on market $174,900 Active 18 DOM
-
2026-06-08days on market $174,900 Active 17 DOM
-
2026-06-07pricedays on market $174,900 Active 16 DOM
-
2026-06-05days on market $179,900 Active 13 DOM
-
2026-06-03days on market $179,900 Active 12 DOM
-
2026-06-02days on market $179,900 Active 11 DOM
-
2026-06-01days on market $179,900 Active 10 DOM
-
2026-05-31days on market $179,900 Active 9 DOM
-
2026-05-30days on market $179,900 Active 8 DOM
-
2026-05-22$179,900 Active
-
2026-05-22$179,900 Active
-
2026-05-22$179,900 Active
-
2026-04-22historical
-
2026-04-22historical
-
2026-04-03price $182,900
-
2026-03-23price $184,900
-
2026-03-05price $189,900
-
2026-02-27price $193,500
-
2026-01-13price $194,500
-
2026-01-05price $197,500
-
2025-12-05$199,900 Active
-
2025-12-05$182,900 Active
-
2025-12-05$182,900 Active
-
2025-07-25soldstatus $60,000
-
2011-04-20soldstatus $35,000
-
1999-07-08soldstatus $15,000
-
1999-05-19soldstatus $15,000
ⓘ Source: listings_history table (triggers on properties + properties_extension) + one-shot
backfill from property_details.listing_events for pre-trigger history.
Tax reassessment forecast OH · Partial reset (capped growth)
- Current annual tax
- $968 · $81/mo
- Projected year-2 tax
- $1,848 · $154/mo
- Expected delta
- +$880/yr (+$73/mo · 90.9%)
ⓘ Screening estimate from a state-policy table — verify with the county assessor before closing.
Climate risk First Street
- Flood 1/10 Low FEMA zone X (unshaded) · 0% chance over 30 yrs
- Wildfire 1/10 Low
- Heat 3/10 Moderate 7 d/yr ≥96°F today · 17 d/yr by 30 yrs out
- Wind 2/10 Low
- Air quality 2/10 Low 1 unhealthy d/yr today · 1 by 30 yrs out
Nearby sold comps map
Loading sold comps map…
Walkable amenities ~0.75 mi
Loading nearby amenities…
Taxation est. · year 1
- Rental income
- $24,432
- − Mortgage interest
- −$9,797
- − Property taxes
- −$968
- − Insurance
- −$874
- − Repairs & maintenance
- −$1,955
- − Management
- −$1,955
- − Depreciation
- −$5,088
- Taxable income
- $3,795
- Est. tax owed @ 24.0%
- −$911
- After-tax cash flow
- $5,541/yr
For passive investors: Depreciation is non-cash, so a rental often shows a tax loss while cash-flowing — sheltering income. Rental losses are passive: they offset passive income freely, and up to $25,000/yr can offset ordinary (W-2) income if you actively participate and your MAGI is under $100k (phasing out to $0 by $150k); unused losses carry forward. On sale, claimed depreciation is recaptured at up to 25%, and gains may owe capital-gains tax (a 1031 exchange can defer both). Figures are a year-1 estimate at your 24.0% rate — not tax advice; consult a CPA.
Schools (NCES district)
- District
- Mansfield City
- NCES district ID
- 3904429
- Math proficiency
- 24% ▼ -19.00%
- Reading proficiency
- 33% ▼ -12.00%
- Median HH income
- $32,435
- Composite
- 23.25/100
- National rank
- #7934
- State rank
- #590 of 656 in OH
Livability — Mansfield
- Score
- 76/100
- State rank
- #224
- US rank
- #3525
Category grades
Schools grade is shown separately in the Schools card above.
Census & demographics
- Census place
- Mansfield, OH
- County
- Richland · 128,966 people
- City population
- 16,349
- Metro
- Mansfield, OH
- Population (ZIP)
- 17,059
- Household income
- $51,358
- Rent vs Own
- Severe rent burden
- 13.7
Population outlook (Richland County) Hauer SSP2
- Today (2025)
- 115,577 people
- By 2030
- 111,669 · -3.4%
- By 2040
- 103,323 · -10.6%
- By 2050
- 95,135 · -17.7%
- By 2075
- 76,719 · -33.6%
- By 2100
- 57,188 · -50.5%
Race, ethnicity, and origin ACS 2023
- Neighborhood character
- Predominantly White (86%)
- Race & ethnicity
- White 86% Black 5% Two or more races 4% Asian 2% Hispanic / Latino 1%
- Common ancestry
- Slovak 3% Serbian 3% Italian 2%
- Foreign-born
- 3% · South Korea
- Languages at home
- 95% English-only · German/W. Germanic 1% Spanish 1% Other Indo-European 1%
Political lean MEDSL · Richland
- 2024 margin
- Solid R (+42.3) · D 28.4% · R 70.8%
- 2008→2024 swing
- -28.8pp toward R · 2008: -13.6pp · 2024: -42.3pp
- All cycles
- 2024: R+42.3 2020: R+39.7 2016: R+37.5 2012: R+20.1 2008: R+13.6
Not yet ingested
- Civics
- —
Market trends
- HPI YoY
- ▼ -70.59%
- Current HPI
- 224.6878
- Rent YoY
- —
- Metro
- —
- State GDP YoY
- ▲ 1.98%
- F500 in state
- 48
Industry mix (Fortune 500 HQ in OH)
| Industry | F500 HQs | Revenue |
|---|---|---|
| Insurance | 3 | $145B |
|
||
| Industrial Machinery | 3 | $49B |
|
||
| Financial Services | 3 | $24B |
|
||
| Consumer Goods | 2 | $93B |
|
||
| Aerospace / Defense | 2 | $47B |
|
||
| Utilities | 2 | $33B |
|
||
Price history
+1099.3% since first listed18 events — show timeline
- 2026-05-22 Listed $179,900 CBRMLS
- 2026-05-22 Listed $179,900 MLSNOW
- 2026-05-22 Listed $179,900 MARMLS
- 2026-04-22 Listing Removed — MLSNOW
- 2026-04-22 Listing Removed — CBRMLS
- 2026-04-03 Price Changed $182,900 MARMLS
- 2026-03-23 Price Changed $184,900 MARMLS
- 2026-03-05 Price Changed $189,900 MARMLS
- 2026-02-27 Price Changed $193,500 MARMLS
- 2026-01-13 Price Changed $194,500 MARMLS
- 2026-01-05 Price Changed $197,500 MARMLS
- 2025-12-05 Listed $199,900 MARMLS
- 2025-12-05 Listed $182,900 MLSNOW
- 2025-12-05 Listed $182,900 CBRMLS
- 2025-07-25 Sold (Public Records) $60,000 Public Records
- 2011-04-20 Sold (Public Records) $35,000 Public Records
- 1999-07-08 Sold (Public Records) $15,000 Public Records
- 1999-05-19 Sold (Public Records) $15,000 Public Records
Property tax history
-1.6%/yrLatest (2025): $968 · +0.0% YoY. Source: county tax records.
Cash-flow waterfall
monthlySold comps — $/sqft
last 12 mo · ≤1 miLoading sold comps…