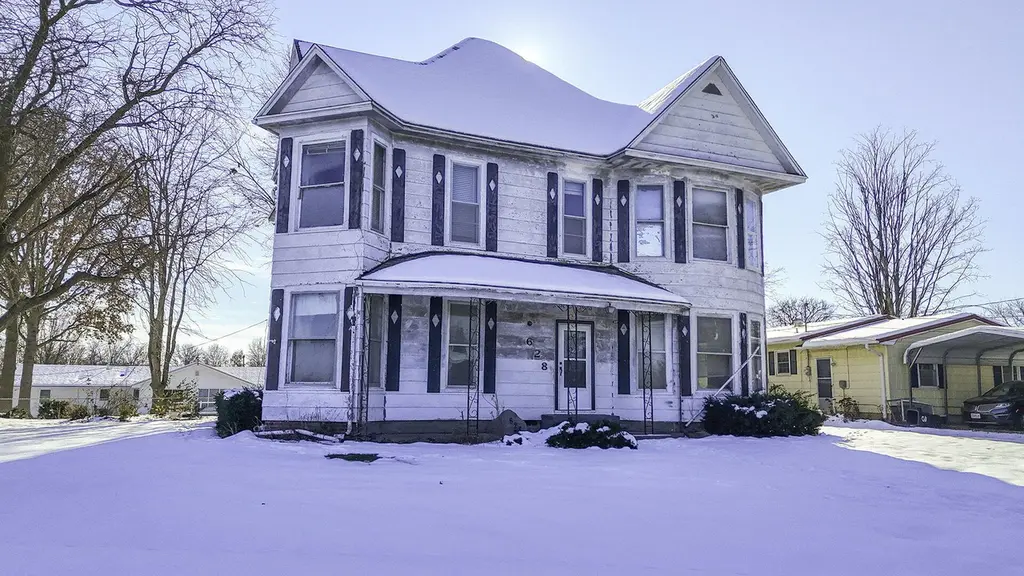
628 Woodland Ave · Moberly, MO
Flood risk 1/10 · Minimal
- FEMA flood zone
- X (unshaded)
- Chance of flooding over 30 yrs
- 0.0%
- Est. flood insurance / yr
- $507 – $1,088
Fire risk 3/10 · Minor
- Est. fire insurance / yr
- $1,054 – $1,958
Heat risk 4/10 · Minor
- Hot days now (above 107°F)
- 7 days/yr
- Hot days in 30 yrs
- 17 days/yr
Wind risk 2/10 · Minimal
- Chance of severe wind over 30 yrs
- —
Air-quality risk 1/10 · Minimal
- Unhealthy air days now
- 0 days/yr
- Unhealthy air days in 30 yrs
- 0 days/yr
Risk factors via First Street. Map © Google.
Why this score? — see what drove the C grade
The composite is a weighted blend of 9 inputs, each scored 0–100. Each bar is that input's sub-score; the figure is the points it added to the 100-point composite (weight × sub-score).
- Cash flow +20.1/30.0
- ARV discount +15.0/15.0
- DSCR +6.4/10.0
- 1% rule +4.3/10.0
- Livability +3.9/5.0
- Schools +2.7/10.0
- Rent growth +2.5/5.0
- Condition / age +2.5/5.0
- Appreciation +0.0/10.0
$150,000
🖨 Deal sheet 📄 Offer letter ✓ Due diligence
Listing remarks MLS
STATELY HISTORIC HOME LOADED WITH CHARM. 4 BEDROOMS-5 POSSIBLE, 2 BATHS, LARGE ROOMS, OFFICE IN UPPER LEVEL, BEAUTIFUL ORIGINAL HARDWOOD, ORIGINAL STAIRCASE, FIREPLACE IN LR USED FOR ESTHETIC PURPOSES, NEW ROOF INSTALLED THIS SUMMER AND FOUNDATION HAS BEEN RE-ENFORCED. TWO MAJOR EXPENSES HAVE BEEN COMPLETED FOR NEXT OWNER. PARTIAL UNFINISHED BASEMENT, LOTS OF OUTDOOR SPACE, RECENTLY SURVEYED, 24' X 68' DETACHED GARAGE/SHOP. WAITING TO BE COMPLETED. Professional photos will be available soon.
Key facts
- Hardwood
- Outdoor space
- Original staircase
Tags
Neighborhood map
What this means for you Summary
Snapshot
- This is a 4-bed/2.0-bath single-family listed at $150k.
Deal economics
- At list price, monthly cash flow is $188 ($2k/yr) — positive.
- The deal already cash-flows at list — no discount required.
- To meet the 1% rule (rent ≥ 1% of price), the offer needs to be $140k (6.8% below list).
- Recommended offer: $132k (12.0% below list) — sets the bar for market timing.
- Cap rate 7.8% vs local median 4.5% in Moberly — top-decile yield for the area; either an underpriced asset or a hidden risk that comps aren't pricing in. Stress-test before assuming the spread holds.
Location & tenants
- Location reads 77/100 on livability (#32 in MO, #3,045 nationally) — a middle-class / working-renter tenant base. Strengths: cost of living A+, housing A+, health & safety A+; Watch: employment D, schools D-, amenities F.
- Moberly (town): math 30% / reading 36% proficiency, ranked #246 of 324 in MO (top 76%) — families likely to look elsewhere, expect single-tenant / working-renter base with shorter leases.
- Market conditions: 134 active listings in the ZIP; 25 units permitted in Randolph County in 2024 (0 in 5+ unit buildings).
Forward outlook
- Local home prices are declining (-3.0%/yr); year-one equity from $1k of loan paydown is wiped out by about $4k of value loss. Plan a longer hold.
- Randolph County population projected at -10% by 2050 — secular population decline; favor cash flow + early exit over multi-decade hold.
Negotiation context
- It's been on market 182 days — a 12% lower offer ($132k) is reasonable based on typical stale-listing flexibility.
- 2 sale attempts with the ask held roughly flat each time — persistent listings suggest the price (not the market) is what's stuck; bring a comps-based counter.
Risks & watch-outs
- Watch-outs: built in 1918 — expect roof / HVAC / electrical / plumbing capex.
Questions for the listing agent
- It's been on market 182 days. Have you received any prior offers? Is the seller open to a 12% concession, seller financing, or rate buy-down credit?
- Built in 1918 — when were the roof, HVAC, electrical panel, plumbing, and water heater last replaced?
- Why hasn't it sold? Are there any deal-killer items the seller is aware of (foundation, flood, title, zoning, code violations)?
- Is there a deadline driving the sale (1031 exchange, divorce, estate, relocation)? That informs how much negotiation room exists.
- Schools are D-rated, which usually means shorter tenancies and higher turnover. Who's the typical renter profile here, and what's been the actual vacancy rate?
- What's the average days-on-market for RENTAL listings here right now (not sales)? A rising rental-DOM trend means longer vacancies and softer asking-rent achievability than the comps imply.
- What's the recent tenant-quality profile in this submarket — average credit score on applications, eviction rate, late-payment / NSF rate, and stable-employment percentage? A property-management company in the area should have these aggregated.
- How much new for-sale + rental construction is in the pipeline within 1–3 miles? Heavy new supply typically softens prices + rents 12–24 months out; constrained supply supports both.
Investment metrics
- 1% rule
- 0.93% ✗
- Cap rate
- 7.79%
- Cash-on-cash
- 5.36%
- DSCR
- 1.24
- GRM
- 8.9
CMA / ARV
- ARV (median comp)
- $233,033
- List price
- $150,000
- Delta
- -35.63%
- Verdict
- UNDERPRICED
- Comps
- 20 within 1.0 mi
Show comp detail 7 sales within ~0.75 mi
| Address | Dist | Beds/Ba | Sqft | Sold | Price | $/sf | Match |
|---|---|---|---|---|---|---|---|
| 1008 Union Ave | 0.53mi | 4/2.0 | 2,511 (-4%) | 19mo | $229,900 | $92 | 53 |
| 803 E Mckinsey Pl | 0.52mi | 4/3.0 | 2,410 (-8%) | 15mo | $285,000 | $118 | 46 |
| 1006 Bradford Cir | 0.61mi | 4/3.0 | 2,942 (+12%) | 2mo | $430,000 | $146 | 45 |
| 735 Farror St | 0.39mi | 4/3.0 | 2,362 (-10%) | 21mo | $219,000 | $93 | 44 |
| 406 E Logan St | 0.49mi | 3/1.5 (-1) | 2,415 (-8%) | 20mo | $160,000 | $66 | 40 |
| 316 Taylor St | 0.69mi | 4/2.0 | 2,300 (-12%) | 9mo | $189,000 | $82 | 40 |
| 1009 Bradford Cir | 0.58mi | 3/2.5 (-1) | 2,317 (-12%) | 9mo | $387,000 | $167 | 39 |
Match score weights: distance 35% · size 25% · config 20% · recency 20%. Top-matched comps best support the ARV.
Projected returns pro-forma
-3.0% appreciation · 3.0% rent growth · sell at horizon
- IRR
- -8.0%
- Equity multiple
- 0.70×
- Total profit
- $-12,412
- Equity at exit
- $22,365
- IRR
- 1.5%
- Equity multiple
- 1.10×
- Total profit
- $4,361
- Equity at exit
- $12,969
Cash invested: $42,000 (down + closing). Projections, not guarantees.
Landlord ↔ Tenant lean methodology
- Overall (STATE)
- 81 Strongly Landlord-Friendly
- State Missouri
- 81 Strongly Landlord-Friendly · R+10
- County
- — inherits STATE
- City
- — inherits STATE
ZIP-level market 65270
- Home prices YoY
- -30.6%
- Active inventory
- 134
- Price-to-rent
- 8.9×
Monthly cashflow live
- Estimated rent
- $1,398 medium interval (Pro) →
- Mortgage (P&I)
- −$787
- Tax from tax record
- −$68 /mo · $813/yr
- Insurance
- −$62
- HOA
- −$0
- Vacancy / Maint / Mgmt
- −$294
- Net cashflow
- $188
Break-even live
UW: 25.0% down · 7.5% · 30yr · 1.5% tax · 5.0% vac · 8.0% maint · 8.0% mgmt
Financing live
Cash to close
- Down payment
- $37,500
- Closing costs
- $4,500
- Reserves months
- —
- Total cash needed
- —
Loan-product check · same deal, 3 products live
Conventional
25% down · 7.5% · 30yr
- Down + closing
- —
- Monthly P&I
- —
- Monthly cashflow
- —
- DSCR
- —
- Eligible?
- —
Personal DTI + credit; lowest rate.
DSCR
20% down · 8.5% · 30yr
- Down + closing
- —
- Monthly P&I
- —
- Monthly cashflow
- —
- DSCR
- —
- Eligible?
- —
No personal income docs; deal must DSCR.
Hard money
10% down · 12.0% · 12mo
- Down + closing
- —
- Monthly P&I
- —
- Monthly cashflow
- —
- DSCR
- —
- Eligible?
- —
Short-term bridge; refi at stabilization.
Listing history 3 events
-
2025-11-25$150,000 Active 496-char remark
Show marketing remark (516 chars)
STATELY HISTORIC HOME LOADED WITH CHARM. 4 Bedrooms, 5 possible, 2 Baths, Large Rooms, Office Space Upper Level, Beautiful Original Woodwork, Original Staircase. Fireplace in LR used for Esthetic Purposes. New Roof installed this Summer and Foundation has been re-enforced. Two Major Expenses have been completed for the next owner. Partial unfinished basement, Lots of Outdoor space, Recently surveyed, 24' x 68' Detached Garage/Shop Combination. Waiting to be Completed. Professional Photos will be available soon.
-
2025-11-25$150,000 Active 516-char remark
Show marketing remark (516 chars)
STATELY HISTORIC HOME LOADED WITH CHARM. 4 Bedrooms, 5 possible, 2 Baths, Large Rooms, Office Space Upper Level, Beautiful Original Woodwork, Original Staircase. Fireplace in LR used for Esthetic Purposes. New Roof installed this Summer and Foundation has been re-enforced. Two Major Expenses have been completed for the next owner. Partial unfinished basement, Lots of Outdoor space, Recently surveyed, 24' x 68' Detached Garage/Shop Combination. Waiting to be Completed. Professional Photos will be available soon.
-
2008-03-06soldstatus
ⓘ Source: listings_history table (triggers on properties + properties_extension) + one-shot
backfill from property_details.listing_events for pre-trigger history.
Tax reassessment forecast MO · Resets to sale price
- Current annual tax
- $813 · $68/mo
- Projected year-2 tax
- $1,455 · $121/mo
- Expected delta
- +$642/yr (+$53/mo · 78.9%)
ⓘ Screening estimate from a state-policy table — verify with the county assessor before closing.
Climate risk First Street
- Flood 1/10 Low FEMA zone X (unshaded) · 0% chance over 30 yrs
- Wildfire 3/10 Moderate
- Heat 4/10 Moderate 7 d/yr ≥107°F today · 17 d/yr by 30 yrs out
- Wind 2/10 Low
- Air quality 1/10 Low 0 unhealthy d/yr today · 0 by 30 yrs out
Nearby sold comps map
Loading sold comps map…
Walkable amenities ~0.75 mi
Loading nearby amenities…
Taxation est. · year 1
- Rental income
- $16,777
- − Mortgage interest
- −$8,402
- − Property taxes
- −$813
- − Insurance
- −$750
- − Repairs & maintenance
- −$1,342
- − Management
- −$1,342
- − Depreciation
- −$4,364
- Taxable loss
- −$237
- Est. tax savings @ 24.0%
- +$57
- After-tax cash flow
- $2,308/yr
For passive investors: Depreciation is non-cash, so a rental often shows a tax loss while cash-flowing — sheltering income. Rental losses are passive: they offset passive income freely, and up to $25,000/yr can offset ordinary (W-2) income if you actively participate and your MAGI is under $100k (phasing out to $0 by $150k); unused losses carry forward. On sale, claimed depreciation is recaptured at up to 25%, and gains may owe capital-gains tax (a 1031 exchange can defer both). Figures are a year-1 estimate at your 24.0% rate — not tax advice; consult a CPA.
Schools (NCES district)
- District
- Moberly
- NCES district ID
- 2921100
- Math proficiency
- 30% ▼ -1.00%
- Reading proficiency
- 36% ▼ -3.00%
- Median HH income
- $36,160
- Composite
- 27.35/100
- National rank
- #6984
- State rank
- #246 of 324 in MO
Livability — Moberly
- Score
- 77/100
- State rank
- #32
- US rank
- #3045
Category grades
Schools grade is shown separately in the Schools card above.
Census & demographics
- Census place
- Moberly, MO
- Population (ZIP)
- 16,762
Population outlook (Randolph County) Hauer SSP2
- Today (2025)
- 24,596 people
- By 2030
- 24,213 · -1.6%
- By 2040
- 23,184 · -5.7%
- By 2050
- 22,081 · -10.2%
- By 2075
- 18,994 · -22.8%
- By 2100
- 15,070 · -38.7%
Race, ethnicity, and origin ACS 2023
- Neighborhood character
- Predominantly White (84%)
- Race & ethnicity
- White 84% Black 7% Two or more races 6% Hispanic / Latino 3%
- Common ancestry
- Italian 2% Lithuanian 2% Iranian 1%
- Foreign-born
- 1% · Canada
- Languages at home
- 98% English-only · Spanish 1%
Political lean MEDSL · Randolph
- 2024 margin
- Solid R (+52.2) · D 23.3% · R 75.5% · Other 1.2%
- 2008→2024 swing
- -28.9pp toward R · 2008: -23.3pp · 2024: -52.2pp
- All cycles
- 2024: R+52.2 2020: R+51.5 2016: R+50.9 2012: R+36.6 2008: R+23.3
Not yet ingested
- Civics
- —
Market trends
- HPI YoY
- ▼ -88.15%
- Current HPI
- 199.9743
- Rent YoY
- —
- Metro
- —
- State GDP YoY
- ▲ 1.84%
- F500 in state
- 20
Industry mix (Fortune 500 HQ in MO)
| Industry | F500 HQs | Revenue |
|---|---|---|
| Healthcare | 1 | $163B |
|
||
| Insurance | 1 | $21B |
|
||
| Industrial Technology | 1 | $17B |
|
||
| Retail | 1 | $16B |
|
||
| Industrial Distribution | 1 | $10B |
|
||
| Utilities | 1 | $9B |
|
||
Price history
+0.0% since first listed3 events — show timeline
- 2025-11-25 Listed $150,000 RCBR
- 2025-11-25 Listed $150,000 CBORMLS
- 2008-03-06 Sold (Public Records) — Public Records
Property tax history
+2.3%/yrLatest (2025): $813 · +9.8% YoY. Source: county tax records.
Cash-flow waterfall
monthlySold comps — $/sqft
last 12 mo · ≤1 miLoading sold comps…