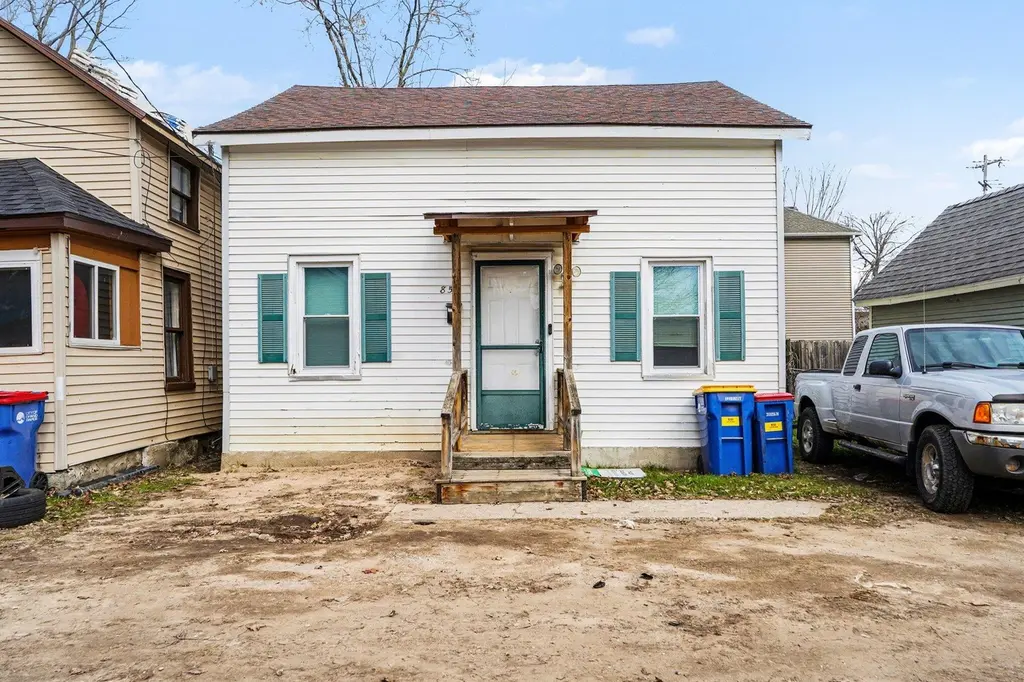
850 3rd St NW · Grand Rapids, MI
Flood risk 4/10 · Minor
- FEMA flood zone
- X (shaded)
- Chance of flooding over 30 yrs
- 0.22%
- Est. flood insurance / yr
- $473 – $860
Fire risk 1/10 · Minimal
- Est. fire insurance / yr
- $784 – $1,456
Heat risk 2/10 · Minimal
- Hot days now (above 96°F)
- 7 days/yr
- Hot days in 30 yrs
- 16 days/yr
Wind risk 2/10 · Minimal
- Chance of severe wind over 30 yrs
- —
Air-quality risk 3/10 · Minor
- Unhealthy air days now
- 2 days/yr
- Unhealthy air days in 30 yrs
- 3 days/yr
Risk factors via First Street. Map © Google.
Why this score? — see what drove the D+ grade
The composite is a weighted blend of 9 inputs, each scored 0–100. Each bar is that input's sub-score; the figure is the points it added to the 100-point composite (weight × sub-score).
- Cash flow +18.9/30.0
- ARV discount +7.5/15.0
- DSCR +5.9/10.0
- 1% rule +4.2/10.0
- Livability +4.2/5.0
- Rent growth +3.2/5.0
- Condition / age +2.5/5.0
- Schools +1.9/10.0
- Appreciation +0.0/10.0
$179,231
🖨 Deal sheet 📄 Offer letter ✓ Due diligence
Listing remarks MLS
Nice 2 bedroom 1 bath home, ideal for owner occupancy or investor looking to expand their portfolio. The home and yard are in nice condition. Prime location with easy access to the expressways, close to downtown and near shopping, restaurants and schools. This property combines convenience with charm. Upstair level is esitmated SQ FT.
Key facts
- Near schools
- Near shopping
- Near restaurants
Tags
Property features AI
Exterior
- Utilities: Public water; Natural gas available and connected; Electricity available; Cable connected; High-speed internet available
- Home design: Traditional style single-family residence; Built in 1890
- Construction: Concrete and vinyl siding construction; Shingle roof; Partial basement with crawl space
- Exterior features: Sidewalk; Paved road access
Interior
- Kitchen: Dishwasher; Oven; Range; Refrigerator
- Bathrooms: 1 full bathroom
- Heating & cooling: Forced air heating
- Interior features: Pantry; Insulated windows; 8 total rooms
- Laundry & utility: Washer; Dryer; Natural gas water heater
Neighborhood map
What this means for you Summary
Snapshot
- This is a 2-bed/1.0-bath single-family listed at $179k.
Deal economics
- At list price, monthly cash flow is $183 ($2k/yr) — positive.
- The deal already cash-flows at list — no discount required.
- To meet the 1% rule (rent ≥ 1% of price), the offer needs to be $165k (7.7% below list).
- Recommended offer: $165k (7.7% below list) — sets the bar for 1% rule.
- Cap rate 7.5% vs local median 4.5% in Grand Rapids — top-decile yield for the area; either an underpriced asset or a hidden risk that comps aren't pricing in. Stress-test before assuming the spread holds.
Location & tenants
- Location reads 83/100 on livability (#44 in MI, #939 nationally) — a professional / high-income tenant draw. Strengths: amenities A+, commute A+, cost of living A+; Watch: employment C-, crime F.
- Grand Rapids Public Schools (urban): math 15% / reading 29% proficiency, ranked #451 of 540 in MI (top 84%) — low school quality limits family demand, transient renter base, plan for 1-2y turnover; 80% free/reduced lunch — lower-income household profile, screen leases tightly.
- Market conditions: Rents rising (+2.6%/yr); 153 active listings in the ZIP; 40 comparable units currently listed for rent nearby; rentals lingering (median 44d on market — plan ~5-8 weeks vacancy on turnover, expect pricing pressure); 92% of comp listings sitting > 30 days — soft ceiling on asking rent; 2,253 units permitted in Kent County in 2024 (969 in 5+ unit buildings).
Forward outlook
- Local home prices are declining (-3.0%/yr); year-one equity from $1k of loan paydown is wiped out by about $5k of value loss. Plan a longer hold.
- Kent County population projected at +22% by 2050 — long-run rental-demand tailwind backs the buy-and-hold thesis.
Negotiation context
- It's been on market 21 days — a 2% lower offer ($177k) is reasonable based on typical stale-listing flexibility.
- 19 sale attempts since 17y ago with the ask held roughly flat each time — persistent listings suggest the price (not the market) is what's stuck; bring a comps-based counter.
- Current owner paid $8k; list at $179k implies a 2290% gain — meaningful room to come down on a strong offer.
Risks & watch-outs
- Watch-outs: built in 1890 — expect roof / HVAC / electrical / plumbing capex.
Questions for the listing agent
- Built in 1890 — when were the roof, HVAC, electrical panel, plumbing, and water heater last replaced?
- Is there a deadline driving the sale (1031 exchange, divorce, estate, relocation)? That informs how much negotiation room exists.
- Crime grade is F in this area — have there been break-ins, vandalism, or insurance claims at this property in the last 3 years? What carrier currently insures it and at what premium?
- The area grade is low — what's the realistic commute time and amenity access for the typical tenant pool here? Any planned neighborhood developments (good or bad) we should know about?
- What's the average days-on-market for RENTAL listings here right now (not sales)? A rising rental-DOM trend means longer vacancies and softer asking-rent achievability than the comps imply.
- What's the recent tenant-quality profile in this submarket — average credit score on applications, eviction rate, late-payment / NSF rate, and stable-employment percentage? A property-management company in the area should have these aggregated.
- How much new for-sale + rental construction is in the pipeline within 1–3 miles? Heavy new supply typically softens prices + rents 12–24 months out; constrained supply supports both.
Investment metrics
- 1% rule
- 0.92% ✗
- Cap rate
- 7.52%
- Cash-on-cash
- 4.37%
- DSCR
- 1.19
- GRM
- 9.0
CMA / ARV
No comps found within radius.
Projected returns pro-forma
-3.0% appreciation · 2.64% rent growth · sell at horizon
- IRR
- -9.9%
- Equity multiple
- 0.64×
- Total profit
- $-18,039
- Equity at exit
- $26,724
- IRR
- -1.0%
- Equity multiple
- 0.93×
- Total profit
- $-3,329
- Equity at exit
- $15,497
Cash invested: $50,185 (down + closing). Projections, not guarantees.
Landlord ↔ Tenant lean methodology
- Overall (STATE)
- 62 Landlord-Friendly
- State Michigan
- 62 Landlord-Friendly · EVEN
- County
- — inherits STATE
- City
- — inherits STATE
ZIP-level market 49504
- Rents YoY
- 2.6%
- Active inventory
- 153
- Price-to-rent
- 9.0×
Monthly cashflow live
- Estimated rent
- $1,654 high interval (Pro) →
- Mortgage (P&I)
- −$940
- Tax from tax record
- −$109 /mo · $1,314/yr
- Insurance
- −$75
- HOA
- −$0
- Vacancy / Maint / Mgmt
- −$347
- Net cashflow
- $183
Break-even live
UW: 25.0% down · 7.5% · 30yr · 1.5% tax · 5.0% vac · 8.0% maint · 8.0% mgmt
Financing live
Cash to close
- Down payment
- $44,808
- Closing costs
- $5,377
- Reserves months
- —
- Total cash needed
- —
Loan-product check · same deal, 3 products live
Conventional
25% down · 7.5% · 30yr
- Down + closing
- —
- Monthly P&I
- —
- Monthly cashflow
- —
- DSCR
- —
- Eligible?
- —
Personal DTI + credit; lowest rate.
DSCR
20% down · 8.5% · 30yr
- Down + closing
- —
- Monthly P&I
- —
- Monthly cashflow
- —
- DSCR
- —
- Eligible?
- —
No personal income docs; deal must DSCR.
Hard money
10% down · 12.0% · 12mo
- Down + closing
- —
- Monthly P&I
- —
- Monthly cashflow
- —
- DSCR
- —
- Eligible?
- —
Short-term bridge; refi at stabilization.
Rent comps 40 comps
| Address | Beds | Baths | Sqft | Rent | $/sqft | DOM | Units | Dist |
|---|---|---|---|---|---|---|---|---|
| 745 Stocking Ave NW Grand Rapids, MI | 1.0–2.0 | 1.0 | 879 | $1,541 | $1.75 | 14d | 3 | 0.23mi |
| 608 Bridge St NW Grand Rapids, MI | 2.0 | 1.0 | 1100 | $1,595 | $1.45 | 43d | 1 | 0.42mi |
| 745 Jackson St NW Grand Rapids, MI | 2.0 | 1.0 | 800 | $1,625 | $2.03 | 43d | 1 | 0.43mi |
| 1205 Bridge St NW Unit C Grand Rapids, MI | 3.0 | 1.0 | 850 | $1,900 | $2.24 | 43d | 1 | 0.46mi |
| 1205 Bridge St NW Unit B Grand Rapids, MI | 1.0 | 1.0 | 550 | $1,500 | $2.73 | 43d | 1 | 0.46mi |
| 555 7th St NW Grand Rapids, MI | 2.0–4.0 | 2.0 | 547 | $640 | $1.17 | 43d | 6 | 0.47mi |
| 200 Gold Ave NW Grand Rapids, MI | 3.0 | 1.0 | 1112 | $1,549 | $1.39 | 43d | 1 | 0.53mi |
| 600 Broadway Ave NW Grand Rapids, MI | 1.0 | 1.0–2.0 | 952 | $2,450 | $2.57 | 44d | 2 | 0.54mi |
| 600 Broadway Ave NW Grand Rapids, MI | 1.0 | 1.0–2.0 | 952 | $2,438 | $2.56 | 43d | 2 | 0.54mi |
| 1004 Jennette Ave NW Grand Rapids, MI | 3.0 | 1.0 | 1000 | $1,025 | $1.02 | 43d | 1 | 0.55mi |
| 1011 Jennette Ave NW Unit 2 Grand Rapids, MI | 2.0 | 1.0 | 720 | $1,450 | $2.01 | 43d | 1 | 0.56mi |
| 1019 Widdicomb Ave NW Unit 2 Grand Rapids, MI | 2.0 | 1.0 | 1000 | $1,575 | $1.57 | 43d | 1 | 0.58mi |
| 417 6th St NW Unit 1346768P Grand Rapids, MI | 2.0 | 1.0 | 742 | $2,794 | $3.77 | 43d | 1 | 0.59mi |
| 814 Broadway Ave NW Grand Rapids, MI | 1.0 | 1.0 | 900 | $1,100 | $1.22 | 43d | 1 | 0.62mi |
| 601 Lake Michigan Dr NW Unit 601-208 Grand Rapids, MI | 1.0 | 1.0 | 585 | $1,600 | $2.74 | 43d | 1 | 0.62mi |
| 601 Lake Michigan Dr NW Unit 601-403 Grand Rapids, MI | 2.0 | 1.0 | 1100 | $2,150 | $1.95 | 43d | 1 | 0.62mi |
| 149 Valley Ave NW Unit 1346766P Grand Rapids, MI | 2.0 | 1.0 | 893 | $2,566 | $2.87 | 23d | 1 | 0.66mi |
| 1044 Muskegon Ave NW Unit 2 Grand Rapids, MI | 3.0 | 1.0 | 1100 | $1,800 | $1.64 | 43d | 1 | 0.68mi |
| 900 Leonard St NW Grand Rapids, MI | 2.0 | 1.0–2.0 | 720 | $2,850 | $3.96 | 2d | 10 | 0.76mi |
| 18 Indiana Ave SW Grand Rapids, MI | 2.0 | 1.0 | 1100 | $1,395 | $1.27 | 43d | 1 | 0.76mi |
| 18 Indiana Ave SW Unit 2 Grand Rapids, MI | 3.0 | 1.0 | 1000 | $1,295 | $1.29 | 43d | 1 | 0.76mi |
| 407 11th St NW Unit C Grand Rapids, MI | 2.0 | 1.0 | 772 | $1,500 | $1.94 | 43d | 1 | 0.78mi |
| 934 Hovey St SW Unit 2 Grand Rapids, MI | 2.0 | 1.0 | 850 | $1,195 | $1.41 | 43d | 1 | 0.79mi |
| 921 Watson St SW Unit 1 Grand Rapids, MI | 2.0 | 1.0 | 880 | $1,250 | $1.42 | 43d | 1 | 0.83mi |
| 918 Watson St SW Unit 2 Grand Rapids, MI | 1.0 | 1.0 | 600 | $950 | $1.58 | 43d | 1 | 0.86mi |
| 1046 Courtney St NW Unit 2 Grand Rapids, MI | 2.0 | 1.0 | 895 | $2,497 | $2.79 | 43d | 1 | 0.88mi |
| 710 Watson St SW Grand Rapids, MI | 2.0 | 1.0 | 700 | $1,275 | $1.82 | 43d | 1 | 0.89mi |
| 734 Crosby St NW Unit 1 Grand Rapids, MI | 3.0 | 1.0 | 1057 | $1,800 | $1.70 | 43d | 1 | 0.90mi |
| 974 Front Ave NW Apt 123 Grand Rapids, MI | 1.0 | 1.0 | 528 | $1,395 | $2.64 | 43d | 1 | 0.91mi |
| 974 Front Ave NW Apt 129 Grand Rapids, MI | 1.0 | 1.0 | 821 | $1,825 | $2.22 | 43d | 1 | 0.91mi |
| 974 Front Ave NW Apt 121 Grand Rapids, MI | 1.0 | 1.0 | 771 | $1,800 | $2.33 | 43d | 1 | 0.91mi |
| 974 Front Ave NW Apt 116 Grand Rapids, MI | 1.0 | 1.0 | 588 | $1,450 | $2.47 | 43d | 1 | 0.91mi |
| 201 Michigan St NW Grand Rapids, MI | 1.0–2.0 | 1.0–2.0 | 981 | $2,800 | $2.85 | 43d | 10 | 0.91mi |
| 601 Bond Ave NW Grand Rapids, MI | 1.0–2.0 | 1.0–2.0 | 853 | $2,565 | $3.01 | 43d | 10 | 0.94mi |
| 1326 Leonard St NW Unit 12 Grand Rapids, MI | 1.0 | 1.0 | 600 | $1,050 | $1.75 | 43d | 1 | 0.96mi |
| 1047 Park St SW Unit 1 Grand Rapids, MI | 2.0 | 1.0 | 950 | $1,325 | $1.39 | 43d | 1 | 0.97mi |
| 139 Pearl St NW Unit 201 Grand Rapids, MI | 2.0 | 1.0 | 769 | $1,650 | $2.15 | 43d | 1 | 1.06mi |
| 139 Pearl St NW Unit 204 Grand Rapids, MI | 1.0 | 1.0 | 700 | $1,500 | $2.14 | 43d | 1 | 1.06mi |
| 1335 Hamilton Ave NW Unit 2 Grand Rapids, MI | 3.0 | 1.0 | 1124 | $1,395 | $1.24 | 43d | 1 | 1.06mi |
| 701 Fairview Ave NE Grand Rapids, MI | 1.0 | 1.0 | 1000 | $1,300 | $1.30 | 43d | 1 | 1.14mi |
Listing history 48 events
-
2026-06-18days on market $179,231 Active 21 DOM
-
2026-06-17days on market $179,231 Active 20 DOM
-
2026-06-16days on market $179,231 Active 19 DOM
-
2026-06-15days on market $179,231 Active 18 DOM
-
2026-06-14days on market $179,231 Active 16 DOM
-
2026-06-13days on market $179,231 Active 15 DOM
-
2026-06-10days on market $179,231 Active 13 DOM
-
2026-06-09days on market $179,231 Active 12 DOM
-
2026-06-08days on market $179,231 Active 11 DOM
-
2026-06-07days on market $179,231 Active 10 DOM
-
2026-06-05days on market $179,231 Active 7 DOM
-
2026-06-03days on market $179,231 Active 6 DOM
-
2026-06-03days on market $179,231 Active 5 DOM
-
2026-06-01pricedays on market $179,231 Active 4 DOM
Show marketing remark (336 chars)
Nice 2 bedroom 1 bath home, ideal for owner occupancy or investor looking to expand their portfolio. The home and yard are in nice condition. Prime location with easy access to the expressways, close to downtown and near shopping, restaurants and schools. This property combines convenience with charm. Upstair level is esitmated SQ FT.
-
2026-05-31days on market $179,230 Active 3 DOM
-
2026-05-06price $189,230 336-char remark
-
2026-05-06price $189,230 336-char remark
-
2026-05-05price $189,230
-
2026-03-24$200,000 Active 336-char remark
-
2026-03-24$200,000 Active 336-char remark
-
2026-03-24$200,000 Active
-
2025-04-22historical
-
2025-01-02$189,230 Active
-
2025-01-02$189,230 Active
-
2015-02-10historical
-
2015-02-10historical
-
2014-02-12soldstatus $7,500
-
2014-02-12soldstatus $7,500
-
2013-08-27$12,900
-
2013-08-27$12,900
-
2013-01-15soldstatus $18,500
-
2013-01-15soldstatus $18,500
-
2012-12-20$24,900
-
2012-12-20$24,900
-
2012-12-07soldstatus $6,700
-
2012-12-07soldstatus $6,700
-
2012-07-11$9,995
-
2012-07-11$9,995
-
2011-11-09historical
-
2011-04-11historical
-
2011-04-04$9,995
-
2011-04-04$9,995
-
2010-12-24$12,900
-
2010-12-24$12,900
-
2010-03-31soldstatus $9,500
-
2010-03-31soldstatus $9,500
-
2009-12-16$9,999
-
2009-12-16$9,999
ⓘ Source: listings_history table (triggers on properties + properties_extension) + one-shot
backfill from property_details.listing_events for pre-trigger history.
Tax reassessment forecast MI · Partial reset (capped growth)
- Current annual tax
- $1,314 · $109/mo
- Projected year-2 tax
- $2,037 · $170/mo
- Expected delta
- +$723/yr (+$60/mo · 55.1%)
ⓘ Screening estimate from a state-policy table — verify with the county assessor before closing.
Climate risk First Street
- Flood 4/10 Moderate FEMA zone X (shaded) · 22% chance over 30 yrs
- Wildfire 1/10 Low
- Heat 2/10 Low 7 d/yr ≥96°F today · 16 d/yr by 30 yrs out
- Wind 2/10 Low
- Air quality 3/10 Moderate 2 unhealthy d/yr today · 3 by 30 yrs out
Nearby sold comps map
Loading sold comps map…
Walkable amenities ~0.75 mi
Loading nearby amenities…
Taxation est. · year 1
- Rental income
- $19,852
- − Mortgage interest
- −$10,040
- − Property taxes
- −$1,314
- − Insurance
- −$896
- − Repairs & maintenance
- −$1,588
- − Management
- −$1,588
- − Depreciation
- −$5,214
- Taxable loss
- −$788
- Est. tax savings @ 24.0%
- +$189
- After-tax cash flow
- $2,383/yr
For passive investors: Depreciation is non-cash, so a rental often shows a tax loss while cash-flowing — sheltering income. Rental losses are passive: they offset passive income freely, and up to $25,000/yr can offset ordinary (W-2) income if you actively participate and your MAGI is under $100k (phasing out to $0 by $150k); unused losses carry forward. On sale, claimed depreciation is recaptured at up to 25%, and gains may owe capital-gains tax (a 1031 exchange can defer both). Figures are a year-1 estimate at your 24.0% rate — not tax advice; consult a CPA.
Schools (NCES district)
- District
- Grand Rapids Public Schools
- NCES district ID
- 2616440
- Math proficiency
- 15% ▼ -5.00%
- Reading proficiency
- 29% ▼ -1.00%
- Median HH income
- $40,612
- Composite
- 18.62/100
- National rank
- #8899
- State rank
- #451 of 540 in MI
Livability — Grand Rapids
- Score
- 83/100
- State rank
- #44
- US rank
- #939
Category grades
Schools grade is shown separately in the Schools card above.
Census & demographics
- Census place
- Grand Rapids, MI
- County
- Kent County · 533,805 people
- City population
- 181,325
- Metro
- Grand Rapids-Kentwood, MI
- Population (ZIP)
- 40,036
- Household income
- $70,119
- Rent vs Own
- Severe rent burden
- 2132.0
Population outlook (Kent County) Hauer SSP2
- Today (2025)
- 712,484 people
- By 2030
- 748,618 · +5.1%
- By 2040
- 814,777 · +14.4%
- By 2050
- 868,556 · +21.9%
- By 2075
- 966,487 · +35.7%
- By 2100
- 967,975 · +35.9%
Race, ethnicity, and origin ACS 2023
- Neighborhood character
- Predominantly White (70%)
- Race & ethnicity
- White 70% Hispanic / Latino 16% Two or more races 10% Black 8% Asian 2%
- Hispanic origin (detail)
- Mexican 12% Puerto Rican 1%
- Common ancestry
- Romanian 11% Iranian 10% Lithuanian 3%
- Foreign-born
- 8% · Canada, South Korea, China
- Languages at home
- 88% English-only · Spanish 9% Other Indo-European 1%
Political lean MEDSL · Kent
- 2024 margin
- Lean D (+5.4) · D 51.8% · R 46.5% · Other 1.7%
- 2008→2024 swing
- +4.8pp toward D · 2008: 0.5pp · 2024: 5.4pp
- All cycles
- 2024: D+5.4 2020: D+6.1 2016: R+3.1 2012: R+7.9 2008: D+0.5
Not yet ingested
- Civics
- —
Market trends
- HPI YoY
- ▼ -274.76%
- Current HPI
- 313.231
- Rent YoY
- ▲ 2.64%
- Metro
- Grand Rapids-Kentwood, MI
- State GDP YoY
- ▲ 1.37%
- F500 in state
- 28
Industry mix (Fortune 500 HQ in MI)
| Industry | F500 HQs | Revenue |
|---|---|---|
| Automotive Parts | 3 | $48B |
|
||
| Automotive | 2 | $372B |
|
||
| Chemicals | 1 | $45B |
|
||
| Automotive Retail | 1 | $29B |
|
||
| Healthcare / Medical Devices | 1 | $23B |
|
||
| Automotive Technology | 1 | $20B |
|
||
Price history
+1692.5% since first listed40 events — show timeline
- 2026-06-01 Price Changed $179,231 MiRealSource-MiMLS
- 2026-06-01 Price Changed $179,231 REALCOMP
- 2026-06-01 Price Changed $179,231 SW Michigan MLS
- 2026-05-28 Listing Removed — MiRealSource-MiMLS
- 2026-05-28 Listed $179,230 SW Michigan MLS
- 2026-05-28 Listed $179,230 REALCOMP
- 2026-05-28 Listed $179,230 MiRealSource-MiMLS
- 2026-05-27 Listing Removed — REALCOMP
- 2026-05-06 Price Changed $189,230 MiRealSource-MiMLS
- 2026-05-06 Price Changed $189,230 REALCOMP
- 2026-05-05 Price Changed $189,230 SW Michigan MLS
- 2026-03-24 Listed $200,000 REALCOMP
- 2026-03-24 Listed $200,000 MiRealSource-MiMLS
- 2025-04-22 Listing Removed — MiRealSource-MiMLS
- 2025-01-02 Listed $189,230 REALCOMP
- 2025-01-02 Listed $189,230 MiRealSource-MiMLS
- 2015-02-10 Listing Removed — SW Michigan MLS
- 2015-02-10 Listing Removed — SW Michigan MLS
- 2014-02-12 Sold (MLS) $7,500 REALCOMP
- 2014-02-12 Sold (MLS) $7,500 SW Michigan MLS
- 2013-08-27 Listed $12,900 REALCOMP
- 2013-08-27 Listed $12,900 SW Michigan MLS
- 2013-01-15 Sold (MLS) $18,500 REALCOMP
- 2013-01-15 Sold (MLS) $18,500 SW Michigan MLS
- 2012-12-20 Listed $24,900 REALCOMP
- 2012-12-20 Listed $24,900 SW Michigan MLS
- 2012-12-07 Sold (MLS) $6,700 REALCOMP
- 2012-12-07 Sold (MLS) $6,700 SW Michigan MLS
- 2012-07-11 Listed $9,995 REALCOMP
- 2012-07-11 Listed $9,995 SW Michigan MLS
- 2011-11-09 Listing Removed — REALCOMP
- 2011-04-11 Listing Removed — REALCOMP
- 2011-04-04 Listed $9,995 REALCOMP
- 2011-04-04 Listed $9,995 SW Michigan MLS
- 2010-12-24 Listed $12,900 REALCOMP
- 2010-12-24 Listed $12,900 SW Michigan MLS
- 2010-03-31 Sold (MLS) $9,500 REALCOMP
- 2010-03-31 Sold (MLS) $9,500 SW Michigan MLS
- 2009-12-16 Listed $9,999 REALCOMP
- 2009-12-16 Listed $9,999 SW Michigan MLS
Property tax history
+12.8%/yrLatest (2025): $1,314 · +85.6% YoY. Source: county tax records.
Cash-flow waterfall
monthlySold comps — $/sqft
last 12 mo · ≤1 miLoading sold comps…