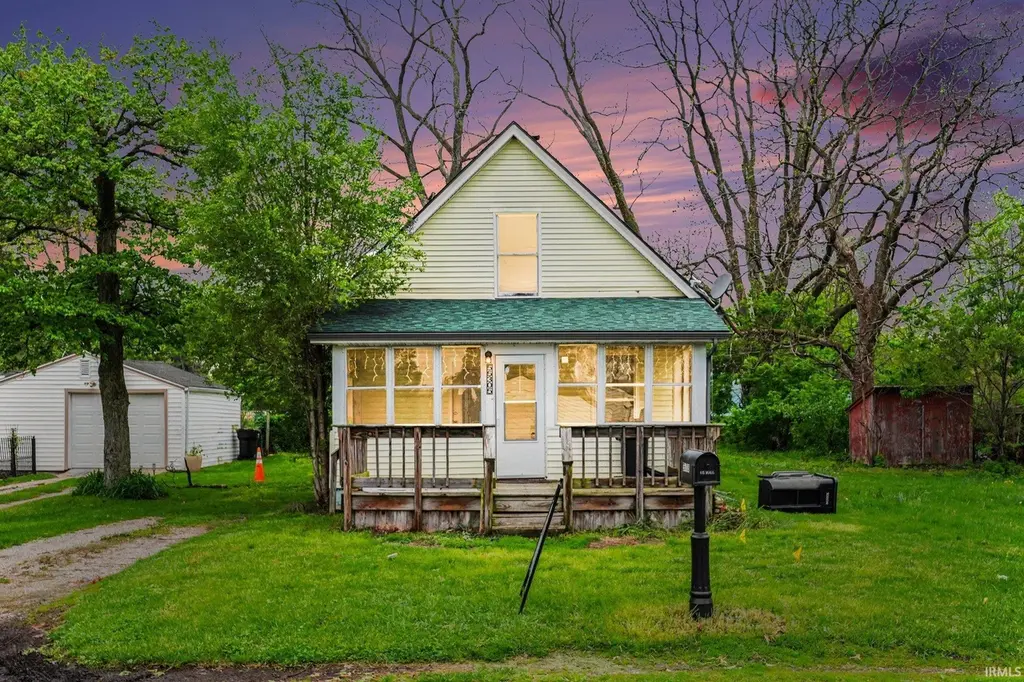
55305 Woodland Ave · Ardmore, IN
Flood risk 1/10 · Minimal
- FEMA flood zone
- X (unshaded)
- Chance of flooding over 30 yrs
- 0.0%
- Est. flood insurance / yr
- $473 – $860
Fire risk 1/10 · Minimal
- Est. fire insurance / yr
- $717 – $1,331
Heat risk 2/10 · Minimal
- Hot days now (above 99°F)
- 7 days/yr
- Hot days in 30 yrs
- 16 days/yr
Wind risk 2/10 · Minimal
- Chance of severe wind over 30 yrs
- —
Air-quality risk 3/10 · Minor
- Unhealthy air days now
- 3 days/yr
- Unhealthy air days in 30 yrs
- 3 days/yr
Risk factors via First Street. Map © Google.
Why this score? — see what drove the F grade
The composite is a weighted blend of 9 inputs, each scored 0–100. Each bar is that input's sub-score; the figure is the points it added to the 100-point composite (weight × sub-score).
- Cash flow +9.7/30.0
- ARV discount +5.1/15.0
- Rent growth +4.2/5.0
- DSCR +2.7/10.0
- 1% rule +2.6/10.0
- Livability +2.5/5.0
- Condition / age +2.5/5.0
- Schools +1.4/10.0
- Appreciation +0.0/10.0
$159,900
🖨 Deal sheet (PDF) 📄 Offer letter ✓ Due diligence
Listing remarks MLS
Don’t miss this updated 4 bedroom and 2 full bathroom home on a spacious lot. This home features a large eat-in kitchen with new cabinets/countertops/appliances, main floor laundry, new flooring throughout the house, and lots of space for entertaining. Enclosed porch and deck in front of the home. This home won’t last long, so call for a showing today!
Key facts
- 0.49 acre lot
- Built 2007
- Listed 52 days
Property features AI
Exterior
- Utilities: Private well water; Septic tank
- Home design: Single-family, site-built home; Single-story
- Construction: Aluminum siding; Brick/mortar foundation; Built as a site-built residence
- Exterior features: Enclosed porch; Deck; Corner lot
Interior
- Kitchen: Dishwasher; Microwave; Refrigerator; Gas oven; Eat-in kitchen
- Bedrooms: Master bedroom located on the main level
- Flooring: Laminate flooring
- Bathrooms: 2 full bathrooms (both on the main level)
- Heating & cooling: Central air; Ceiling fans; Natural gas forced air heating
- Interior features: Eat-in kitchen; Laminate counters; Master suite on the main level; Blinds; Partial, unfinished basement
- Laundry & utility: Washer and dryer included; Laundry on the main level; Water softener (owned); Gas water heater
Neighborhood map
What this means for you Summary
Snapshot
- This is a 3-bed/1.5-bath single-family listed at $160k.
Deal economics
- At list price, monthly cash flow is $-105 ($-1k/yr) — negative.
- To cash-flow at today's rent, offer at most $141k (11.6% below list).
- To meet the 1% rule (rent ≥ 1% of price), the offer needs to be $121k (24.4% below list).
- Recommended offer: $121k (24.4% below list) — sets the bar for 1% rule.
Location & tenants
- Location reads: area grade F — affects rentability + tenant quality, not the cash-flow math above.
- South Bend Community School Corporation (urban): math 12% / reading 21% proficiency, ranked #284 of 301 in IN (top 94%) — low school quality limits family demand, transient renter base, plan for 1-2y turnover; 66% free/reduced lunch — lower-income household profile, screen leases tightly.
- Zoned schools: Coquillard Elementary School (math 2% / reading 2%, grade F, #989 of 994 statewide, top 100%, 343 students, 89% FRL); Dickinson Fine Arts Academy (math 0% / reading 5%, grade F, #329 of 330 statewide, top 100%, 449 students, 86% FRL); Washington High School (math 12% / reading 42%, grade F, #315 of 369 statewide, top 86%, 834 students, 79% FRL) — zoned schools average 85% FRL vs 66% district-wide (18 pts higher); higher-poverty schools than district average — tighter screening recommended.
- Market conditions: Rents rising fast (+6.8%/yr); 429 active listings in the ZIP; 13 comparable units currently listed for rent nearby; rentals at typical pace (median 23d on market — plan ~3-4 weeks tenant-placement turnaround); 46% of comp listings sitting > 30 days — soft ceiling on asking rent; 754 units permitted in St. Joseph County in 2024 (460 in 5+ unit buildings).
Forward outlook
- Local home prices are declining (-3.0%/yr); year-one equity from $1k of loan paydown is wiped out by about $5k of value loss. Plan a longer hold.
Negotiation context
- It's been on market 52 days — a 3% lower offer ($155k) is reasonable based on typical stale-listing flexibility.
- 3 sale attempts since 9y ago with the ask held roughly flat each time — persistent listings suggest the price (not the market) is what's stuck; bring a comps-based counter.
- Current owner paid $105k; list at $160k implies a 52% gain — meaningful room to come down on a strong offer.
Questions for the listing agent
- What do current leases actually rent for vs. the listed asking? Can we see a recent rent roll and the last 12 months of T-12 income?
- It's been on market 52 days. Have you received any prior offers? Is the seller open to a 24% concession, seller financing, or rate buy-down credit?
- Is there a deadline driving the sale (1031 exchange, divorce, estate, relocation)? That informs how much negotiation room exists.
- The area grade is low — what's the realistic commute time and amenity access for the typical tenant pool here? Any planned neighborhood developments (good or bad) we should know about?
- What's the average days-on-market for RENTAL listings here right now (not sales)? A rising rental-DOM trend means longer vacancies and softer asking-rent achievability than the comps imply.
- What's the recent tenant-quality profile in this submarket — average credit score on applications, eviction rate, late-payment / NSF rate, and stable-employment percentage? A property-management company in the area should have these aggregated.
- How much new for-sale + rental construction is in the pipeline within 1–3 miles? Heavy new supply typically softens prices + rents 12–24 months out; constrained supply supports both.
Investment metrics
- 1% rule
- 0.76% ✗
- Cap rate
- 5.50%
- Cash-on-cash
- -2.81%
- DSCR
- 0.87
- GRM
- 11.0
CMA / ARV
- ARV (median comp)
- $151,745
- List price
- $159,900
- Delta
- 5.37%
- Verdict
- FAIR
- Comps
- 20 within 1.0 mi
Show comp detail 10 sales within ~0.75 mi
| Address | Dist | Beds/Ba | Sqft | Sold | Price | $/sf | Match |
|---|---|---|---|---|---|---|---|
| 55219 Lexington Ave | 0.26mi | 2/1.0 (-1) | 880 (+2%) | 0mo | $82,750,000 | $94,034 | 78 |
| 1339 Canterbury Dr | 0.25mi | 3/1.0 | 864 (0%) | 11mo | $180,000 | $208 | 77 |
| 932 Sussex Dr | 0.18mi | 3/1.0 | 900 (+4%) | 13mo | $160,500 | $178 | 72 |
| 55453 Grandview Ave | 0.20mi | 2/1.0 (-1) | 864 (0%) | 20mo | $99,000 | $115 | 66 |
| 1413 N Wellington St | 0.54mi | 3/1.0 | 924 (+7%) | 0mo | $170,000 | $184 | 61 |
| 3615 Elwood Ave | 0.51mi | 3/1.0 | 864 (0%) | 19mo | $152,500 | $177 | 58 |
| 3929 W Lincoln Way | 0.41mi | 2/1.0 (-1) | 775 (-10%) | 4mo | $82,000 | $106 | 53 |
| 1117 N Iowa St | 0.63mi | 2/1.0 (-1) | 864 (0%) | 24mo | $110,000 | $127 | 44 |
| 3815 Ardmore Trl | 0.35mi | 2/1.0 (-1) | 962 (+11%) | 18mo | $128,008 | $133 | 43 |
| 1130 N Kentucky St | 0.72mi | 2/1.0 (-1) | 816 (-6%) | 12mo | $85,000 | $104 | 41 |
Match score weights: distance 35% · size 25% · config 20% · recency 20%. Top-matched comps best support the ARV.
Projected returns pro-forma
-3.0% appreciation · 6.78% rent growth · sell at horizon
- IRR
- -17.0%
- Equity multiple
- 0.38×
- Total profit
- $-27,833
- Equity at exit
- $23,842
- IRR
- -3.4%
- Equity multiple
- 0.74×
- Total profit
- $-11,703
- Equity at exit
- $13,825
Cash invested: $44,772 (down + closing). Projections, not guarantees.
Landlord ↔ Tenant lean methodology
- Overall (STATE)
- 90 Strongly Landlord-Friendly
- State Indiana
- 90 Strongly Landlord-Friendly · R+11
- County
- — inherits STATE
- City
- — inherits STATE
ZIP-level market 46628
- Rents YoY
- 6.8%
- Active inventory
- 429
- Price-to-rent
- 11.0×
Monthly cashflow live
- Estimated rent
- $1,210 high interval (Pro) →
- Mortgage (P&I)
- −$839
- Tax from tax record
- −$155 /mo · $1,865/yr
- Insurance
- −$67
- HOA
- −$0
- Vacancy / Maint / Mgmt
- −$254
- Net cashflow
- $-105
Break-even live
Sensitivity live
| Price | -10% $-14 | -5% $-60 | +0% $-105 | +5% $-150 | +10% $-196 |
|---|---|---|---|---|---|
| Rent | -10% $-201 | -5% $-153 | +0% $-105 | +5% $-57 | +10% $-9 |
| Rate | -1.0pp $-24 | -0.5pp $-64 | base $-105 | +0.5pp $-146 | +1.0pp $-189 |
UW: 25.0% down · 7.5% · 30yr · 1.5% tax · 5.0% vac · 8.0% maint · 8.0% mgmt
Financing live
Cash to close
- Down payment
- $39,975
- Closing costs
- $4,797
- Reserves months
- —
- Total cash needed
- —
Loan-product check · same deal, 3 products live
Conventional
25% down · 7.5% · 30yr
- Down + closing
- —
- Monthly P&I
- —
- Monthly cashflow
- —
- DSCR
- —
- Eligible?
- —
Personal DTI + credit; lowest rate.
DSCR
20% down · 8.5% · 30yr
- Down + closing
- —
- Monthly P&I
- —
- Monthly cashflow
- —
- DSCR
- —
- Eligible?
- —
No personal income docs; deal must DSCR.
Hard money
10% down · 12.0% · 12mo
- Down + closing
- —
- Monthly P&I
- —
- Monthly cashflow
- —
- DSCR
- —
- Eligible?
- —
Short-term bridge; refi at stabilization.
Rent comps 13 comps
| Address | Beds | Baths | Sqft | Rent | $/sqft | DOM | Units | Dist |
|---|---|---|---|---|---|---|---|---|
| 202 N Chicago St South Bend, IN | 2.0 | 1.0 | 720 | $1,055 | $1.47 | 45d | 1 | 0.88mi |
| 2823 Calhoun St South Bend, IN | 2.0 | 1.0 | 720 | $1,249 | $1.73 | 45d | 1 | 0.98mi |
| 4510 W Washington St South Bend, IN | 2.0 | 1.0 | 720 | $1,039 | $1.44 | 45d | 1 | 1.05mi |
| 1141 Fremont St South Bend, IN | 3.0 | 1.0 | 760 | $1,100 | $1.45 | 23d | 1 | 1.19mi |
| 1614 Fremont St South Bend, IN | 2.0 | 1.0 | 720 | $850 | $1.18 | 23d | 1 | 1.30mi |
| 1046 N Elmer St South Bend, IN | 2.0 | 1.0 | 1050 | $1,025 | $0.98 | 23d | 1 | 1.33mi |
| 729 N Elmer St South Bend, IN | 2.0 | 1.0 | 672 | $1,100 | $1.64 | 15d | 1 | 1.35mi |
| 421 S Lake St South Bend, IN | 2.0 | 1.0 | 900 | $1,200 | $1.33 | 45d | 1 | 1.37mi |
| 2417 Linden Ave South Bend, IN | 2.0 | 1.0 | 1000 | $1,200 | $1.20 | 45d | 1 | 1.38mi |
| 717 Huey St South Bend, IN | 2.0 | 1.0 | 672 | $1,050 | $1.56 | 45d | 1 | 1.41mi |
| 1505 Huey St South Bend, IN | 3.0 | 1.0 | 864 | $1,425 | $1.65 | 23d | 1 | 1.42mi |
| 208 S Bendix Dr South Bend, IN | 3.0 | 1.0 | 864 | $1,150 | $1.33 | 23d | 1 | 1.45mi |
| 1709 Huey St South Bend, IN | 2.0 | 1.0 | 720 | $995 | $1.38 | 23d | 1 | 1.49mi |
Listing history 21 events
-
2026-06-22days on market $159,900 Active 52 DOM
-
2026-06-18days on market $159,900 Active 49 DOM
-
2026-06-17days on market $159,900 Active 48 DOM
-
2026-06-16days on market $159,900 Active 47 DOM
-
2026-06-15days on market $159,900 Active 46 DOM
-
2026-06-14days on market $159,900 Active 44 DOM
-
2026-06-13days on market $159,900 Active 43 DOM
-
2026-06-10days on market $159,900 Active 41 DOM
-
2026-06-09days on market $159,900 Active 40 DOM
-
2026-06-08days on market $159,900 Active 39 DOM
-
2026-06-07days on market $159,900 Active 38 DOM
-
2026-06-03days on market $159,900 Active 34 DOM
-
2026-06-02days on market $159,900 Active 33 DOM
-
2026-06-01days on market $159,900 Active 32 DOM
-
2026-05-31days on market $159,900 Active 31 DOM
-
2026-05-30days on market $159,900 Active 30 DOM
-
2026-04-30$159,900 Active 787-char remark
-
2018-11-09soldstatus $105,000 366-char remark
Show marketing remark (366 chars)
Don’t miss this updated 4 bedroom and 2 full bathroom home on a spacious lot. This home features a large eat-in kitchen with new cabinets/countertops/appliances, main floor laundry, new flooring throughout the house, and lots of space for entertaining. Enclosed porch and deck in front of the home. This home won’t last long, so call for a showing today!
-
2018-07-20$103,000 366-char remark
Show marketing remark (366 chars)
Don’t miss this updated 4 bedroom and 2 full bathroom home on a spacious lot. This home features a large eat-in kitchen with new cabinets/countertops/appliances, main floor laundry, new flooring throughout the house, and lots of space for entertaining. Enclosed porch and deck in front of the home. This home won’t last long, so call for a showing today!
-
2018-02-06soldstatus $24,800
Show marketing remark (254 chars)
Take a look at this 3 bedroom 2 bathroom home located on the cities west side within seconds to the South Bend International Airport. With some love and imagination this could be just the home you've been waiting for. Call today to schedule your showing.
-
2017-12-27$26,000
Show marketing remark (254 chars)
Take a look at this 3 bedroom 2 bathroom home located on the cities west side within seconds to the South Bend International Airport. With some love and imagination this could be just the home you've been waiting for. Call today to schedule your showing.
ⓘ Source: listings_history table (triggers on properties + properties_extension) + one-shot
backfill from property_details.listing_events for pre-trigger history.
Tax reassessment forecast IN · Partial reset (capped growth)
- Current annual tax
- $1,865 · $155/mo
- Projected year-2 tax
- $1,865 · $155/mo
- Expected delta
- $0/yr ($0/mo · 0.0%)
ⓘ Screening estimate from a state-policy table — verify with the county assessor before closing.
Climate risk First Street
- Flood 1/10 Low FEMA zone X (unshaded) · 0% chance over 30 yrs
- Wildfire 1/10 Low
- Heat 2/10 Low 7 d/yr ≥99°F today · 16 d/yr by 30 yrs out
- Wind 2/10 Low
- Air quality 3/10 Moderate 3 unhealthy d/yr today · 3 by 30 yrs out
Nearby sold comps map
Loading sold comps map…
Walkable amenities ~0.75 mi
Loading nearby amenities…
Taxation est. · year 1
- Rental income
- $14,515
- − Mortgage interest
- −$8,957
- − Property taxes
- −$1,865
- − Insurance
- −$800
- − Repairs & maintenance
- −$1,161
- − Management
- −$1,161
- − Depreciation
- −$4,652
- Taxable loss
- −$4,080
- Est. tax savings @ 24.0%
- +$979
- After-tax cash flow
- $-281/yr
For passive investors: Depreciation is non-cash, so a rental often shows a tax loss while cash-flowing — sheltering income. Rental losses are passive: they offset passive income freely, and up to $25,000/yr can offset ordinary (W-2) income if you actively participate and your MAGI is under $100k (phasing out to $0 by $150k); unused losses carry forward. On sale, claimed depreciation is recaptured at up to 25%, and gains may owe capital-gains tax (a 1031 exchange can defer both). Figures are a year-1 estimate at your 24.0% rate — not tax advice; consult a CPA.
Schools (NCES district)
- District
- South Bend Community School Corporation
- NCES district ID
- 1810290
- Math proficiency
- 12% ▼ -10.00%
- Reading proficiency
- 21% ▼ -6.00%
- Median HH income
- $41,935
- Composite
- 14.21/100
- National rank
- #9452
- State rank
- #284 of 301 in IN
Livability — Ardmore
No livability data for this city. (Only ~50 U.S. cities are tracked.)
Census & demographics
- Census place
- Ardmore, IN
- County
- Saint Joseph County · 189,048 people
- Metro
- South Bend-Mishawaka, IN-MI
- Population (ZIP)
- 27,685
- Household income
- $61,759
- Rent vs Own
- Severe rent burden
- 1024.0
Population outlook (St. Joseph County) Hauer SSP2
- Today (2025)
- 273,186 people
- By 2030
- 273,594 · +0.1%
- By 2040
- 271,641 · -0.6%
- By 2050
- 269,187 · -1.5%
- By 2075
- 263,136 · -3.7%
- By 2100
- 245,659 · -10.1%
Race, ethnicity, and origin ACS 2023
- Neighborhood character
- Diverse neighborhood (Simpson 0.60)
- Race & ethnicity
- White 55% Black 30% Hispanic / Latino 10% Two or more races 8%
- Hispanic origin (detail)
- Mexican 8%
- Common ancestry
- Romanian 12% Lithuanian 1% Slovak 1%
- Foreign-born
- 7% · Canada, China
- Languages at home
- 89% English-only · Spanish 7% Russian/Polish/Slavic 1%
Political lean MEDSL · St. Joseph
- 2024 margin
- Toss-up / Even · D 50.0% · R 48.5% · Other 1.5%
- 2008→2024 swing
- -15.6pp toward R · 2008: 17.1pp · 2024: 1.5pp
- All cycles
- 2024: D+1.5 2020: D+5.8 2016: D+0.2 2012: D+3.5 2008: D+17.1
Not yet ingested
- Civics
- —
Market trends
- HPI YoY
- ▼ -130.47%
- Current HPI
- 202.112
- Rent YoY
- ▲ 6.78%
- Metro
- South Bend-Mishawaka, IN-MI
- State GDP YoY
- ▲ 2.90%
- F500 in state
- 18
Industry mix (Fortune 500 HQ in IN)
| Industry | F500 HQs | Revenue |
|---|---|---|
| Industrial Machinery | 2 | $37B |
|
||
| Healthcare | 1 | $177B |
|
||
| Pharmaceuticals | 1 | $45B |
|
||
| Metals / Steel | 1 | $18B |
|
||
| Agriculture | 1 | $17B |
|
||
| Packaging | 1 | $12B |
|
||
Price history
+515.0% since first listed5 events — show timeline
- 2026-04-30 Listed $159,900 IRMLS
- 2018-11-09 Sold (MLS) $105,000 IRMLS
- 2018-07-20 Listed $103,000 IRMLS
- 2018-02-06 Sold (MLS) $24,800 IRMLS
- 2017-12-27 Listed $26,000 IRMLS
Property tax history
+6.3%/yrLatest (2025): $1,865 · -5.8% YoY. Source: county tax records.
Cash-flow waterfall
monthlySold comps — $/sqft
last 12 mo · ≤1 miLoading sold comps…