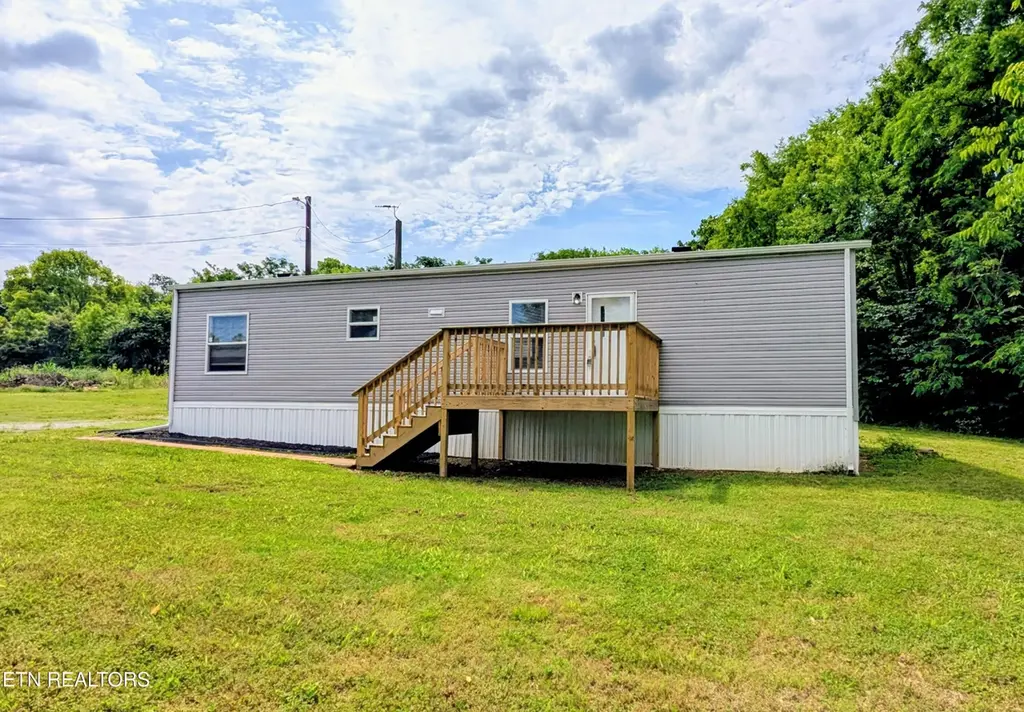
203 Pettit St · Vonore, TN
Flood risk 1/10 · Minimal
- FEMA flood zone
- X (unshaded)
- Chance of flooding over 30 yrs
- 0.0%
- Est. flood insurance / yr
- $473 – $860
Fire risk 4/10 · Minor
- Est. fire insurance / yr
- $949 – $1,763
Heat risk 6/10 · Moderate
- Hot days now (above 105°F)
- 7 days/yr
- Hot days in 30 yrs
- 21 days/yr
Wind risk 2/10 · Minimal
- Chance of severe wind over 30 yrs
- —
Air-quality risk 3/10 · Minor
- Unhealthy air days now
- 3 days/yr
- Unhealthy air days in 30 yrs
- 3 days/yr
Risk factors via First Street. Map © Google.
Why this score? — see what drove the C- grade
The composite is a weighted blend of 9 inputs, each scored 0–100. Each bar is that input's sub-score; the figure is the points it added to the 100-point composite (weight × sub-score).
- Cash flow +21.6/30.0
- ARV discount +7.5/15.0
- DSCR +6.9/10.0
- 1% rule +4.4/10.0
- Livability +3.0/5.0
- Rent growth +2.5/5.0
- Condition / age +2.5/5.0
- Schools +1.8/10.0
- Appreciation +0.0/10.0
$169,000
🖨 Deal sheet 📄 Offer letter ✓ Due diligence
Listing remarks MLS
Completely Remodeled and Move-In Ready for Under $170,000! Affordable homes this nice are hard to find. Located in the city limits of Vonore, this beautifully updated 2-bedroom, 1-bath manufactured home offers a light, bright, and airy open-concept floor plan with modern finishes throughout. The spacious kitchen features brand-new appliances, including a refrigerator, dishwasher, and range, plus a beautiful wood-top island perfect for gathering and everyday living. Situated on a level 0.20-acre lot with a nice front and backyard, this property offers city conveniences and easy access to local amenities. Enjoy nearby Tellico Lake, the Little Tennessee River, parks, boat launches, marinas, shopping, restaurants, and medical services. Conveniently located just off Highway 411, making commuting and daily errands a breeze. Whether you're a first-time buyer, downsizing, or looking for an affordable East Tennessee home, this turnkey property is ready for its next owner. Vacant and available for quick possession. Cash or conventional financing only.
Key facts
- Remodeled
- Brand new appliances
- Modern finishes
Tags
Property features AI
Exterior
- Parking: Other parking
- Utilities: Public sewer
- Home design: Single-family (not attached); Approximately 800 building area (owner provided)
- Construction: Vinyl siding; Other construction materials
- Exterior features: Level lot
Interior
- Kitchen: Dishwasher; Refrigerator
- Flooring: Laminate flooring
- Bathrooms: 1 full bathroom
- Heating & cooling: Central heating (electric); Central cooling
- Interior features: Total of 5 rooms; Dishwasher; Refrigerator
Neighborhood map
What this means for you Summary
Snapshot
- This is a 2-bed/1.0-bath manufactured listed at $169k.
Deal economics
- At list price, monthly cash flow is $257 ($3k/yr) — positive.
- The deal already cash-flows at list — no discount required.
- To meet the 1% rule (rent ≥ 1% of price), the offer needs to be $158k (6.2% below list).
- Recommended offer: $158k (6.2% below list) — sets the bar for 1% rule.
- Cap rate 8.1% vs local median 3.7% in Vonore — top-decile yield for the area; either an underpriced asset or a hidden risk that comps aren't pricing in. Stress-test before assuming the spread holds.
Location & tenants
- Location reads 59/100 on livability (#290 in TN) — a working-class tenant base; expect higher turnover. Strengths: cost of living A+, housing A; Watch: health & safety C-, employment D, schools F.
- Monroe County (rural): math 20% / reading 24% proficiency, ranked #106 of 139 in TN (top 76%) — low school quality limits family demand, transient renter base, plan for 1-2y turnover.
- Market conditions: 200 active listings in the ZIP; 157 units permitted in Monroe County in 2024 (0 in 5+ unit buildings).
Forward outlook
- Local home prices are declining (-3.0%/yr); year-one equity from $1k of loan paydown is wiped out by about $5k of value loss. Plan a longer hold.
Negotiation context
- It's been on market 15 days — a 2% lower offer ($166k) is reasonable based on typical stale-listing flexibility.
- 6 sale attempts since 2y ago with the ask held roughly flat each time — persistent listings suggest the price (not the market) is what's stuck; bring a comps-based counter.
- Current owner paid $105k; list at $169k implies a 61% gain — meaningful room to come down on a strong offer.
Risks & watch-outs
- Climate carrying-cost: extreme-heat days projected 7→21/yr by 2055 (HVAC capex compounding) — expect insurance premiums to compound above CPI over the hold.
Questions for the listing agent
- Is there a deadline driving the sale (1031 exchange, divorce, estate, relocation)? That informs how much negotiation room exists.
- Schools are F-rated, which usually means shorter tenancies and higher turnover. Who's the typical renter profile here, and what's been the actual vacancy rate?
- Crime grade is F in this area — have there been break-ins, vandalism, or insurance claims at this property in the last 3 years? What carrier currently insures it and at what premium?
- What's the average days-on-market for RENTAL listings here right now (not sales)? A rising rental-DOM trend means longer vacancies and softer asking-rent achievability than the comps imply.
- What's the recent tenant-quality profile in this submarket — average credit score on applications, eviction rate, late-payment / NSF rate, and stable-employment percentage? A property-management company in the area should have these aggregated.
- How much new for-sale + rental construction is in the pipeline within 1–3 miles? Heavy new supply typically softens prices + rents 12–24 months out; constrained supply supports both.
Investment metrics
- 1% rule
- 0.94% ✗
- Cap rate
- 8.12%
- Cash-on-cash
- 6.52%
- DSCR
- 1.29
- GRM
- 8.9
CMA / ARV
- ARV (on-the-fly)
- $99,072
- Comps found
- 1
Show comp detail 1 sale within ~0.75 mi
| Address | Dist | Beds/Ba | Sqft | Sold | Price | $/sf | Match |
|---|---|---|---|---|---|---|---|
| 608 Old Slag Rd | 0.55mi | 3/2.0 (+1) | 840 (+9%) | 14mo | $108,000 | $129 | 38 |
Match score weights: distance 35% · size 25% · config 20% · recency 20%. Top-matched comps best support the ARV.
Projected returns pro-forma
-3.0% appreciation · 3.0% rent growth · sell at horizon
- IRR
- -6.3%
- Equity multiple
- 0.77×
- Total profit
- $-11,087
- Equity at exit
- $25,198
- IRR
- 3.3%
- Equity multiple
- 1.23×
- Total profit
- $11,103
- Equity at exit
- $14,612
Cash invested: $47,320 (down + closing). Projections, not guarantees.
Landlord ↔ Tenant lean methodology
- Overall (STATE)
- 87 Strongly Landlord-Friendly
- State Tennessee
- 87 Strongly Landlord-Friendly · R+13
- County
- — inherits STATE
- City
- — inherits STATE
ZIP-level market 37885
- Home prices YoY
- -7.8%
- Active inventory
- 200
- Price-to-rent
- 8.9×
Monthly cashflow live
- Estimated rent
- $1,585 medium interval (Pro) →
- Mortgage (P&I)
- −$886
- Tax from tax record
- −$38 /mo · $459/yr
- Insurance
- −$70
- HOA
- −$0
- Vacancy / Maint / Mgmt
- −$333
- Net cashflow
- $257
Break-even live
UW: 25.0% down · 7.5% · 30yr · 1.5% tax · 5.0% vac · 8.0% maint · 8.0% mgmt
Financing live
Cash to close
- Down payment
- $42,250
- Closing costs
- $5,070
- Reserves months
- —
- Total cash needed
- —
Loan-product check · same deal, 3 products live
Conventional
25% down · 7.5% · 30yr
- Down + closing
- —
- Monthly P&I
- —
- Monthly cashflow
- —
- DSCR
- —
- Eligible?
- —
Personal DTI + credit; lowest rate.
DSCR
20% down · 8.5% · 30yr
- Down + closing
- —
- Monthly P&I
- —
- Monthly cashflow
- —
- DSCR
- —
- Eligible?
- —
No personal income docs; deal must DSCR.
Hard money
10% down · 12.0% · 12mo
- Down + closing
- —
- Monthly P&I
- —
- Monthly cashflow
- —
- DSCR
- —
- Eligible?
- —
Short-term bridge; refi at stabilization.
Listing history 12 events
-
2026-06-18days on market $169,000 Active 15 DOM
-
2026-06-17days on market $169,000 Active 14 DOM
-
2026-06-16days on market $169,000 Active 13 DOM
-
2026-06-15days on market $169,000 Active 12 DOM
-
2026-06-14days on market $169,000 Active 10 DOM
-
2026-06-13days on market $169,000 Active 9 DOM
-
2026-06-10days on market $169,000 Active 7 DOM
-
2026-06-09days on market $169,000 Active 6 DOM
-
2026-06-08days on market $169,000 Active 5 DOM
-
2026-06-07days on market $169,000 Active 4 DOM
-
2026-06-05remarks 699-char remark
-
2026-06-05$169,000 Active 1 DOM
ⓘ Source: listings_history table (triggers on properties + properties_extension) + one-shot
backfill from property_details.listing_events for pre-trigger history.
Tax reassessment forecast TN · Resets to sale price
- Current annual tax
- $459 · $38/mo
- Projected year-2 tax
- $1,200 · $100/mo
- Expected delta
- +$741/yr (+$62/mo · 161.4%)
ⓘ Screening estimate from a state-policy table — verify with the county assessor before closing.
Climate risk First Street
- Flood 1/10 Low FEMA zone X (unshaded) · 0% chance over 30 yrs
- Wildfire 4/10 Moderate
- Heat 6/10 Major 7 d/yr ≥105°F today · 21 d/yr by 30 yrs out
- Wind 2/10 Low
- Air quality 3/10 Moderate 3 unhealthy d/yr today · 3 by 30 yrs out
Nearby sold comps map
Loading sold comps map…
Walkable amenities ~0.75 mi
Loading nearby amenities…
Taxation est. · year 1
- Rental income
- $19,019
- − Mortgage interest
- −$9,467
- − Property taxes
- −$459
- − Insurance
- −$845
- − Repairs & maintenance
- −$1,522
- − Management
- −$1,522
- − Depreciation
- −$4,916
- Taxable income
- $289
- Est. tax owed @ 24.0%
- −$69
- After-tax cash flow
- $3,017/yr
For passive investors: Depreciation is non-cash, so a rental often shows a tax loss while cash-flowing — sheltering income. Rental losses are passive: they offset passive income freely, and up to $25,000/yr can offset ordinary (W-2) income if you actively participate and your MAGI is under $100k (phasing out to $0 by $150k); unused losses carry forward. On sale, claimed depreciation is recaptured at up to 25%, and gains may owe capital-gains tax (a 1031 exchange can defer both). Figures are a year-1 estimate at your 24.0% rate — not tax advice; consult a CPA.
Schools (NCES district)
- District
- Monroe County
- NCES district ID
- 4703000
- Math proficiency
- 20% ▼ -8.00%
- Reading proficiency
- 24% ▼ -6.00%
- Median HH income
- $36,701
- Composite
- 18.29/100
- National rank
- #8956
- State rank
- #106 of 139 in TN
Livability — Vonore
- Score
- 59/100
- State rank
- #290
- US rank
- #20399
Category grades
Schools grade is shown separately in the Schools card above.
Census & demographics
- Census place
- Vonore, TN
- Population (ZIP)
- 6,120
Population outlook (Monroe County) Hauer SSP2
- Today (2025)
- 47,571 people
- By 2030
- 48,155 · +1.2%
- By 2040
- 48,772 · +2.5%
- By 2050
- 48,698 · +2.4%
- By 2075
- 48,558 · +2.1%
- By 2100
- 47,543 · -0.1%
Race, ethnicity, and origin ACS 2023
- Neighborhood character
- Predominantly White (93%)
- Race & ethnicity
- White 93% Black 3% Two or more races 2% Hispanic / Latino 1%
- Common ancestry
- Romanian 3% Slovak 3% Lithuanian 2%
- Foreign-born
- 2% · Canada
- Languages at home
- 96% English-only · Spanish 2% Arabic 1%
Political lean MEDSL · Monroe
- 2024 margin
- Solid R (+66.8) · D 16.2% · R 83.0%
- 2008→2024 swing
- -28.5pp toward R · 2008: -38.3pp · 2024: -66.8pp
- All cycles
- 2024: R+66.8 2020: R+62.6 2016: R+59.7 2012: R+45.0 2008: R+38.3
Not yet ingested
- Civics
- —
Market trends
- HPI YoY
- ▼ -18.41%
- Current HPI
- 216.947
- Rent YoY
- —
- Metro
- —
- State GDP YoY
- ▲ 2.78%
- F500 in state
- 22
Industry mix (Fortune 500 HQ in TN)
| Industry | F500 HQs | Revenue |
|---|---|---|
| Healthcare | 3 | $91B |
|
||
| Retail | 3 | $72B |
|
||
| Transportation / Logistics | 1 | $88B |
|
||
| Paper / Packaging | 1 | $19B |
|
||
| Insurance | 1 | $13B |
|
||
| Energy | 1 | $12B |
|
||
Price history
+2314.3% since first listed14 events — show timeline
- 2026-06-03 Listed $169,000 Knoxville MLS
- 2026-06-03 Listed $169,000 GSMAR
- 2025-05-19 Sold (MLS) $105,000 Knoxville MLS
- 2025-05-19 Sold (MLS) $105,000 REALTRACS as Distributed by MLS Grid
- 2025-04-17 Pending — Knoxville MLS
- 2025-03-24 Listed $124,900 Knoxville MLS
- 2024-11-17 Listing Removed — Knoxville MLS
- 2024-11-04 Listed $105,000 Knoxville MLS
- 2024-09-30 Listing Removed — Knoxville MLS
- 2024-09-04 Listed $124,900 Knoxville MLS
- 2024-08-30 Listing Removed — Knoxville MLS
- 2024-08-22 Price Changed $124,900 Knoxville MLS
- 2024-08-04 Listed $130,000 Knoxville MLS
- 1994-11-01 Sold (Public Records) $7,000 Public Records
Property tax history
+19.4%/yrLatest (2025): $459 · +19.2% YoY. Source: county tax records.
Cash-flow waterfall
monthlySold comps — $/sqft
last 12 mo · ≤1 miLoading sold comps…