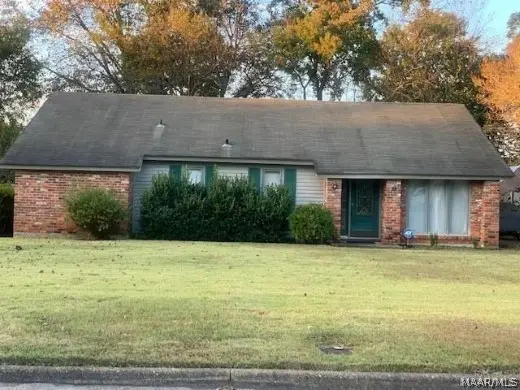
695 Burbank Ct · Montgomery, AL
Flood risk 1/10 · Minimal
- FEMA flood zone
- X (unshaded)
- Chance of flooding over 30 yrs
- 0.0%
- Est. flood insurance / yr
- $507 – $1,088
Fire risk 4/10 · Minor
- Est. fire insurance / yr
- $916 – $1,700
Heat risk 8/10 · Major
- Hot days now (above 107°F)
- 7 days/yr
- Hot days in 30 yrs
- 20 days/yr
Wind risk 8/10 · Major
- Chance of severe wind over 30 yrs
- 80.0%
Air-quality risk 4/10 · Minor
- Unhealthy air days now
- 4 days/yr
- Unhealthy air days in 30 yrs
- 5 days/yr
Risk factors via First Street. Map © Google.
Why this score? — see what drove the C grade
The composite is a weighted blend of 9 inputs, each scored 0–100. Each bar is that input's sub-score; the figure is the points it added to the 100-point composite (weight × sub-score).
- Cash flow +22.1/30.0
- ARV discount +12.6/15.0
- DSCR +7.1/10.0
- 1% rule +4.6/10.0
- Rent growth +3.2/5.0
- Livability +3.2/5.0
- Condition / age +2.5/5.0
- Schools +1.7/10.0
- Appreciation +0.0/10.0
$169,900
🖨 Deal sheet 📄 Offer letter ✓ Due diligence
Listing remarks MLS
Please come view this lovely spacious 4 bedroom 2 bath home located in a cul-da-sac. It has a nice foyer when you enter, a separate dining room, a large great room with a fireplace, a separate breakfast nook, a nice size den, covered back patio, nice size back yard that is fenced in.
Key facts
- Formal dining room
- Quiet cul-de-sac
- Cozy fireplace
Tags
Property features AI
Finance
- Other: Annual tax amount available
Exterior
- Parking: Driveway
- Security: Fully fenced
- Utilities: Cable available; Electricity available; Natural gas available; Public water; Public sewer
- Home design: Single-story home; City lot
- Construction: Brick and vinyl siding exterior; Slab foundation; Built (year per public records)
- Exterior features: Covered patio; Covered porch; Fully fenced yard; Porch
Interior
- Kitchen: Dishwasher; Refrigerator
- Bedrooms: Bedrooms on the first floor (3 total)
- Flooring: Plank; Vinyl
- Bathrooms: 2 full bathrooms
- Heating & cooling: Heat pump for heating and cooling
- Interior features: Plank and vinyl flooring; One fireplace
- Laundry & utility: Electric water heater
Neighborhood map
What this means for you Summary
Snapshot
- This is a 4-bed/2.0-bath single-family listed at $170k.
Deal economics
- At list price, monthly cash flow is $273 ($3k/yr) — positive.
- The deal already cash-flows at list — no discount required.
- To meet the 1% rule (rent ≥ 1% of price), the offer needs to be $164k (3.7% below list).
- Recommended offer: $164k (3.7% below list) — sets the bar for 1% rule.
- Cap rate 8.2% vs local median 6.0% in Montgomery — top-decile yield for the area; either an underpriced asset or a hidden risk that comps aren't pricing in. Stress-test before assuming the spread holds.
Location & tenants
- Location reads 65/100 on livability (#138 in AL) — a middle-class / working-renter tenant base. Strengths: cost of living A+, housing A+; Watch: schools C-, employment D, crime F.
- Montgomery County (urban): math 9% / reading 31% proficiency, ranked #106 of 129 in AL (top 82%) — low school quality limits family demand, transient renter base, plan for 1-2y turnover; 70% free/reduced lunch — lower-income household profile, screen leases tightly.
- Market conditions: Rents rising (+3.0%/yr); 407 active listings in the ZIP; 25 comparable units currently listed for rent nearby; rentals at typical pace (median 21d on market — plan ~3-4 weeks tenant-placement turnaround); 460 units permitted in Montgomery County in 2024 (37 in 5+ unit buildings).
Forward outlook
- Local home prices are declining (-3.0%/yr); year-one equity from $1k of loan paydown is wiped out by about $5k of value loss. Plan a longer hold.
- Montgomery County population projected to shrink 8% by 2050 — rents likely to lag national; underwrite the cash flow, not the appreciation.
Negotiation context
- It's been on market 17 days — a 2% lower offer ($167k) is reasonable based on typical stale-listing flexibility.
- 5 sale attempts since 28y ago with the ask held roughly flat each time — persistent listings suggest the price (not the market) is what's stuck; bring a comps-based counter.
- Current owner paid $115k; 48% above their basis — modest negotiation headroom, anchor on the comps not their cost.
Risks & watch-outs
- Climate carrying-cost: severe wind risk, 80% chance of damaging wind over 30y; extreme-heat days projected 7→20/yr by 2055 (HVAC capex compounding) — expect insurance premiums to compound above CPI over the hold.
Questions for the listing agent
- Built in 1975 — when were the roof, HVAC, electrical panel, plumbing, and water heater last replaced?
- Is there a deadline driving the sale (1031 exchange, divorce, estate, relocation)? That informs how much negotiation room exists.
- Crime grade is F in this area — have there been break-ins, vandalism, or insurance claims at this property in the last 3 years? What carrier currently insures it and at what premium?
- What's the average days-on-market for RENTAL listings here right now (not sales)? A rising rental-DOM trend means longer vacancies and softer asking-rent achievability than the comps imply.
- What's the recent tenant-quality profile in this submarket — average credit score on applications, eviction rate, late-payment / NSF rate, and stable-employment percentage? A property-management company in the area should have these aggregated.
- How much new for-sale + rental construction is in the pipeline within 1–3 miles? Heavy new supply typically softens prices + rents 12–24 months out; constrained supply supports both.
Investment metrics
- 1% rule
- 0.96% ✗
- Cap rate
- 8.22%
- Cash-on-cash
- 6.90%
- DSCR
- 1.31
- GRM
- 8.7
CMA / ARV
- ARV (on-the-fly)
- $191,808
- Comps found
- 12
Show comp detail 12 sales within ~0.75 mi
| Address | Dist | Beds/Ba | Sqft | Sold | Price | $/sf | Match |
|---|---|---|---|---|---|---|---|
| 709 Balfour Rd | 0.26mi | 4/3.0 | 1,860 (-7%) | 6mo | $160,000 | $86 | 67 |
| 341 Crest Hill Dr | 0.24mi | 4/2.0 | 2,144 (+7%) | 14mo | $206,000 | $96 | 65 |
| 415 Stroll Dr | 0.26mi | 4/2.0 | 1,710 (-14%) | 0mo | $175,900 | $103 | 63 |
| 402 Stroll Dr | 0.32mi | 3/2.0 (-1) | 1,905 (-5%) | 17mo | $150,000 | $79 | 58 |
| 816 Rialto Dr | 0.52mi | 3/3.0 (-1) | 1,974 (-1%) | 9mo | $169,900 | $86 | 57 |
| 6213 Lycoming Rd | 0.55mi | 3/2.0 (-1) | 1,852 (-7%) | 1mo | $154,000 | $83 | 57 |
| 5845 Ainsworth Dr | 0.28mi | 4/3.0 | 1,832 (-8%) | 15mo | $138,500 | $76 | 56 |
| 749 Amity Ln | 0.41mi | 4/2.0 | 1,767 (-12%) | 8mo | $190,000 | $108 | 56 |
| 348 Sultan Ct | 0.32mi | 3/2.0 (-1) | 1,810 (-9%) | 12mo | $182,810 | $101 | 54 |
| 356 Kroy Dr | 0.38mi | 5/2.0 (+1) | 1,848 (-8%) | 14mo | $184,500 | $100 | 53 |
| 402 Mulligan Dr | 0.37mi | 3/2.0 (-1) | 1,742 (-13%) | 10mo | $142,000 | $82 | 48 |
| 541 Dunbarton Rd | 0.39mi | 5/2.5 (+1) | 2,200 (+10%) | 14mo | $218,000 | $99 | 46 |
Match score weights: distance 35% · size 25% · config 20% · recency 20%. Top-matched comps best support the ARV.
Projected returns pro-forma
-3.0% appreciation · 2.99% rent growth · sell at horizon
- IRR
- -5.8%
- Equity multiple
- 0.79×
- Total profit
- $-10,202
- Equity at exit
- $25,333
- IRR
- 3.8%
- Equity multiple
- 1.28×
- Total profit
- $13,188
- Equity at exit
- $14,690
Cash invested: $47,572 (down + closing). Projections, not guarantees.
Landlord ↔ Tenant lean methodology
- Overall (STATE)
- 90 Strongly Landlord-Friendly
- State Alabama
- 90 Strongly Landlord-Friendly · R+15
- County
- — inherits STATE
- City
- — inherits STATE
ZIP-level market 36117
- Home prices YoY
- -20.0%
- Rents YoY
- 3.0%
- Active inventory
- 407
- Price-to-rent
- 8.7×
Monthly cashflow live
- Estimated rent
- $1,636 high interval (Pro) →
- Mortgage (P&I)
- −$891
- Tax from tax record
- −$57 /mo · $686/yr
- Insurance
- −$71
- HOA
- −$0
- Vacancy / Maint / Mgmt
- −$344
- Net cashflow
- $273
Break-even live
UW: 25.0% down · 7.5% · 30yr · 1.5% tax · 5.0% vac · 8.0% maint · 8.0% mgmt
Financing live
Cash to close
- Down payment
- $42,475
- Closing costs
- $5,097
- Reserves months
- —
- Total cash needed
- —
Loan-product check · same deal, 3 products live
Conventional
25% down · 7.5% · 30yr
- Down + closing
- —
- Monthly P&I
- —
- Monthly cashflow
- —
- DSCR
- —
- Eligible?
- —
Personal DTI + credit; lowest rate.
DSCR
20% down · 8.5% · 30yr
- Down + closing
- —
- Monthly P&I
- —
- Monthly cashflow
- —
- DSCR
- —
- Eligible?
- —
No personal income docs; deal must DSCR.
Hard money
10% down · 12.0% · 12mo
- Down + closing
- —
- Monthly P&I
- —
- Monthly cashflow
- —
- DSCR
- —
- Eligible?
- —
Short-term bridge; refi at stabilization.
Rent comps 25 comps
| Address | Beds | Baths | Sqft | Rent | $/sqft | DOM | Units | Dist |
|---|---|---|---|---|---|---|---|---|
| 341 N Burbank Dr Montgomery, AL | 5.0 | 2.0 | 1584 | $1,800 | $1.14 | 13d | 1 | 0.30mi |
| 5805 Hyde Park Dr Montgomery, AL | 3.0 | 2.0 | 1757 | $1,511 | $0.86 | 20d | 1 | 0.30mi |
| 457 Mulligan Dr Montgomery, AL | 3.0 | 2.0 | 1344 | $1,335 | $0.99 | 43d | 1 | 0.30mi |
| 438 Mulligan Dr Montgomery, AL | 4.0 | 2.0 | 1232 | $1,500 | $1.22 | 43d | 1 | 0.32mi |
| 5712 Roxboro Dr Montgomery, AL | 4.0 | 2.0 | 1544 | $1,450 | $0.94 | 20d | 1 | 0.33mi |
| 323 N Burbank Dr Montgomery, AL | 4.0 | 2.0 | 1584 | $1,381 | $0.87 | 13d | 1 | 0.34mi |
| 713 Amity Ln Montgomery, AL | 4.0 | 2.0 | 1696 | $1,900 | $1.12 | 43d | 1 | 0.35mi |
| 6265 Wares Ferry Rd Montgomery, AL | 3.0 | 2.0 | 1336 | $1,600 | $1.20 | 13d | 1 | 0.46mi |
| 428 Fieldbrook Dr Montgomery, AL | 3.0 | 1.5 | 1440 | $995 | $0.69 | 20d | 1 | 0.46mi |
| 6320 Burbank Crossing Loop Montgomery, AL | 3.0 | 2.0 | 1238 | $1,600 | $1.29 | 43d | 1 | 0.51mi |
| 241 Kroy Dr Montgomery, AL | 4.0 | 2.0 | 1450 | $1,195 | $0.82 | 43d | 1 | 0.52mi |
| 6265 Nature Dr Montgomery, AL | 3.0 | 2.0 | 1400 | $1,050 | $0.75 | 13d | 1 | 0.66mi |
| 5735 Sweet Meadow Dr Montgomery, AL | 3.0 | 2.0 | 1413 | $1,525 | $1.08 | 43d | 1 | 0.77mi |
| 535 Lawndale Ln Montgomery, AL | 4.0 | 1.5 | 1260 | $1,100 | $0.87 | 13d | 1 | 0.98mi |
| 633 Groveland Dr Montgomery, AL | 3.0 | 2.0 | 1424 | $1,200 | $0.84 | 43d | 1 | 1.06mi |
| 6409 Deerwood Pl Montgomery, AL | 3.0 | 2.0 | 1504 | $1,711 | $1.14 | 13d | 1 | 1.08mi |
| 6637 Ridgeview Cir Montgomery, AL | 3.0 | 2.5 | 1458 | $1,700 | $1.17 | 20d | 1 | 1.11mi |
| 605 Plantation Way Montgomery, AL | 4.0 | 2.0 | 1519 | $1,200 | $0.79 | 20d | 1 | 1.16mi |
| 6272 Deerwood Dr Montgomery, AL | 3.0 | 2.0 | 1754 | $1,785 | $1.02 | 13d | 1 | 1.17mi |
| 6272 Deerwood Dr Montgomery, AL | 3.0 | 2.0 | 1754 | $1,875 | $1.07 | 20d | 1 | 1.17mi |
| 6061 Karen Valley Cv Montgomery, AL | 3.0 | 2.0 | 1509 | $1,500 | $0.99 | 20d | 1 | 1.17mi |
| 564 Glade Park Loop Unit 1043856P Montgomery, AL | 4.0 | 2.0 | 1496 | $2,736 | $1.83 | 13d | 1 | 1.28mi |
| 529 Mitylene Dr Montgomery, AL | 3.0 | 2.0 | 1463 | $1,550 | $1.06 | 20d | 1 | 1.40mi |
| 6005 Tamarack Dr Montgomery, AL | 4.0 | 2.0 | 1617 | $1,650 | $1.02 | 43d | 1 | 1.41mi |
| 500 Eastdale Rd S Montgomery, AL | 1.0–3.0 | 1.0–2.5 | 1042 | $900 | $0.86 | 20d | 20 | 1.45mi |
Listing history 13 events
-
2026-06-18days on market $169,900 Active 17 DOM
-
2026-06-17days on market $169,900 Active 16 DOM
-
2026-06-16days on market $169,900 Active 15 DOM
-
2026-06-15days on market $169,900 Active 14 DOM
-
2026-06-14days on market $169,900 Active 12 DOM
-
2026-06-13days on market $169,900 Active 11 DOM
-
2026-06-10days on market $169,900 Active 9 DOM
-
2026-06-09days on market $169,900 Active 8 DOM
-
2026-06-08days on market $169,900 Active 7 DOM
-
2026-06-07days on market $169,900 Active 6 DOM
-
2026-06-03days on market $169,900 Active 2 DOM
-
2026-06-02remarks 681-char remark
-
2026-06-02$169,900 Active 1 DOM
ⓘ Source: listings_history table (triggers on properties + properties_extension) + one-shot
backfill from property_details.listing_events for pre-trigger history.
Tax reassessment forecast AL · Resets to sale price
- Current annual tax
- $686 · $57/mo
- Projected year-2 tax
- $697 · $58/mo
- Expected delta
- +$11/yr (+$1/mo · 1.6%)
ⓘ Screening estimate from a state-policy table — verify with the county assessor before closing.
Climate risk First Street
- Flood 1/10 Low FEMA zone X (unshaded) · 0% chance over 30 yrs
- Wildfire 4/10 Moderate
- Heat 8/10 Severe 7 d/yr ≥107°F today · 20 d/yr by 30 yrs out
- Wind 8/10 Severe 80% chance of damaging wind over 30 yrs
- Air quality 4/10 Moderate 4 unhealthy d/yr today · 5 by 30 yrs out
Nearby sold comps map
Loading sold comps map…
Walkable amenities ~0.75 mi
Loading nearby amenities…
Taxation est. · year 1
- Rental income
- $19,631
- − Mortgage interest
- −$9,517
- − Property taxes
- −$686
- − Insurance
- −$850
- − Repairs & maintenance
- −$1,570
- − Management
- −$1,570
- − Depreciation
- −$4,943
- Taxable income
- $495
- Est. tax owed @ 24.0%
- −$119
- After-tax cash flow
- $3,163/yr
For passive investors: Depreciation is non-cash, so a rental often shows a tax loss while cash-flowing — sheltering income. Rental losses are passive: they offset passive income freely, and up to $25,000/yr can offset ordinary (W-2) income if you actively participate and your MAGI is under $100k (phasing out to $0 by $150k); unused losses carry forward. On sale, claimed depreciation is recaptured at up to 25%, and gains may owe capital-gains tax (a 1031 exchange can defer both). Figures are a year-1 estimate at your 24.0% rate — not tax advice; consult a CPA.
Schools (NCES district)
- District
- Montgomery County
- NCES district ID
- 0102430
- Math proficiency
- 9% ▼ -21.00%
- Reading proficiency
- 31% ▼ -1.00%
- Median HH income
- $43,902
- Composite
- 17.24/100
- National rank
- #9093
- State rank
- #106 of 129 in AL
Livability — Montgomery
- Score
- 65/100
- State rank
- #138
- US rank
- #13416
Category grades
Schools grade is shown separately in the Schools card above.
Census & demographics
- Census place
- Montgomery, AL
- County
- Montgomery County · 190,016 people
- City population
- 175,913
- Metro
- Montgomery, AL
- Population (ZIP)
- 53,172
- Household income
- $74,720
- Rent vs Own
- Severe rent burden
- 1742.0
Population outlook (Montgomery County) Hauer SSP2
- Today (2025)
- 224,008 people
- By 2030
- 221,460 · -1.1%
- By 2040
- 214,179 · -4.4%
- By 2050
- 204,912 · -8.5%
- By 2075
- 177,821 · -20.6%
- By 2100
- 145,134 · -35.2%
Race, ethnicity, and origin ACS 2023
- Neighborhood character
- Diverse neighborhood (Simpson 0.60)
- Race & ethnicity
- Black 53% White 34% Asian 8% Two or more races 3% Hispanic / Latino 3%
- Common ancestry
- Italian 1% Slovak 1% Lithuanian 1%
- Foreign-born
- 9% · South Korea, Canada, China
- Languages at home
- 90% English-only · Korean 4% Spanish 3% Other Indo-European 1%
Political lean MEDSL · Montgomery
- 2024 margin
- Solid D (+30.7) · D 64.8% · R 34.1% · Other 1.1%
- 2008→2024 swing
- +11.5pp toward D · 2008: 19.2pp · 2024: 30.7pp
- All cycles
- 2024: D+30.7 2020: D+31.5 2016: D+26.2 2012: D+24.3 2008: D+19.2
Not yet ingested
- Civics
- —
Market trends
- HPI YoY
- ▼ -37.24%
- Current HPI
- 148.7728
- Rent YoY
- ▲ 2.99%
- Metro
- Montgomery, AL
- State GDP YoY
- ▲ 2.94%
- F500 in state
- 4
Industry mix (Fortune 500 HQ in AL)
| Industry | F500 HQs | Revenue |
|---|---|---|
| Financial Services | 1 | $8B |
|
||
| Healthcare | 1 | $5B |
|
||
Price history
+70.1% since first listed12 events — show timeline
- 2026-04-01 Listed $169,900 MAAR
- 2023-04-05 Pending — MAAR
- 2023-04-03 Sold (MLS) $115,000 MAAR
- 2023-03-01 Contingent — MAAR
- 2023-02-20 Relisted — MAAR
- 2023-02-13 Contingent — MAAR
- 2023-02-10 Price Changed $125,000 MAAR
- 2022-12-08 Price Changed $140,000 MAAR
- 2022-10-25 Listed $150,000 MAAR
- 2002-05-01 Sold (MLS) $97,200 MAAR
- 2002-03-05 Listed $94,900 MAAR
- 1998-08-18 Listed $99,900 MAAR
Property tax history
+6.3%/yrLatest (2025): $686 · -51.6% YoY. Source: county tax records.
Cash-flow waterfall
monthlySold comps — $/sqft
last 12 mo · ≤1 miLoading sold comps…