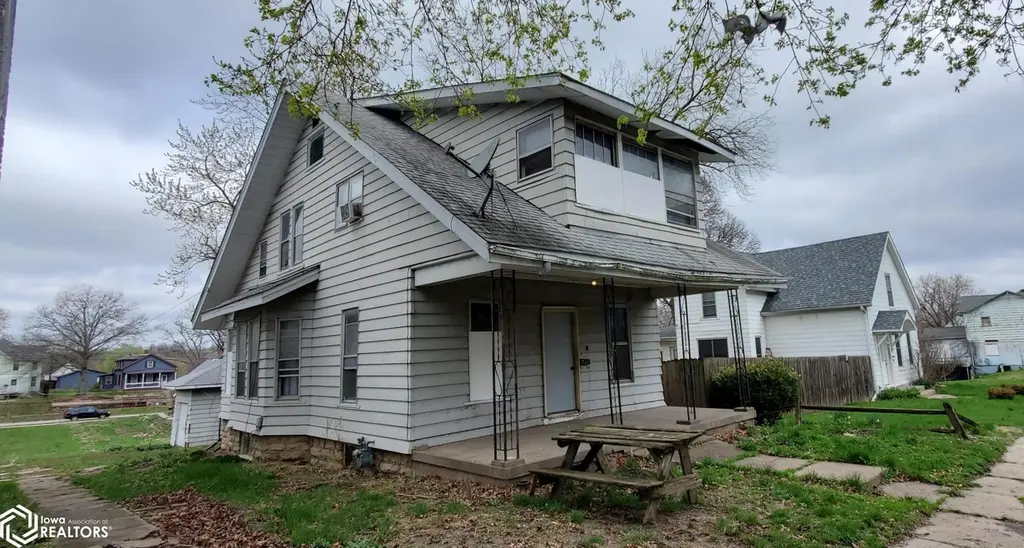
117 N Gunnison St · Burlington, IA
Flood risk 1/10 · Minimal
- FEMA flood zone
- X (unshaded)
- Chance of flooding over 30 yrs
- 0.0%
- Est. flood insurance / yr
- $473 – $860
Fire risk 1/10 · Minimal
- Est. fire insurance / yr
- $902 – $1,676
Heat risk 3/10 · Minor
- Hot days now (above 106°F)
- 7 days/yr
- Hot days in 30 yrs
- 16 days/yr
Wind risk 2/10 · Minimal
- Chance of severe wind over 30 yrs
- —
Air-quality risk 2/10 · Minimal
- Unhealthy air days now
- 0 days/yr
- Unhealthy air days in 30 yrs
- 1 days/yr
Risk factors via First Street. Map © Google.
Why this score? — see what drove the B grade
The composite is a weighted blend of 9 inputs, each scored 0–100. Each bar is that input's sub-score; the figure is the points it added to the 100-point composite (weight × sub-score).
- Cash flow +30.0/30.0
- 1% rule +10.0/10.0
- DSCR +10.0/10.0
- ARV discount +7.5/15.0
- Schools +4.0/10.0
- Livability +3.7/5.0
- Rent growth +2.5/5.0
- Condition / age +2.5/5.0
- Appreciation +0.0/10.0
$26,900
🖨 Deal sheet 📄 Offer letter ✓ Due diligence
Listing remarks MLS
This 3 bedroom home is an excellent opportunity for fix and flip, rental, or make it your own. Clean it out, make some repairs and updates, and you're set with this this solid property. Instant equity here, just make money, or make it your home. Priced to move, don't wait around.
Key facts
- 6,098 sq ft lot
- Garage
- Built 1913
Neighborhood map
What this means for you Summary
Snapshot
- This is a 3-bed/1.0-bath single-family listed at $27k.
Deal economics
- At list price, monthly cash flow is $628 ($8k/yr) — positive.
- The deal already cash-flows at list — no discount required.
- Meets the 1% rule at list price ($1k rent vs $27k).
- Recommended offer: $25k (6.0% below list) — sets the bar for market timing.
- Cap rate 34.3% vs local median 6.0% in Burlington — top-decile yield for the area; either an underpriced asset or a hidden risk that comps aren't pricing in. Stress-test before assuming the spread holds.
Location & tenants
- Location reads 73/100 on livability (#287 in IA) — a middle-class / working-renter tenant base. Strengths: cost of living A+, housing A+, health & safety A+; Watch: crime D+, employment D, amenities F.
- Burlington Community School District (town): math 42% / reading 54% proficiency, ranked #286 of 289 in IA (top 99%) — families likely to look elsewhere, expect single-tenant / working-renter base with shorter leases.
- Market conditions: 184 active listings in the ZIP; 2 comparable units currently listed for rent nearby; 53 units permitted in Des Moines County in 2024 (40 in 5+ unit buildings).
Forward outlook
- Local home prices are declining (-3.0%/yr); year-one equity from $186 of loan paydown is wiped out by about $807 of value loss. Plan a longer hold.
- Des Moines County population projected to shrink 6% by 2050 — rents likely to lag national; underwrite the cash flow, not the appreciation.
- At projected returns (-3.0% appreciation + 3.0% rent growth), your $8k cash investment doubles in ~2 years — after that, you're playing with house money.
Negotiation context
- It's been on market 66 days — a 6% lower offer ($25k) is reasonable based on typical stale-listing flexibility.
- 2 sale attempts since 12y ago with the ask held roughly flat each time — persistent listings suggest the price (not the market) is what's stuck; bring a comps-based counter.
- Current owner paid $20k; 38% above their basis — modest negotiation headroom, anchor on the comps not their cost.
Risks & watch-outs
- Watch-outs: property tax is 4.7% of price; built in 1913 — expect roof / HVAC / electrical / plumbing capex.
Questions for the listing agent
- It's been on market 66 days. Have you received any prior offers? Is the seller open to a 6% concession, seller financing, or rate buy-down credit?
- Built in 1913 — when were the roof, HVAC, electrical panel, plumbing, and water heater last replaced?
- Property tax is high relative to price — has the assessment been appealed recently, and will the sale trigger a re-assessment?
- Why hasn't it sold? Are there any deal-killer items the seller is aware of (foundation, flood, title, zoning, code violations)?
- Is there a deadline driving the sale (1031 exchange, divorce, estate, relocation)? That informs how much negotiation room exists.
- Crime grade is D in this area — have there been break-ins, vandalism, or insurance claims at this property in the last 3 years? What carrier currently insures it and at what premium?
- What's the average days-on-market for RENTAL listings here right now (not sales)? A rising rental-DOM trend means longer vacancies and softer asking-rent achievability than the comps imply.
- What's the recent tenant-quality profile in this submarket — average credit score on applications, eviction rate, late-payment / NSF rate, and stable-employment percentage? A property-management company in the area should have these aggregated.
- How much new for-sale + rental construction is in the pipeline within 1–3 miles? Heavy new supply typically softens prices + rents 12–24 months out; constrained supply supports both.
Investment metrics
- 1% rule
- 4.17% ✓
- Cap rate
- 34.30%
- Cash-on-cash
- 100.01%
- DSCR
- 5.45
- GRM
- 2.0
CMA / ARV
- ARV (median comp)
- $78,269
- List price
- $26,900
- Delta
- -65.63%
- Verdict
- UNDERPRICED
- Comps
- 20 within 1.0 mi
Show comp detail 12 sales within ~0.75 mi
| Address | Dist | Beds/Ba | Sqft | Sold | Price | $/sf | Match |
|---|---|---|---|---|---|---|---|
| 205 S Leebrick St | 0.22mi | 3/2.0 | 1,794 (+11%) | 1mo | $73,000 | $41 | 66 |
| 308 S Adams St | 0.30mi | 3/1.0 | 1,400 (-13%) | 4mo | $119,500 | $85 | 61 |
| 526 S Plane St S | 0.56mi | 3/2.0 | 1,652 (+2%) | 6mo | $77,000 | $47 | 61 |
| 902 N 9th St | 0.71mi | 3/— | 1,554 (-4%) | 1mo | $16,000 | $10 | 60 |
| 1039 Short St St | 0.67mi | 3/2.0 | 1,596 (-1%) | 7mo | $99,000 | $62 | 57 |
| 613 N Garfield Ave | 0.33mi | 3/1.0 | 1,380 (-14%) | 5mo | $160,000 | $116 | 56 |
| 526 S Central Ave | 0.62mi | 3/1.0 | 1,737 (+8%) | 4mo | $73,500 | $42 | 55 |
| 1821 Division St | 0.32mi | 2/1.0 (-1) | 1,383 (-14%) | 1mo | $99,500 | $72 | 55 |
| 241 S 9th St | 0.47mi | 3/1.0 | 1,386 (-14%) | 1mo | $1 | — | 54 |
| 506 N 8th St | 0.56mi | 2/1.0 (-1) | 1,495 (-7%) | 6mo | $19,000 | $13 | 52 |
| 410 S Starr Ave | 0.40mi | 3/1.5 | 1,382 (-14%) | 5mo | $30,000 | $22 | 51 |
| 809 S Starr Ave | 0.72mi | 3/2.0 | 1,382 (-14%) | 3mo | $99,900 | $72 | 36 |
Match score weights: distance 35% · size 25% · config 20% · recency 20%. Top-matched comps best support the ARV.
Projected returns pro-forma
-3.0% appreciation · 3.0% rent growth · sell at horizon
- IRR
- —
- Equity multiple
- 5.74×
- Total profit
- $35,682
- Equity at exit
- $4,011
- IRR
- —
- Equity multiple
- 11.99×
- Total profit
- $82,800
- Equity at exit
- $2,326
Cash invested: $7,532 (down + closing). Projections, not guarantees.
Landlord ↔ Tenant lean methodology
- Overall (STATE)
- 83 Strongly Landlord-Friendly
- State Iowa
- 83 Strongly Landlord-Friendly · R+6
- County
- — inherits STATE
- City
- — inherits STATE
ZIP-level market 52601
- Active inventory
- 184
- Price-to-rent
- 2.0×
Monthly cashflow live
- Estimated rent
- $1,121 medium interval (Pro) →
- Mortgage (P&I)
- −$141
- Tax from tax record
- −$105 /mo · $1,264/yr
- Insurance
- −$11
- HOA
- −$0
- Vacancy / Maint / Mgmt
- −$235
- Net cashflow
- $628
Break-even live
UW: 25.0% down · 7.5% · 30yr · 1.5% tax · 5.0% vac · 8.0% maint · 8.0% mgmt
Financing live
Cash to close
- Down payment
- $6,725
- Closing costs
- $807
- Reserves months
- —
- Total cash needed
- —
Loan-product check · same deal, 3 products live
Conventional
25% down · 7.5% · 30yr
- Down + closing
- —
- Monthly P&I
- —
- Monthly cashflow
- —
- DSCR
- —
- Eligible?
- —
Personal DTI + credit; lowest rate.
DSCR
20% down · 8.5% · 30yr
- Down + closing
- —
- Monthly P&I
- —
- Monthly cashflow
- —
- DSCR
- —
- Eligible?
- —
No personal income docs; deal must DSCR.
Hard money
10% down · 12.0% · 12mo
- Down + closing
- —
- Monthly P&I
- —
- Monthly cashflow
- —
- DSCR
- —
- Eligible?
- —
Short-term bridge; refi at stabilization.
Rent comps 2 comps
| Address | Beds | Baths | Sqft | Rent | $/sqft | DOM | Units | Dist |
|---|---|---|---|---|---|---|---|---|
| 1601 Division St Burlington, IA | 3.0 | 1.0 | 1440 | $1,100 | $0.76 | 43d | 1 | 0.25mi |
| 116 N 4th St Unit 214 Burlington, IA | 2.0 | 1.0 | 1205 | $1,295 | $1.07 | 43d | 1 | 0.75mi |
Listing history 19 events
-
2026-06-19days on market $26,900 Active 66 DOM
-
2026-06-18days on market $26,900 Active 65 DOM
-
2026-06-17days on market $26,900 Active 64 DOM
-
2026-06-16days on market $26,900 Active 63 DOM
-
2026-06-15days on market $26,900 Active 62 DOM
-
2026-06-14days on market $26,900 Active 60 DOM
-
2026-06-12days on market $26,900 Active 59 DOM
-
2026-06-09days on market $26,900 Active 56 DOM
-
2026-06-08days on market $26,900 Active 55 DOM
-
2026-06-07days on market $26,900 Active 54 DOM
-
2026-06-07days on market $26,900 Active 53 DOM
-
2026-06-03days on market $26,900 Active 50 DOM
-
2026-06-02days on market $26,900 Active 49 DOM
-
2026-06-01days on market $26,900 Active 48 DOM
-
2026-05-31days on market $26,900 Active 47 DOM
-
2026-05-30days on market $26,900 Active 46 DOM
-
2026-04-14$26,900 Active 280-char remark
Show marketing remark (280 chars)
This 3 bedroom home is an excellent opportunity for fix and flip, rental, or make it your own. Clean it out, make some repairs and updates, and you're set with this this solid property. Instant equity here, just make money, or make it your home. Priced to move, don't wait around.
-
2015-05-27soldstatus $19,500 96-char remark
Show marketing remark (96 chars)
Home is being sold as-is. Lots of natural woodwork and built-ins. Large rooms and deep back yard
-
2014-11-26$19,900 96-char remark
Show marketing remark (96 chars)
Home is being sold as-is. Lots of natural woodwork and built-ins. Large rooms and deep back yard
ⓘ Source: listings_history table (triggers on properties + properties_extension) + one-shot
backfill from property_details.listing_events for pre-trigger history.
Tax reassessment forecast IA · Partial reset (capped growth)
- Current annual tax
- $1,264 · $105/mo
- Projected year-2 tax
- $1,264 · $105/mo
- Expected delta
- $0/yr ($0/mo · 0.0%)
ⓘ Screening estimate from a state-policy table — verify with the county assessor before closing.
Climate risk First Street
- Flood 1/10 Low FEMA zone X (unshaded) · 0% chance over 30 yrs
- Wildfire 1/10 Low
- Heat 3/10 Moderate 7 d/yr ≥106°F today · 16 d/yr by 30 yrs out
- Wind 2/10 Low
- Air quality 2/10 Low 0 unhealthy d/yr today · 1 by 30 yrs out
Nearby sold comps map
Loading sold comps map…
Walkable amenities ~0.75 mi
Loading nearby amenities…
Taxation est. · year 1
- Rental income
- $13,448
- − Mortgage interest
- −$1,507
- − Property taxes
- −$1,264
- − Insurance
- −$134
- − Repairs & maintenance
- −$1,076
- − Management
- −$1,076
- − Depreciation
- −$783
- Taxable income
- $7,609
- Est. tax owed @ 24.0%
- −$1,826
- After-tax cash flow
- $5,707/yr
For passive investors: Depreciation is non-cash, so a rental often shows a tax loss while cash-flowing — sheltering income. Rental losses are passive: they offset passive income freely, and up to $25,000/yr can offset ordinary (W-2) income if you actively participate and your MAGI is under $100k (phasing out to $0 by $150k); unused losses carry forward. On sale, claimed depreciation is recaptured at up to 25%, and gains may owe capital-gains tax (a 1031 exchange can defer both). Figures are a year-1 estimate at your 24.0% rate — not tax advice; consult a CPA.
Schools (NCES district)
- District
- Burlington Community School District
- NCES district ID
- 1905790
- Math proficiency
- 42% ▼ -4.00%
- Reading proficiency
- 54% ▼ -1.00%
- Median HH income
- $41,833
- Composite
- 40.3/100
- National rank
- #3753
- State rank
- #286 of 289 in IA
Livability — Burlington
- Score
- 73/100
- State rank
- #287
- US rank
- #5540
Category grades
Schools grade is shown separately in the Schools card above.
Census & demographics
- Census place
- Burlington, IA
- County
- Des Moines County · 27,341 people
- City population
- 27,341
- Metro
- Burlington, IA-IL
- Population (ZIP)
- 27,341
- Household income
- $60,983
- Rent vs Own
- Severe rent burden
- 963.0
Population outlook (Des Moines County) Hauer SSP2
- Today (2025)
- 39,735 people
- By 2030
- 39,257 · -1.2%
- By 2040
- 38,090 · -4.1%
- By 2050
- 37,156 · -6.5%
- By 2075
- 36,905 · -7.1%
- By 2100
- 37,222 · -6.3%
Race, ethnicity, and origin ACS 2023
- Neighborhood character
- Predominantly White (83%)
- Race & ethnicity
- White 83% Two or more races 8% Black 5% Hispanic / Latino 4% Asian 1%
- Common ancestry
- Iranian 2% Lithuanian 2% Slovak 2%
- Foreign-born
- 3% · Canada
- Languages at home
- 95% English-only · Spanish 3% Other Asian/Pacific 1%
Political lean MEDSL · Des Moines
- 2024 margin
- R (+15.1) · D 41.8% · R 56.8% · Other 1.4%
- 2008→2024 swing
- -38.1pp toward R · 2008: 23.0pp · 2024: -15.1pp
- All cycles
- 2024: R+15.1 2020: R+8.5 2016: R+7.0 2012: D+18.5 2008: D+23.0
Not yet ingested
- Civics
- —
Market trends
- HPI YoY
- ▼ -83.48%
- Current HPI
- 149.7662
- Rent YoY
- —
- Metro
- Burlington, IA-IL
- State GDP YoY
- ▲ 2.48%
- F500 in state
- 4
Industry mix (Fortune 500 HQ in IA)
| Industry | F500 HQs | Revenue |
|---|---|---|
| Financial Services | 1 | $16B |
|
||
| Retail / Convenience | 1 | $15B |
|
||
Price history
+35.2% since first listed3 events — show timeline
- 2026-04-14 Listed $26,900 IAR
- 2015-05-27 Sold (MLS) $19,500 IAR
- 2014-11-26 Listed $19,900 IAR
Property tax history
+0.2%/yrLatest (2025): $1,264 · -36.6% YoY. Source: county tax records.
Cash-flow waterfall
monthlySold comps — $/sqft
last 12 mo · ≤1 miLoading sold comps…