 Multi-family
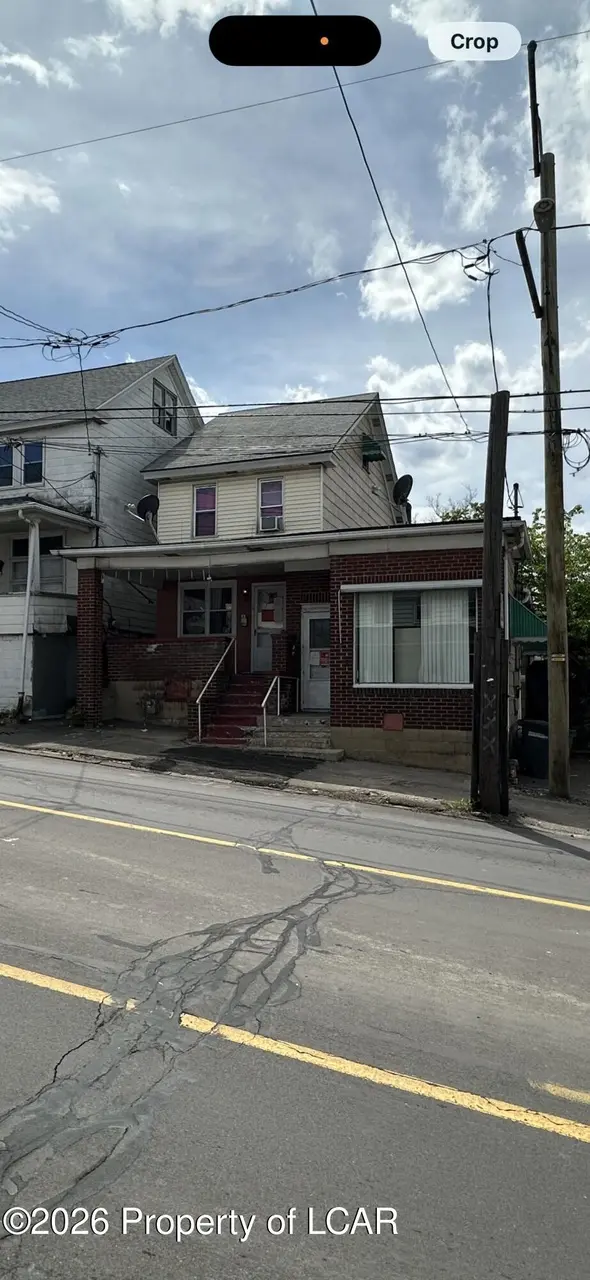
870 872 Church St · Hazleton, PA
Flood risk 1/10 · Minimal
- FEMA flood zone
- X (unshaded)
- Chance of flooding over 30 yrs
- 0.0%
- Est. flood insurance / yr
- $507 – $1,088
Fire risk 1/10 · Minimal
- Est. fire insurance / yr
- $511 – $949
Heat risk 3/10 · Minor
- Hot days now (above 91°F)
- 7 days/yr
- Hot days in 30 yrs
- 15 days/yr
Wind risk 4/10 · Minor
- Chance of severe wind over 30 yrs
- 8.0%
Air-quality risk 2/10 · Minimal
- Unhealthy air days now
- 1 days/yr
- Unhealthy air days in 30 yrs
- 2 days/yr
Risk factors via First Street. Map © Google.
Why this score? — see what drove the B+ grade
The composite is a weighted blend of 9 inputs, each scored 0–100. Each bar is that input's sub-score; the figure is the points it added to the 100-point composite (weight × sub-score).
- Cash flow +30.0/30.0
- ARV discount +15.0/15.0
- 1% rule +10.0/10.0
- DSCR +10.0/10.0
- Livability +3.4/5.0
- Rent growth +2.5/5.0
- Condition / age +2.2/5.0
- Schools +2.0/10.0
- Appreciation +0.0/10.0
$189,000
🖨 Deal sheet 📄 Offer letter ✓ Due diligence
Multi-family units
County records classify this as Multi-Family (2-4 Unit). Listing-text estimate: 1 unit. estimate disagrees with records
Listing remarks
Live on one side rent the other. Perfect property for investors. Needs some TLC and will be turn key ready. Plent of off street parking.
Key facts
- 0.28 acre lot
Neighborhood map
What this means for you Summary
Snapshot
- This is a 5-bed/3.0-bath multifamily listed at $189k. Condition is rated fair.
Deal economics
- At list price, monthly cash flow is $1k ($12k/yr) — positive.
- The deal already cash-flows at list — no discount required.
- Meets the 1% rule at list price ($3k rent vs $189k).
- Cap rate 12.8% vs local median 4.5% in Hazleton — top-decile yield for the area; either an underpriced asset or a hidden risk that comps aren't pricing in. Stress-test before assuming the spread holds.
Location & tenants
- Location reads 67/100 on livability (#930 in PA) — a middle-class / working-renter tenant base. Strengths: cost of living A+, housing A+, crime A-; Watch: schools F, amenities F, commute F.
- Hazleton Area SD (suburban): math 18% / reading 30% proficiency, ranked #476 of 539 in PA (top 88%) — low school quality limits family demand, transient renter base, plan for 1-2y turnover.
- Market conditions: 118 active listings in the ZIP; 349 units permitted in Luzerne County in 2024 (16 in 5+ unit buildings).
Forward outlook
- Local home prices are declining (-3.0%/yr); year-one equity from $1k of loan paydown is wiped out by about $6k of value loss. Plan a longer hold.
- Luzerne County population projected at +4% by 2050 — modest demand growth; plan on rents tracking national, not racing it.
- At projected returns (-3.0% appreciation + 3.0% rent growth), your $53k cash investment doubles in ~6 years — after that, you're playing with house money.
Negotiation context
- Only 0 days on market — expect competitive offers; lowballing is unlikely to land.
Questions for the listing agent
- Have any recent inspections been done? Can we get a copy of the seller's disclosures and any deferred-maintenance estimates?
- Is there a deadline driving the sale (1031 exchange, divorce, estate, relocation)? That informs how much negotiation room exists.
- Schools are F-rated, which usually means shorter tenancies and higher turnover. Who's the typical renter profile here, and what's been the actual vacancy rate?
- What's the average days-on-market for RENTAL listings here right now (not sales)? A rising rental-DOM trend means longer vacancies and softer asking-rent achievability than the comps imply.
- What's the recent tenant-quality profile in this submarket — average credit score on applications, eviction rate, late-payment / NSF rate, and stable-employment percentage? A property-management company in the area should have these aggregated.
- How much new apartment / multifamily construction is in the pipeline within 1–3 miles? Heavy new supply (>2% of stock underway) typically softens rents 12–24 months out; light construction supports rent growth.
Investment metrics
- 1% rule
- 1.56% ✓
- Cap rate
- 12.76%
- Cash-on-cash
- 23.08%
- DSCR
- 2.03
- GRM
- 5.4
CMA / ARV
- ARV (on-the-fly)
- $260,000
- Comps found
- 12
Show comp detail 12 sales within ~0.75 mi
| Address | Dist | Beds/Ba | Sqft | Sold | Price | $/sf | Match |
|---|---|---|---|---|---|---|---|
| 838 840 Vine St | 0.11mi | 6/2.0 (+1) | 2,735 (+5%) | 2mo | $316,000 | $116 | 76 |
| 416 W w 19th Street St | 0.20mi | 5/2.0 | 2,450 (-6%) | 15mo | $265,000 | $108 | 65 |
| 889 889 1/2 Rear Alter St | 0.13mi | 5/2.0 | 2,876 (+11%) | 11mo | $218,000 | $76 | 63 |
| 591 N James St | 0.63mi | 5/2.0 | 2,600 (0%) | 14mo | $260,000 | $100 | 55 |
| 561 563 Church St | 0.59mi | 6/3.0 (+1) | 2,639 (+2%) | 12mo | $298,000 | $113 | 55 |
| 642 644 Wyoming St | 0.47mi | 6/2.0 (+1) | 2,670 (+3%) | 12mo | $292,000 | $109 | 55 |
| 657 657 1/2 Alter St | 0.44mi | 4/2.0 (-1) | 2,400 (-8%) | 6mo | $210,000 | $88 | 53 |
| 735 737 9th St | 0.61mi | 6/2.0 (+1) | 2,735 (+5%) | 3mo | $255,000 | $93 | 52 |
| 231 9th St | 0.55mi | 4/3.0 (-1) | 2,798 (+8%) | 9mo | $278,000 | $99 | 49 |
| 241 243 Diamond Ave | 0.70mi | 4/2.0 (-1) | 2,640 (+2%) | 12mo | $275,000 | $104 | 46 |
| 534 536 Lafayette Ct | 0.67mi | 4/2.0 (-1) | 2,665 (+2%) | 14mo | $215,000 | $81 | 44 |
| 128 130 6th St | 0.49mi | 6/2.0 (+1) | 2,820 (+8%) | 13mo | $265,000 | $94 | 44 |
Match score weights: distance 35% · size 25% · config 20% · recency 20%. Top-matched comps best support the ARV.
Projected returns pro-forma
-3.0% appreciation · 3.0% rent growth · sell at horizon
- IRR
- 16.1%
- Equity multiple
- 1.65×
- Total profit
- $34,258
- Equity at exit
- $28,181
- IRR
- 24.7%
- Equity multiple
- 3.14×
- Total profit
- $113,503
- Equity at exit
- $16,341
Cash invested: $52,920 (down + closing). Projections, not guarantees.
Landlord ↔ Tenant lean methodology
- Overall (STATE)
- 62 Landlord-Friendly
- State Pennsylvania
- 62 Landlord-Friendly · EVEN
- County
- — inherits STATE
- City
- — inherits STATE
ZIP-level market 18201
- Home prices YoY
- -14.9%
- Active inventory
- 118
- Price-to-rent
- 10.7×
Monthly cashflow live
- Estimated rent
- $2,942 medium interval (Pro) →
- Mortgage (P&I)
- −$991
- Tax est. 1.5%
- −$236 /mo · $2,835/yr
- Insurance
- −$79
- HOA
- −$0
- Vacancy / Maint / Mgmt
- −$618
- Net cashflow
- $1,018
Break-even live
2-unit breakdown (identical units grouped — click to expand)
| Units | Beds | Baths | Est. rent |
|---|---|---|---|
| 2× units | 2 | 1 | $2,942 |
| #1 | 2 | 1 | $1,471 |
| #2 | 2 | 1 | $1,471 |
| Total (2 units) | $2,942 | ||
UW: 25.0% down · 7.5% · 30yr · 1.5% tax · 5.0% vac · 8.0% maint · 8.0% mgmt
Financing live
Cash to close
- Down payment
- $47,250
- Closing costs
- $5,670
- Reserves months
- —
- Total cash needed
- —
Loan-product check · same deal, 3 products live
Conventional
25% down · 7.5% · 30yr
- Down + closing
- —
- Monthly P&I
- —
- Monthly cashflow
- —
- DSCR
- —
- Eligible?
- —
Personal DTI + credit; lowest rate.
DSCR
20% down · 8.5% · 30yr
- Down + closing
- —
- Monthly P&I
- —
- Monthly cashflow
- —
- DSCR
- —
- Eligible?
- —
No personal income docs; deal must DSCR.
Hard money
10% down · 12.0% · 12mo
- Down + closing
- —
- Monthly P&I
- —
- Monthly cashflow
- —
- DSCR
- —
- Eligible?
- —
Short-term bridge; refi at stabilization.
Listing history 2 events
-
2026-05-08historical
-
2026-05-06$189,000
ⓘ Source: listings_history table (triggers on properties + properties_extension) + one-shot
backfill from property_details.listing_events for pre-trigger history.
Climate risk First Street
- Flood 1/10 Low FEMA zone X (unshaded) · 0% chance over 30 yrs
- Wildfire 1/10 Low
- Heat 3/10 Moderate 7 d/yr ≥91°F today · 15 d/yr by 30 yrs out
- Wind 4/10 Moderate 8% chance of damaging wind over 30 yrs
- Air quality 2/10 Low 1 unhealthy d/yr today · 2 by 30 yrs out
Nearby sold comps map
Loading sold comps map…
Walkable amenities ~0.75 mi
Loading nearby amenities…
Taxation est. · year 1
- Rental income
- $35,304
- − Mortgage interest
- −$10,587
- − Property taxes
- −$2,835
- − Insurance
- −$945
- − Repairs & maintenance
- −$2,824
- − Management
- −$2,824
- − Depreciation
- −$5,498
- Taxable income
- $9,790
- Est. tax owed @ 24.0%
- −$2,350
- After-tax cash flow
- $9,867/yr
For passive investors: Depreciation is non-cash, so a rental often shows a tax loss while cash-flowing — sheltering income. Rental losses are passive: they offset passive income freely, and up to $25,000/yr can offset ordinary (W-2) income if you actively participate and your MAGI is under $100k (phasing out to $0 by $150k); unused losses carry forward. On sale, claimed depreciation is recaptured at up to 25%, and gains may owe capital-gains tax (a 1031 exchange can defer both). Figures are a year-1 estimate at your 24.0% rate — not tax advice; consult a CPA.
Condition & rehab AI · 14 photos
The property requires moderate renovations to improve its condition and value. Repainting, updating fixtures, and replacing the refrigerator are the highest-ROI updates that would significantly increase its resale and rental value.
Repairs flagged
- Minor Kitchen cabinets — Light wear and tear, but not to the point of needing replacement.
- Major Bathroom fixtures — Outdated and worn, likely requiring replacement or renovation.
- Moderate Exterior siding — Visible discoloration and wear, indicating a need for repainting or minor repairs.
- Major Interior walls — Peeling paint, indicating a need for repainting or repair.
Value-add opportunities
- Both Painting interior walls and updating fixtures — Fresh paint and updated fixtures will improve the home's appearance and appeal to both buyers and renters.
- Rental Refrigerator replacement — A new refrigerator will attract renters and improve the home's rental value.
Renovation cost estimate screening
| Repair item | Severity | Est. cost |
|---|---|---|
| Kitchen cabinets · Light wear and tear, but not to the point of needing replacement. | Minor | $500–3,000 |
| Bathroom fixtures · Outdated and worn, likely requiring replacement or renovation. | Major | $15,000–50,000 |
| Exterior siding · Visible discoloration and wear, indicating a need for repainting or minor repairs. | Moderate | $3,000–15,000 |
| Interior walls · Peeling paint, indicating a need for repainting or repair. | Major | $15,000–50,000 |
| Total estimated repair cost · 4 items | $33,500–118,000 |
Value-add ROI direction
- Both Painting interior walls and updating fixtures — Fresh paint and updated fixtures will improve the home's appearance and appeal to both buyers and renters. ↑
- Rental Refrigerator replacement — A new refrigerator will attract renters and improve the home's rental value. ↑
ⓘ Cost ranges are severity-bucket heuristics (US national rule-of-thumb). Get contractor quotes + a written scope before underwriting a rehab budget.
Schools (NCES district)
- District
- Hazleton Area SD
- NCES district ID
- 4211700
- Math proficiency
- 18% ▼ -3.00%
- Reading proficiency
- 30% ▼ -15.00%
- Median HH income
- $42,247
- Composite
- 20.44/100
- National rank
- #8582
- State rank
- #476 of 539 in PA
Livability — Hazleton
- Score
- 67/100
- State rank
- #930
- US rank
- #10115
Category grades
Schools grade is shown separately in the Schools card above.
Census & demographics
- Census place
- Hazleton, PA
- City population
- 13,755
- Population (ZIP)
- 31,428
Population outlook (Luzerne County) Hauer SSP2
- Today (2025)
- 319,505 people
- By 2030
- 319,943 · +0.1%
- By 2040
- 322,643 · +1.0%
- By 2050
- 330,817 · +3.5%
- By 2075
- 379,145 · +18.7%
- By 2100
- 431,908 · +35.2%
Race, ethnicity, and origin ACS 2023
- Neighborhood character
- Majority Hispanic (60%)
- Race & ethnicity
- Hispanic / Latino 60% White 36% Two or more races 18% Black 2%
- Hispanic origin (detail)
- Mexican 6% Puerto Rican 6% Dominican 41%
- Common ancestry
- Romanian 5% Iranian 1% Russian 1%
- Foreign-born
- 36% · Canada, Jamaica
- Languages at home
- 43% English-only · Spanish 54% Russian/Polish/Slavic 1% Other Indo-European 1%
Political lean MEDSL · Luzerne
- 2024 margin
- R (+19.2) · D 40.0% · R 59.2%
- 2008→2024 swing
- -27.6pp toward R · 2008: 8.4pp · 2024: -19.2pp
- All cycles
- 2024: R+19.2 2020: R+14.4 2016: R+19.6 2012: D+4.8 2008: D+8.4
Not yet ingested
- Civics
- —
Market trends
- HPI YoY
- ▼ -62.00%
- Current HPI
- 354.7443
- Rent YoY
- —
- Metro
- —
- State GDP YoY
- ▲ 1.68%
- F500 in state
- 34
Industry mix (Fortune 500 HQ in PA)
| Industry | F500 HQs | Revenue |
|---|---|---|
| Healthcare | 2 | $309B |
|
||
| Insurance | 2 | $27B |
|
||
| Telecommunications / Media | 1 | $124B |
|
||
| Industrial Distribution | 1 | $22B |
|
||
| Financial Services | 1 | $20B |
|
||
| Chemicals / Materials | 1 | $18B |
|
||
Price history
2 events — show timeline
- 2026-05-08 Delisted — LCAR
- 2026-05-06 Listed $189,000 LCAR
Cash-flow waterfall
monthlySold comps — $/sqft
last 12 mo · ≤1 miLoading sold comps…