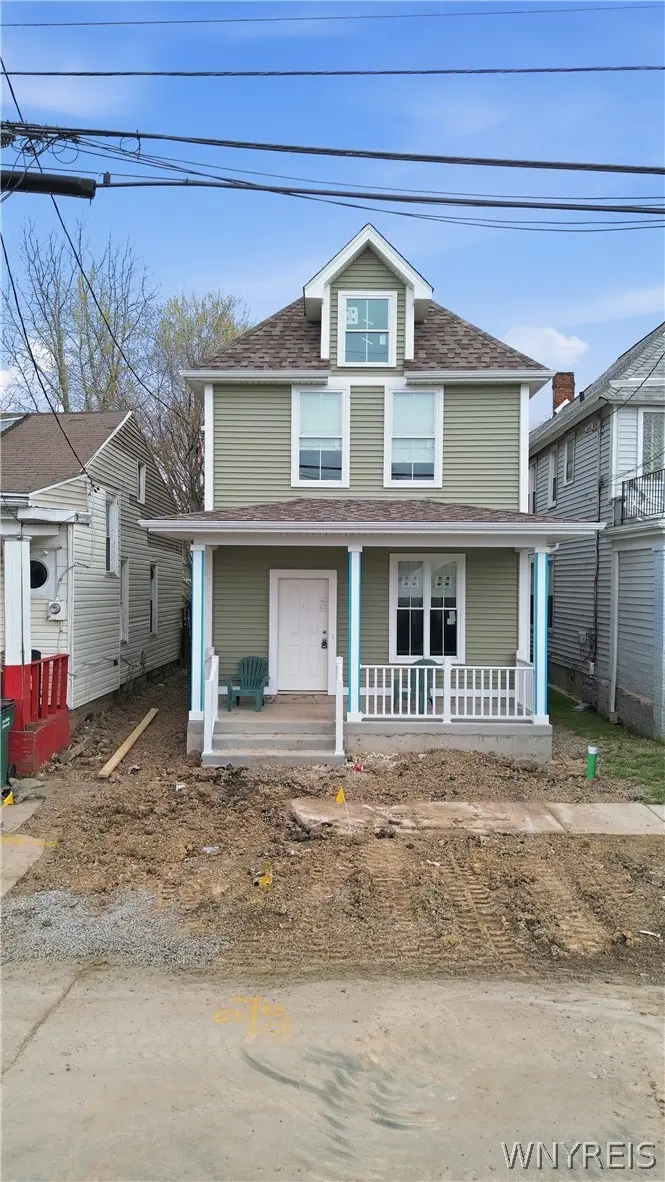
251 Normal Ave · Buffalo, NY
Flood risk 1/10 · Minimal
- FEMA flood zone
- X (unshaded)
- Chance of flooding over 30 yrs
- 0.0%
- Est. flood insurance / yr
- $507 – $1,088
Fire risk 1/10 · Minimal
- Est. fire insurance / yr
- $691 – $1,283
Heat risk 3/10 · Minor
- Hot days now (above 91°F)
- 7 days/yr
- Hot days in 30 yrs
- 15 days/yr
Wind risk 1/10 · Minimal
- Chance of severe wind over 30 yrs
- —
Air-quality risk 4/10 · Minor
- Unhealthy air days now
- 4 days/yr
- Unhealthy air days in 30 yrs
- 9 days/yr
Risk factors via First Street. Map © Google.
Why this score? — see what drove the C grade
The composite is a weighted blend of 9 inputs, each scored 0–100. Each bar is that input's sub-score; the figure is the points it added to the 100-point composite (weight × sub-score).
- ARV discount +14.5/15.0
- Cash flow +13.6/30.0
- Appreciation +8.8/10.0
- DSCR +4.1/10.0
- Livability +3.9/5.0
- 1% rule +3.8/10.0
- Schools +3.3/10.0
- Condition / age +2.5/5.0
- Rent growth +2.4/5.0
$205,000
🖨 Deal sheet 📄 Offer letter ✓ Due diligence
Listing remarks
This newly constructed home features 3 bedrooms, 1.5 baths, and brand-new appliances—perfect for first-time buyers or those continuing their homeownership journey. Thoughtfully designed for modern living, the home offers comfort, efficiency, and a functional two-story layout. Located on a neighborhood street with convenient access to public transportation, this property provides both accessibility and a strong sense of community. PLEASE READ CAREFULLY: This is an income-restricted, owner-occupied opportunity. Buyers must meet program eligibility requirements. For application details, contact Belmont Housing Resources for WNY. Taxes are estimated based on a $205,000 sale price and 2027
Key facts
- Two-story layout
- Brand-new appliances
- 3,000 sq ft lot
Tags
Property features AI
Exterior
- Parking: No garage; No driveway
- Utilities: Electricity connected (circuit breakers); Public water connected; Sewer connected
- Home design: 2-story property; New construction
- Construction: Frame construction with vinyl siding; Asphalt roof; Poured foundation; Copper plumbing; New build
- Exterior features: Covered porch
Interior
- Kitchen: Electric oven; Electric range; Dishwasher; Microwave; Refrigerator
- Flooring: Carpet; Laminate; Varies
- Bathrooms: 1 full bathroom; 1 half bathroom; One main-level bathroom
- Heating & cooling: Ductless cooling; Ductless electric heating
- Interior features: Living/dining room; Pull-down attic stairs
- Laundry & utility: Washer and dryer (upper level); Electric water heater
Neighborhood map
What this means for you Summary
Snapshot
- This is a 3-bed/1.5-bath land listed at $205k.
Deal economics
- At list price, monthly cash flow is $11 ($131/yr) — positive.
- The deal already cash-flows at list — no discount required.
- To meet the 1% rule (rent ≥ 1% of price), the offer needs to be $181k (11.8% below list).
- Recommended offer: $181k (11.8% below list) — sets the bar for 1% rule.
- Cap rate 6.4% vs local median 8.0% in Buffalo — below-typical yield; the buyer is paying a premium for something (appreciation thesis, condition, location) that the cap rate doesn't capture.
Location & tenants
- Location reads 77/100 on livability (#195 in NY, #3,011 nationally) — a middle-class / working-renter tenant base. Strengths: commute A+, housing A+, health & safety A+; Watch: crime F, employment D-.
- Buffalo City School District (urban): math 41% / reading 40% proficiency, ranked #535 of 590 in NY (top 91%) — families likely to look elsewhere, expect single-tenant / working-renter base with shorter leases; 75% free/reduced lunch — lower-income household profile, screen leases tightly.
- Market conditions: Rents soft (-0.5%/yr); 137 active listings in the ZIP; 40 comparable units currently listed for rent nearby; rentals at typical pace (median 24d on market — plan ~3-4 weeks tenant-placement turnaround); 1,244 units permitted in Erie County in 2024 (563 in 5+ unit buildings).
- This rent runs 40% of the median local income ($54k/yr) — at the standard rent-burdened threshold; future hikes will face affordability resistance.
Forward outlook
- In year one you build about $17k of equity ($1k loan paydown + $15k appreciation (7.5% local appreciation)).
- At projected returns (7.5% appreciation + 0.0% rent growth), your $57k cash investment doubles in ~4 years — after that, you're playing with house money.
- By year 3, paydown + projected appreciation supports a ~$42k cash-out refi (75% LTV) — recoverable capital for the next deal without selling this one.
Negotiation context
- It's been on market 52 days — a 3% lower offer ($199k) is reasonable based on typical stale-listing flexibility.
Questions for the listing agent
- It's been on market 52 days. Have you received any prior offers? Is the seller open to a 12% concession, seller financing, or rate buy-down credit?
- Is there a deadline driving the sale (1031 exchange, divorce, estate, relocation)? That informs how much negotiation room exists.
- Crime grade is F in this area — have there been break-ins, vandalism, or insurance claims at this property in the last 3 years? What carrier currently insures it and at what premium?
- What's the average days-on-market for RENTAL listings here right now (not sales)? A rising rental-DOM trend means longer vacancies and softer asking-rent achievability than the comps imply.
- What's the recent tenant-quality profile in this submarket — average credit score on applications, eviction rate, late-payment / NSF rate, and stable-employment percentage? A property-management company in the area should have these aggregated.
- How much new for-sale + rental construction is in the pipeline within 1–3 miles? Heavy new supply typically softens prices + rents 12–24 months out; constrained supply supports both.
Investment metrics
- 1% rule
- 0.88% ✗
- Cap rate
- 6.36%
- Cash-on-cash
- 0.23%
- DSCR
- 1.01
- GRM
- 9.5
CMA / ARV
- ARV (median comp)
- $242,765
- List price
- $205,000
- Delta
- -15.56%
- Verdict
- UNDERPRICED
- Comps
- 20 within 1.0 mi
Projected returns pro-forma
7.51% appreciation · 0.0% rent growth · sell at horizon
- IRR
- 17.9%
- Equity multiple
- 2.28×
- Total profit
- $73,527
- Equity at exit
- $148,989
- IRR
- 16.3%
- Equity multiple
- 4.54×
- Total profit
- $203,122
- Equity at exit
- $289,520
Cash invested: $57,400 (down + closing). Projections, not guarantees.
Landlord ↔ Tenant lean methodology
- Overall (STATE)
- 15 Strongly Tenant-Friendly
- State New York
- 15 Strongly Tenant-Friendly · D+10
- County
- — inherits STATE
- City
- — inherits STATE
ZIP-level market 14213
- Home prices YoY
- 1.7%
- Rents YoY
- -0.5%
- Active inventory
- 137
- Price-to-rent
- 9.5×
Monthly cashflow live
- Estimated rent
- $1,807 high interval (Pro) →
- Mortgage (P&I)
- −$1,075
- Tax est. 1.5%
- −$256 /mo · $3,075/yr
- Insurance
- −$85
- HOA
- −$0
- Vacancy / Maint / Mgmt
- −$380
- Net cashflow
- $11
Break-even live
UW: 25.0% down · 7.5% · 30yr · 1.5% tax · 5.0% vac · 8.0% maint · 8.0% mgmt
Financing live
Cash to close
- Down payment
- $51,250
- Closing costs
- $6,150
- Reserves months
- —
- Total cash needed
- —
Loan-product check · same deal, 3 products live
Conventional
25% down · 7.5% · 30yr
- Down + closing
- —
- Monthly P&I
- —
- Monthly cashflow
- —
- DSCR
- —
- Eligible?
- —
Personal DTI + credit; lowest rate.
DSCR
20% down · 8.5% · 30yr
- Down + closing
- —
- Monthly P&I
- —
- Monthly cashflow
- —
- DSCR
- —
- Eligible?
- —
No personal income docs; deal must DSCR.
Hard money
10% down · 12.0% · 12mo
- Down + closing
- —
- Monthly P&I
- —
- Monthly cashflow
- —
- DSCR
- —
- Eligible?
- —
Short-term bridge; refi at stabilization.
Rent comps 40 comps
| Address | Beds | Baths | Sqft | Rent | $/sqft | DOM | Units | Dist |
|---|---|---|---|---|---|---|---|---|
| 367 Connecticut St Unit 2 Buffalo, NY | 2.0 | 2.0 | 1150 | $3,000 | $2.61 | 10d | 1 | 0.12mi |
| 318 14th St Buffalo, NY | 2.0 | 1.0 | 1619 | $1,300 | $0.80 | 11d | 1 | 0.13mi |
| 161 16th St Buffalo, NY | 3.0 | 1.5 | 1500 | $2,000 | $1.33 | 23d | 1 | 0.22mi |
| 124 Normal Ave Unit 2 Buffalo, NY | 3.0 | 1.0 | 1727 | $2,000 | $1.16 | 23d | 1 | 0.26mi |
| 102 17th St Buffalo, NY | 2.0 | 1.0 | 1086 | $1,290 | $1.19 | 23d | 1 | 0.26mi |
| 460 Rhode Island St Buffalo, NY | 2.0 | 1.0 | 1089 | $1,500 | $1.38 | 14d | 1 | 0.42mi |
| 31 Norwood Ave Unit 2 Buffalo, NY | 3.0 | 1.0 | 1000 | $1,950 | $1.95 | 11d | 1 | 0.47mi |
| 310 Hampshire St Apt 3 Buffalo, NY | 3.0 | 1.0 | 1200 | $1,500 | $1.25 | 43d | 1 | 0.48mi |
| 608 Niagara St Buffalo, NY | 2.0 | 1.0 | 1200 | $1,195 | $1.00 | 14d | 1 | 0.49mi |
| 118 Ashland Ave Buffalo, NY | 3.0 | 1.0 | 1326 | $1,850 | $1.40 | 14d | 1 | 0.51mi |
| 375 Hampshire St Buffalo, NY | 3.0 | 1.0 | 1200 | $1,100 | $0.92 | 43d | 1 | 0.52mi |
| 217 Norwood Ave Apt 1 Buffalo, NY | 2.0 | 1.0 | 1500 | $2,700 | $1.80 | 43d | 1 | 0.53mi |
| 279 North St Buffalo, NY | 1.0–2.0 | 1.0–2.0 | 820 | $2,050 | $2.50 | 43d | 1 | 0.53mi |
| 67 Herkimer St Buffalo, NY | 3.0 | 1.0 | 1000 | $1,300 | $1.30 | 14d | 1 | 0.56mi |
| 233 Pennsylvania St Unit 3 Buffalo, NY | 2.0 | 1.0 | 1200 | $1,350 | $1.12 | 10d | 1 | 0.56mi |
| 344 Elmwood Ave Unit 3rd floor Buffalo, NY | 2.0 | 1.0 | 1000 | $1,400 | $1.40 | 23d | 1 | 0.58mi |
| 411 W Ferry St Buffalo, NY | 2.0 | 1.0 | 900 | $1,100 | $1.22 | 14d | 1 | 0.58mi |
| 550 Busti Ave Unit 2 Buffalo, NY | 3.0 | 1.0 | 1638 | $1,500 | $0.92 | 43d | 1 | 0.60mi |
| 344 Hudson St Unit UPPER Buffalo, NY | 2.0 | 1.0 | 1065 | $1,100 | $1.03 | 43d | 1 | 0.61mi |
| 305 W Utica St Unit B302 Buffalo, NY | 2.0 | 2.0 | 1180 | $2,060 | $1.75 | 14d | 1 | 0.64mi |
| 451 Elmwood Ave Buffalo, NY | 2.0 | 1.0 | 1633 | $3,305 | $2.02 | 43d | 1 | 0.64mi |
| 213 Summer St Unit 3 Buffalo, NY | 2.0 | 1.0 | 1020 | $2,450 | $2.40 | 21d | 1 | 0.66mi |
| 74 Days Park Unit 8 Buffalo, NY | 2.0 | 1.0 | 1350 | $1,695 | $1.26 | 43d | 1 | 0.68mi |
| 126 Cottage St Unit 4 Buffalo, NY | 2.0 | 2.5 | 1500 | $2,000 | $1.33 | 14d | 1 | 0.69mi |
| 569 Elmwood Ave Buffalo, NY | 2.0 | 1.0 | 1500 | $1,750 | $1.17 | 11d | 1 | 0.73mi |
| 478 Breckenridge St Buffalo, NY | 3.0 | 1.0 | 1100 | $1,575 | $1.43 | 43d | 1 | 0.74mi |
| 40 Putnam St Buffalo, NY | 4.0 | 1.0 | 1600 | $2,100 | $1.31 | 23d | 1 | 0.79mi |
| 21 College St Buffalo, NY | 3.0 | 1.0 | 1104 | $1,850 | $1.68 | 23d | 1 | 0.83mi |
| 196 Auburn Ave Buffalo, NY | 3.0 | 1.0 | 1000 | $1,300 | $1.30 | 43d | 1 | 0.84mi |
| 190 Whitney Pl Buffalo, NY | 3.0 | 1.0 | 1180 | $1,550 | $1.31 | 43d | 1 | 0.84mi |
| 888 Delaware Ave Buffalo, NY | 2.0 | 1.0–2.0 | 899 | $2,440 | $2.71 | 23d | 1 | 0.86mi |
| 370 Virginia St Unit 3 Buffalo, NY | 2.0 | 1.0 | 1050 | $1,300 | $1.24 | 43d | 1 | 0.88mi |
| 257 Lafayette Ave Apt 319 Buffalo, NY | 2.0 | 1.0 | 900 | $1,395 | $1.55 | 23d | 1 | 0.89mi |
| 257 Lafayette Ave Unit 317 Buffalo, NY | 2.0 | 1.0 | 897 | $1,400 | $1.56 | 23d | 1 | 0.89mi |
| 916 Delaware Ave Buffalo, NY | 2.0 | 1.0 | 750 | $1,625 | $2.17 | 3d | 9 | 0.90mi |
| 217 W Tupper St Unit 2 Buffalo, NY | 3.0 | 1.0 | 1150 | $1,350 | $1.17 | 43d | 1 | 0.94mi |
| 130 Linwood Ave Buffalo, NY | 2.0 | 1.0 | 900 | $1,900 | $2.11 | 23d | 1 | 0.95mi |
| 506 Delaware Ave Buffalo, NY | 1.0–2.0 | 1.0–1.5 | 1190 | $2,995 | $2.52 | 10d | 6 | 0.96mi |
| 40 North St Unit 306 Buffalo, NY | 2.0 | 1.5 | 1125 | $1,950 | $1.73 | 43d | 1 | 0.99mi |
| 311 Herkimer St #1 Buffalo, NY | 3.0 | 1.0 | 1272 | $1,400 | $1.10 | 14d | 1 | 1.00mi |
Listing history 15 events
-
2026-06-18days on market $205,000 Active 52 DOM
-
2026-06-17days on market $205,000 Active 51 DOM
-
2026-06-16days on market $205,000 Active 50 DOM
-
2026-06-15days on market $205,000 Active 49 DOM
-
2026-06-13days on market $205,000 Active 47 DOM
-
2026-06-13days on market $205,000 Active 46 DOM
-
2026-06-10days on market $205,000 Active 44 DOM
-
2026-06-09days on market $205,000 Active 43 DOM
-
2026-06-08days on market $205,000 Active 42 DOM
-
2026-06-07days on market $205,000 Active 41 DOM
-
2026-06-03days on market $205,000 Active 37 DOM
-
2026-06-02days on market $205,000 Active 36 DOM
-
2026-06-01days on market $205,000 Active 35 DOM
-
2026-05-31days on market $205,000 Active 34 DOM
-
2026-04-27$205,000 Active 1184-char remark
ⓘ Source: listings_history table (triggers on properties + properties_extension) + one-shot
backfill from property_details.listing_events for pre-trigger history.
Climate risk First Street
- Flood 1/10 Low FEMA zone X (unshaded) · 0% chance over 30 yrs
- Wildfire 1/10 Low
- Heat 3/10 Moderate 7 d/yr ≥91°F today · 15 d/yr by 30 yrs out
- Wind 1/10 Low
- Air quality 4/10 Moderate 4 unhealthy d/yr today · 9 by 30 yrs out
Nearby sold comps map
Loading sold comps map…
Walkable amenities ~0.75 mi
Loading nearby amenities…
Taxation est. · year 1
- Rental income
- $21,686
- − Mortgage interest
- −$11,483
- − Property taxes
- −$3,075
- − Insurance
- −$1,025
- − Repairs & maintenance
- −$1,735
- − Management
- −$1,735
- − Depreciation
- −$5,964
- Taxable loss
- −$3,331
- Est. tax savings @ 24.0%
- +$799
- After-tax cash flow
- $931/yr
For passive investors: Depreciation is non-cash, so a rental often shows a tax loss while cash-flowing — sheltering income. Rental losses are passive: they offset passive income freely, and up to $25,000/yr can offset ordinary (W-2) income if you actively participate and your MAGI is under $100k (phasing out to $0 by $150k); unused losses carry forward. On sale, claimed depreciation is recaptured at up to 25%, and gains may owe capital-gains tax (a 1031 exchange can defer both). Figures are a year-1 estimate at your 24.0% rate — not tax advice; consult a CPA.
Schools (NCES district)
- District
- Buffalo City School District
- NCES district ID
- 3605850
- Math proficiency
- 41% ▲ 11.00%
- Reading proficiency
- 40% ▲ 7.00%
- Median HH income
- $31,665
- Composite
- 33.17/100
- National rank
- #5544
- State rank
- #535 of 590 in NY
Livability — Buffalo
- Score
- 77/100
- State rank
- #195
- US rank
- #3011
Category grades
Schools grade is shown separately in the Schools card above.
Census & demographics
- Census place
- Buffalo, NY
- County
- Erie County · 714,559 people
- City population
- 440,021
- Metro
- Buffalo-Cheektowaga, NY
- Population (ZIP)
- 24,107
- Household income
- $53,870
- Rent vs Own
- Severe rent burden
- 1501.0
Population outlook (Erie County) Hauer SSP2
- Today (2025)
- 933,037 people
- By 2030
- 935,181 · +0.2%
- By 2040
- 928,531 · -0.5%
- By 2050
- 905,725 · -2.9%
- By 2075
- 834,037 · -10.6%
- By 2100
- 708,033 · -24.1%
Race, ethnicity, and origin ACS 2023
- Neighborhood character
- Highly diverse neighborhood (Simpson 0.70)
- Race & ethnicity
- White 46% Hispanic / Latino 20% Black 18% Asian 12% Two or more races 10%
- Hispanic origin (detail)
- Mexican 1% Puerto Rican 16% Dominican 1%
- Common ancestry
- Romanian 6% Slovak 3% Lithuanian 3%
- Foreign-born
- 16% · Philippines, Canada, India
- Languages at home
- 68% English-only · Spanish 12% Other Asian/Pacific 7% Arabic 3%
Political lean MEDSL · Erie
- 2024 margin
- Lean D (+9.7) · D 54.8% · R 45.2%
- 2008→2024 swing
- -7.9pp toward R · 2008: 17.5pp · 2024: 9.7pp
- All cycles
- 2024: D+9.7 2020: D+14.7 2016: D+4.8 2012: D+15.6 2008: D+17.5
Not yet ingested
- Civics
- —
Market trends
- HPI YoY
- ▲ 7.51%
- Current HPI
- 448.4879
- Rent YoY
- ▼ -0.49%
- Metro
- Buffalo-Cheektowaga, NY
- State GDP YoY
- ▲ 2.60%
- F500 in state
- 92
Industry mix (Fortune 500 HQ in NY)
| Industry | F500 HQs | Revenue |
|---|---|---|
| Financial Services | 10 | $950B |
|
||
| Consumer Goods | 9 | $162B |
|
||
| Insurance | 4 | $225B |
|
||
| Telecommunications | 2 | $144B |
|
||
| Pharmaceuticals | 2 | $112B |
|
||
| Media / Entertainment | 2 | $69B |
|
||
Price history
1 event — show timeline
- 2026-04-27 Listed $205,000 WNYREIS
Property tax history
+1.1%/yrLatest (2020): $81 · +0.0% YoY. Source: county tax records.
Cash-flow waterfall
monthlySold comps — $/sqft
last 12 mo · ≤1 miLoading sold comps…