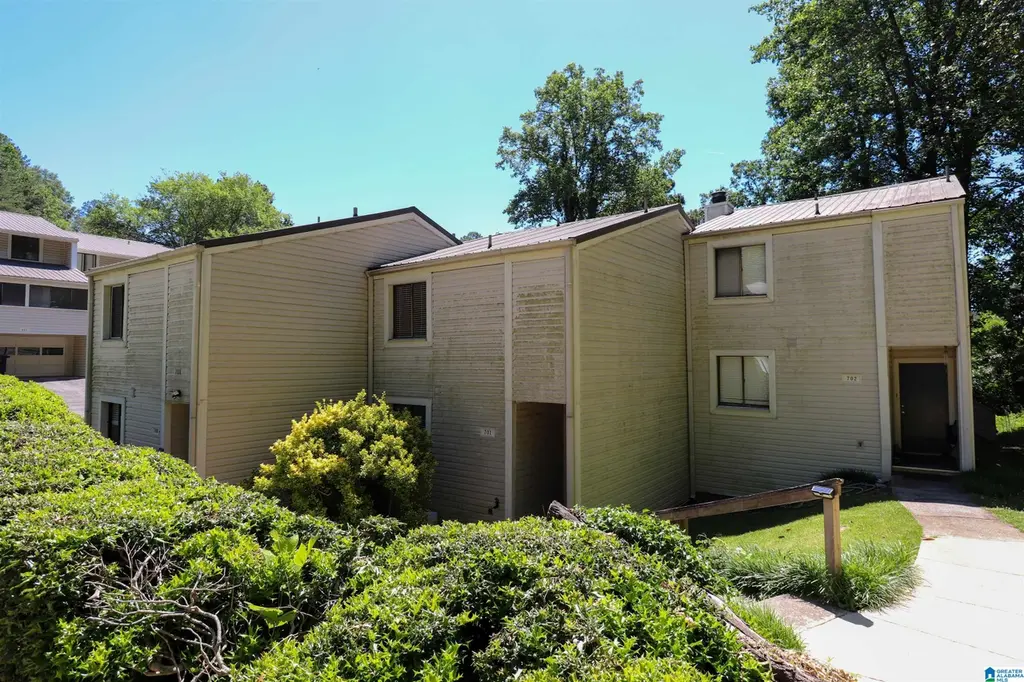
701 Running Brook Rd #701 · Hoover, AL
Flood risk 1/10 · Minimal
- FEMA flood zone
- X (unshaded)
- Chance of flooding over 30 yrs
- 0.0%
- Est. flood insurance / yr
- $507 – $1,088
Fire risk 1/10 · Minimal
- Est. fire insurance / yr
- $916 – $1,700
Heat risk 6/10 · Moderate
- Hot days now (above 107°F)
- 7 days/yr
- Hot days in 30 yrs
- 19 days/yr
Wind risk 6/10 · Moderate
- Chance of severe wind over 30 yrs
- 27.0%
Air-quality risk 4/10 · Minor
- Unhealthy air days now
- 6 days/yr
- Unhealthy air days in 30 yrs
- 6 days/yr
Risk factors via First Street. Map © Google.
Why this score? — see what drove the B grade
The composite is a weighted blend of 9 inputs, each scored 0–100. Each bar is that input's sub-score; the figure is the points it added to the 100-point composite (weight × sub-score).
- Cash flow +26.2/30.0
- ARV discount +15.0/15.0
- DSCR +8.8/10.0
- 1% rule +7.0/10.0
- Schools +5.0/10.0
- Livability +4.2/5.0
- Rent growth +3.4/5.0
- Condition / age +2.8/5.0
- Appreciation +0.0/10.0
$130,000
🖨 Deal sheet 📄 Offer letter ✓ Due diligence
Listing remarks
Great deal located in Hoover!
Key facts
- Community pool
- Built 1975
- Listed 6 days
Property features AI
Finance
- Other: Subdivision: Running Brook; Directions provided to the property
- Financial info: No investor/multifamily financial details listed
- HOA & community: Monthly condo/townhome fee of $275; HOA fees include garbage collection, common grounds maintenance, management fee, pest control, water, and internet; Fire fee, garbage fee, and library fee are included
Exterior
- Parking: Assigned parking
- Security: No specific security features listed
- Utilities: Public water; Sewer connected; Internet service available
- Home design: Condo/Townhome, located on level 1 (unit/condo level); Existing construction; Vinyl siding construction
- Construction: Slab foundation; Vinyl siding; Year built: existing (no specific year provided)
- Exterior features: Community in-ground pool; Covered deck; No patio; No garden/patio; Not waterfront; Unit number 701
Interior
- Kitchen: Laminate countertops; Electric cooktop; Built-in dishwasher; Built-in microwave
- Bedrooms: Master bedroom on upper level; Second master bedroom on upper level
- Flooring: Carpet; Hardwood laminate; Tile flooring
- Bathrooms: Two full baths; One half bath; Baths feature tub/shower combos and shared bath layout
- Heating & cooling: Central heating; Central cooling
- Interior features: One wood-burning fireplace with stone surround in the living room; Ceilings: other (see remarks); No attic; No additional interior features listed
- Laundry & utility: Laundry located on main level in a closet; Washer hookup available; Electric dryer hookup; Water heater: electric
Neighborhood map
What this means for you Summary
Snapshot
- This is a 2-bed/2.5-bath condo listed at $130k. Condition is rated average.
Deal economics
- At list price, monthly cash flow is $331 ($4k/yr) — positive.
- The deal already cash-flows at list — no discount required.
- Meets the 1% rule at list price ($2k rent vs $130k).
- Cap rate 9.3% vs local median 2.4% in Hoover — top-decile yield for the area; either an underpriced asset or a hidden risk that comps aren't pricing in. Stress-test before assuming the spread holds.
Location & tenants
- Location reads 84/100 on livability (#1 in AL, #630 nationally) — a professional / high-income tenant draw. Strengths: crime A+, employment A+, housing A+.
- Hoover City (urban): math 45% / reading 66% proficiency, ranked #8 of 129 in AL (top 6%) — acceptable for families but not a draw, mixed tenant base, ~2y average lease; only 19% free/reduced lunch — higher-income household profile.
- Zoned schools: Shades Mountain Elementary School (math 47% / reading 62%, grade C, #87 of 627 statewide, top 15%, 330 students, 48% FRL); Spain Park High School (math 51% / reading 54%, grade C-, #10 of 305 statewide, top 3%, 1,503 students, 28% FRL) — zoned schools average 38% FRL vs 19% district-wide (19 pts higher); higher-poverty schools than district average — tighter screening recommended.
- Market conditions: Rents rising (+3.7%/yr); 203 active listings in the ZIP; 14 comparable units currently listed for rent nearby; rentals lingering (median 44d on market — plan ~5-8 weeks vacancy on turnover, expect pricing pressure); 50% of comp listings sitting > 30 days — soft ceiling on asking rent; high-income renter base; 2,114 units permitted in Jefferson County in 2024 (556 in 5+ unit buildings).
- This rent is only 15% of the median local income ($125k/yr) — well below the 30% rent-burden line; pricing power to push rent on renewal without tenant pushback.
Forward outlook
- Local home prices are declining (-3.0%/yr); year-one equity from $899 of loan paydown is wiped out by about $4k of value loss. Plan a longer hold.
- Jefferson County population projected to shrink 4% by 2050 — rents likely to lag national; underwrite the cash flow, not the appreciation.
- At projected returns (-3.0% appreciation + 3.7% rent growth), your $36k cash investment doubles in ~10 years — after that, you're playing with house money.
Negotiation context
- Only 6 days on market — expect competitive offers; lowballing is unlikely to land.
Risks & watch-outs
- Climate carrying-cost: major wind risk, 27% chance of damaging wind over 30y; extreme-heat days projected 7→19/yr by 2055 (HVAC capex compounding) — expect insurance premiums to compound above CPI over the hold.
Questions for the listing agent
- Built in 1975 — when were the roof, HVAC, electrical panel, plumbing, and water heater last replaced?
- Any open or pending special assessments — roof, HVAC, plumbing, elevator, façade? What's the per-unit balance and payoff schedule, and is the seller paying it off at close or rolling it to the buyer?
- Is there a deadline driving the sale (1031 exchange, divorce, estate, relocation)? That informs how much negotiation room exists.
- Schools are A-rated — typically a magnet for longer-tenancy family renters. What's the average tenant stay here, and is there a school-zone premium baked into asking?
- What's the average days-on-market for RENTAL listings here right now (not sales)? A rising rental-DOM trend means longer vacancies and softer asking-rent achievability than the comps imply.
- What's the recent tenant-quality profile in this submarket — average credit score on applications, eviction rate, late-payment / NSF rate, and stable-employment percentage? A property-management company in the area should have these aggregated.
- How much new apartment / multifamily construction is in the pipeline within 1–3 miles? Heavy new supply (>2% of stock underway) typically softens rents 12–24 months out; light construction supports rent growth.
Investment metrics
- 1% rule
- 1.20% ✓
- Cap rate
- 9.34%
- Cash-on-cash
- 10.90%
- DSCR
- 1.48
- GRM
- 7.0
CMA / ARV
- ARV (median comp)
- $190,171
- List price
- $130,000
- Delta
- -31.64%
- Verdict
- UNDERPRICED
- Comps
- 20 within 1.0 mi
Projected returns pro-forma
-3.0% appreciation · 3.7% rent growth · sell at horizon
- IRR
- 0.8%
- Equity multiple
- 1.03×
- Total profit
- $1,116
- Equity at exit
- $19,383
- IRR
- 11.1%
- Equity multiple
- 1.90×
- Total profit
- $32,772
- Equity at exit
- $11,240
Cash invested: $36,400 (down + closing). Projections, not guarantees.
Landlord ↔ Tenant lean methodology
- Overall (STATE)
- 90 Strongly Landlord-Friendly
- State Alabama
- 90 Strongly Landlord-Friendly · R+15
- County
- — inherits STATE
- City
- — inherits STATE
ZIP-level market 35226
- Rents YoY
- 3.7%
- Active inventory
- 203
- Price-to-rent
- 7.0×
Monthly cashflow live
- Estimated rent
- $1,556 high interval (Pro) →
- Mortgage (P&I)
- −$682
- Tax est. 1.5%
- −$162 /mo · $1,950/yr
- Insurance
- −$54
- HOA
- −$0
- Vacancy / Maint / Mgmt
- −$327
- Net cashflow
- $331
Break-even live
UW: 25.0% down · 7.5% · 30yr · 1.5% tax · 5.0% vac · 8.0% maint · 8.0% mgmt
Financing live
Cash to close
- Down payment
- $32,500
- Closing costs
- $3,900
- Reserves months
- —
- Total cash needed
- —
Loan-product check · same deal, 3 products live
Conventional
25% down · 7.5% · 30yr
- Down + closing
- —
- Monthly P&I
- —
- Monthly cashflow
- —
- DSCR
- —
- Eligible?
- —
Personal DTI + credit; lowest rate.
DSCR
20% down · 8.5% · 30yr
- Down + closing
- —
- Monthly P&I
- —
- Monthly cashflow
- —
- DSCR
- —
- Eligible?
- —
No personal income docs; deal must DSCR.
Hard money
10% down · 12.0% · 12mo
- Down + closing
- —
- Monthly P&I
- —
- Monthly cashflow
- —
- DSCR
- —
- Eligible?
- —
Short-term bridge; refi at stabilization.
Rent comps 14 comps
| Address | Beds | Baths | Sqft | Rent | $/sqft | DOM | Units | Dist |
|---|---|---|---|---|---|---|---|---|
| 2410 Yellow Hammer Hl Birmingham, AL | 1.0–2.0 | 1.0–2.0 | 969 | $1,275 | $1.32 | 11d | 4 | 0.53mi |
| 1716 Vestawood Ct Unit 1715H Vestavia Hills, AL | 2.0 | 2.0 | 1080 | $1,314 | $1.22 | 43d | 1 | 0.74mi |
| 2555 Mountain Lodge Cir Vestavia Hills, AL | 1.0–3.0 | 1.0–2.0 | 1000 | $1,149 | $1.15 | 43d | 1 | 0.82mi |
| 2201 Darlington St Hoover, AL | 3.0 | 2.5 | 1361 | $2,500 | $1.84 | 3d | 1 | 0.83mi |
| 2209 Montreat Cir Unit D Vestavia Hills, AL | 2.0 | 2.0 | 1085 | $1,600 | $1.47 | 3d | 1 | 1.00mi |
| 2116 Montreat Ln Apt C Vestavia Hills, AL | 2.0 | 2.0 | 1148 | $1,450 | $1.26 | 43d | 1 | 1.01mi |
| 2076 Montreat Cir Vestavia Hills, AL | 2.0 | 2.0 | 1034 | $1,600 | $1.55 | 43d | 1 | 1.02mi |
| 2250 Little Valley Rd Hoover, AL | 3.0 | 1.0–2.0 | 894 | $1,278 | $1.43 | 43d | 1 | 1.13mi |
| 2105 Montreat Pkwy Unit D Vestavia Hills, AL | 2.0 | 1.0 | 1100 | $1,250 | $1.14 | 44d | 1 | 1.21mi |
| 2070 Vestavia Park Ct Unit 2023B Vestavia Hills, AL | 3.0 | 2.0 | 1125 | $1,500 | $1.33 | 23d | 1 | 1.40mi |
| 1400 Huckleberry Ln Birmingham, AL | 2.0–3.0 | 1.0–2.0 | 1120 | $929 | $0.83 | 1d | 44 | 1.45mi |
| 3101 Lorna Rd #924 Hoover, AL | 2.0 | 2.0 | 1023 | $1,750 | $1.71 | 19d | 1 | 1.47mi |
| 3101 Lorna Rd Unit ROAD924 Birmingham, AL | 2.0 | 2.0 | 965 | $1,750 | $1.81 | 1d | 1 | 1.47mi |
| 3101 Lorna Rd Hoover, AL | 1.0–2.0 | 1.0–2.0 | 1023 | $1,750 | $1.71 | 43d | 2 | 1.47mi |
HOA detail condo
- Monthly dues
- $0 · $0/yr
- Assessments
- None detected in remarks — confirm with the listing agent.
Listing history 1 events
-
2026-05-15$130,000 Active 29-char remark
ⓘ Source: listings_history table (triggers on properties + properties_extension) + one-shot
backfill from property_details.listing_events for pre-trigger history.
Climate risk First Street
- Flood 1/10 Low FEMA zone X (unshaded) · 0% chance over 30 yrs
- Wildfire 1/10 Low
- Heat 6/10 Major 7 d/yr ≥107°F today · 19 d/yr by 30 yrs out
- Wind 6/10 Major 27% chance of damaging wind over 30 yrs
- Air quality 4/10 Moderate 6 unhealthy d/yr today · 6 by 30 yrs out
Nearby sold comps map
Loading sold comps map…
Walkable amenities ~0.75 mi
Loading nearby amenities…
Taxation est. · year 1
- Rental income
- $18,668
- − Mortgage interest
- −$7,282
- − Property taxes
- −$1,950
- − Insurance
- −$650
- − Repairs & maintenance
- −$1,493
- − Management
- −$1,493
- − Depreciation
- −$3,782
- Taxable income
- $2,017
- Est. tax owed @ 24.0%
- −$484
- After-tax cash flow
- $3,483/yr
For passive investors: Depreciation is non-cash, so a rental often shows a tax loss while cash-flowing — sheltering income. Rental losses are passive: they offset passive income freely, and up to $25,000/yr can offset ordinary (W-2) income if you actively participate and your MAGI is under $100k (phasing out to $0 by $150k); unused losses carry forward. On sale, claimed depreciation is recaptured at up to 25%, and gains may owe capital-gains tax (a 1031 exchange can defer both). Figures are a year-1 estimate at your 24.0% rate — not tax advice; consult a CPA.
Condition & rehab AI · 2 photos
A well-maintained townhouse with average exterior and interior conditions, offering a great deal in Hoover.
Value-add opportunities
- Both Painting exterior siding — Enhances curb appeal and value
- Both Landscaping improvements — Enhances curb appeal and value
- Both Interior painting — Enhances interior appearance and value
Renovation cost estimate screening
Value-add ROI direction
- Both Painting exterior siding — Enhances curb appeal and value ↑
- Both Landscaping improvements — Enhances curb appeal and value ↑
- Both Interior painting — Enhances interior appearance and value ↑
ⓘ Cost ranges are severity-bucket heuristics (US national rule-of-thumb). Get contractor quotes + a written scope before underwriting a rehab budget.
Schools (NCES district)
- District
- Hoover City
- NCES district ID
- 0100007
- Math proficiency
- 45% ▼ -25.00%
- Reading proficiency
- 66% ▲ 1.00%
- Median HH income
- $76,210
- Composite
- 49.77/100
- National rank
- #1960
- State rank
- #8 of 129 in AL
Livability — Hoover
- Score
- 84/100
- State rank
- #1
- US rank
- #630
Category grades
Schools grade is shown separately in the Schools card above.
Census & demographics
- Census place
- Hoover, AL
- County
- Jefferson County · 527,445 people
- City population
- 76,805
- Metro
- Birmingham-Hoover, AL
- Population (ZIP)
- 38,588
- Household income
- $124,516
- Rent vs Own
- Severe rent burden
- 539.0
Population outlook (Jefferson County) Hauer SSP2
- Today (2025)
- 669,185 people
- By 2030
- 669,694 · +0.1%
- By 2040
- 661,388 · -1.2%
- By 2050
- 643,086 · -3.9%
- By 2075
- 577,267 · -13.7%
- By 2100
- 474,758 · -29.1%
Race, ethnicity, and origin ACS 2023
- Neighborhood character
- Predominantly White (73%)
- Race & ethnicity
- White 73% Black 13% Asian 8% Two or more races 4% Hispanic / Latino 4%
- Common ancestry
- Italian 6% Slovak 3% Serbian 3%
- Foreign-born
- 8% · Canada, China, South Korea
- Languages at home
- 90% English-only · Spanish 2% Other Indo-European 2% Chinese 2%
Political lean MEDSL · Jefferson
- 2024 margin
- D (+10.4) · D 54.6% · R 44.2% · Other 1.2%
- 2008→2024 swing
- +5.4pp toward D · 2008: 5.1pp · 2024: 10.4pp
- All cycles
- 2024: D+10.4 2020: D+13.2 2016: D+7.2 2012: D+6.0 2008: D+5.1
Not yet ingested
- Civics
- —
Market trends
- HPI YoY
- ▼ -200.60%
- Current HPI
- 214.5202
- Rent YoY
- ▲ 3.70%
- Metro
- Birmingham-Hoover, AL
- State GDP YoY
- ▲ 2.94%
- F500 in state
- 4
Industry mix (Fortune 500 HQ in AL)
| Industry | F500 HQs | Revenue |
|---|---|---|
| Financial Services | 1 | $8B |
|
||
| Healthcare | 1 | $5B |
|
||
Price history
2 events — show timeline
- 2026-05-21 Pending — Greater Alabama MLS
- 2026-05-15 Listed $130,000 Greater Alabama MLS
Cash-flow waterfall
monthlySold comps — $/sqft
last 12 mo · ≤1 miLoading sold comps…