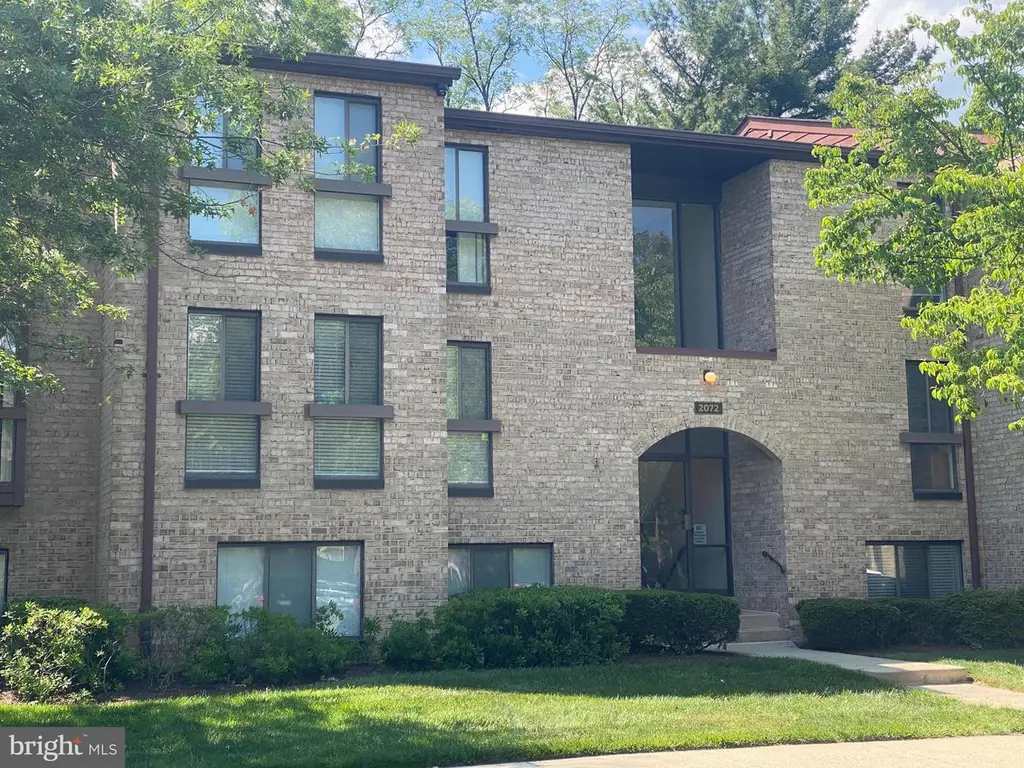
2072 Royal Fern Ct Unit 12B · Reston, VA
Flood risk 1/10 · Minimal
- FEMA flood zone
- X (unshaded)
- Chance of flooding over 30 yrs
- 0.0%
- Est. flood insurance / yr
- $507 – $1,088
Fire risk 1/10 · Minimal
- Est. fire insurance / yr
- $666 – $1,236
Heat risk 7/10 · Major
- Hot days now (above 102°F)
- 7 days/yr
- Hot days in 30 yrs
- 16 days/yr
Wind risk 4/10 · Minor
- Chance of severe wind over 30 yrs
- 12.0%
Air-quality risk 2/10 · Minimal
- Unhealthy air days now
- 1 days/yr
- Unhealthy air days in 30 yrs
- 2 days/yr
Risk factors via First Street. Map © Google.
Why this score? — see what drove the D+ grade
The composite is a weighted blend of 9 inputs, each scored 0–100. Each bar is that input's sub-score; the figure is the points it added to the 100-point composite (weight × sub-score).
- Cash flow +14.9/30.0
- ARV discount +7.5/15.0
- 1% rule +6.7/10.0
- Schools +6.3/10.0
- DSCR +4.6/10.0
- Livability +4.4/5.0
- Rent growth +2.9/5.0
- Condition / age +2.5/5.0
- Appreciation +0.0/10.0
$215,000
🖨 Deal sheet 📄 Offer letter ✓ Due diligence
Key facts
- $445 HOA
- Community pool
- Built 1973
Neighborhood map
What this means for you Summary
Snapshot
- This is a 2-bed/1.0-bath condo listed at $215k.
Deal economics
- At list price, monthly cash flow is $64 ($762/yr) — positive.
- The deal already cash-flows at list — no discount required.
- Meets the 1% rule at list price ($3k rent vs $215k).
- Cap rate 6.6% vs local median 2.5% in Reston — top-decile yield for the area; either an underpriced asset or a hidden risk that comps aren't pricing in. Stress-test before assuming the spread holds.
Location & tenants
- Location reads 88/100 on livability (#7 in VA, #177 nationally) — a professional / high-income tenant draw. Strengths: crime A+, commute A+, employment A+; Watch: cost of living F.
- Fairfax County Public School District (suburban): math 61% / reading 73% proficiency, ranked #13 of 131 in VA (top 10%) — acceptable for families but not a draw, mixed tenant base, ~2y average lease.
- Zoned schools: South Lakes High (math 51% / reading 62%, grade C, #270 of 319 statewide, top 86%, 2,530 students, 32% FRL).
- Market conditions: Rents rising (+1.8%/yr); 132 active listings in the ZIP; 40 comparable units currently listed for rent nearby; rentals at typical pace (median 15d on market — plan ~3-4 weeks tenant-placement turnaround); high-income renter base; 2,861 units permitted in Fairfax County in 2024 (1,829 in 5+ unit buildings).
Forward outlook
- Local home prices are declining (-3.0%/yr); year-one equity from $1k of loan paydown is wiped out by about $6k of value loss. Plan a longer hold.
- Fairfax County population projected at +13% by 2050 — modest demand growth; plan on rents tracking national, not racing it.
Negotiation context
- Only 0 days on market — expect competitive offers; lowballing is unlikely to land.
- 3 sale attempts since 31y ago with the ask held roughly flat each time — persistent listings suggest the price (not the market) is what's stuck; bring a comps-based counter.
- Current owner paid $74k; list at $215k implies a 193% gain — meaningful room to come down on a strong offer.
Risks & watch-outs
- Climate carrying-cost: extreme-heat days projected 7→16/yr by 2055 (HVAC capex compounding) — expect insurance premiums to compound above CPI over the hold.
Questions for the listing agent
- Built in 1973 — when were the roof, HVAC, electrical panel, plumbing, and water heater last replaced?
- What does the HOA fee cover, when was the last increase, and are there any pending special assessments or reserve-fund shortfalls?
- Any open or pending special assessments — roof, HVAC, plumbing, elevator, façade? What's the per-unit balance and payoff schedule, and is the seller paying it off at close or rolling it to the buyer?
- Is there a deadline driving the sale (1031 exchange, divorce, estate, relocation)? That informs how much negotiation room exists.
- Schools are A-rated — typically a magnet for longer-tenancy family renters. What's the average tenant stay here, and is there a school-zone premium baked into asking?
- The area grade is low — what's the realistic commute time and amenity access for the typical tenant pool here? Any planned neighborhood developments (good or bad) we should know about?
- What's the average days-on-market for RENTAL listings here right now (not sales)? A rising rental-DOM trend means longer vacancies and softer asking-rent achievability than the comps imply.
- What's the recent tenant-quality profile in this submarket — average credit score on applications, eviction rate, late-payment / NSF rate, and stable-employment percentage? A property-management company in the area should have these aggregated.
- How much new apartment / multifamily construction is in the pipeline within 1–3 miles? Heavy new supply (>2% of stock underway) typically softens rents 12–24 months out; light construction supports rent growth.
Investment metrics
- 1% rule
- 1.17% ✓
- Cap rate
- 6.65%
- Cash-on-cash
- 1.27%
- DSCR
- 1.06
- GRM
- 7.1
CMA / ARV
No comps found within radius.
Projected returns pro-forma
-3.0% appreciation · 1.78% rent growth · sell at horizon
- IRR
- -15.9%
- Equity multiple
- 0.44×
- Total profit
- $-33,543
- Equity at exit
- $32,057
- IRR
- -10.2%
- Equity multiple
- 0.42×
- Total profit
- $-34,992
- Equity at exit
- $18,589
Cash invested: $60,200 (down + closing). Projections, not guarantees.
Landlord ↔ Tenant lean methodology
- Overall (STATE)
- 55 Moderately Landlord-Leaning
- State Virginia
- 55 Moderately Landlord-Leaning · D+2
- County
- — inherits STATE
- City
- — inherits STATE
ZIP-level market 20191
- Rents YoY
- 1.8%
- Active inventory
- 132
- Price-to-rent
- 7.1×
Monthly cashflow live
- Estimated rent
- $2,524 high interval (Pro) →
- Mortgage (P&I)
- −$1,127
- Tax est. 1.5%
- −$269 /mo · $3,225/yr
- Insurance
- −$90
- HOA
- −$445
- Vacancy / Maint / Mgmt
- −$530
- Net cashflow
- $64
Break-even live
UW: 25.0% down · 7.5% · 30yr · 1.5% tax · 5.0% vac · 8.0% maint · 8.0% mgmt
Financing live
Cash to close
- Down payment
- $53,750
- Closing costs
- $6,450
- Reserves months
- —
- Total cash needed
- —
Loan-product check · same deal, 3 products live
Conventional
25% down · 7.5% · 30yr
- Down + closing
- —
- Monthly P&I
- —
- Monthly cashflow
- —
- DSCR
- —
- Eligible?
- —
Personal DTI + credit; lowest rate.
DSCR
20% down · 8.5% · 30yr
- Down + closing
- —
- Monthly P&I
- —
- Monthly cashflow
- —
- DSCR
- —
- Eligible?
- —
No personal income docs; deal must DSCR.
Hard money
10% down · 12.0% · 12mo
- Down + closing
- —
- Monthly P&I
- —
- Monthly cashflow
- —
- DSCR
- —
- Eligible?
- —
Short-term bridge; refi at stabilization.
Rent comps 40 comps
| Address | Beds | Baths | Sqft | Rent | $/sqft | DOM | Units | Dist |
|---|---|---|---|---|---|---|---|---|
| 2044 Royal Fern Ct Unit 19/2A Reston, VA | 1.0 | 1.0 | 860 | $1,950 | $2.27 | 24d | 1 | 0.04mi |
| 2018 Colts Neck Rd Unit 10/11B Reston, VA | 2.0 | 1.0 | 991 | $2,250 | $2.27 | 24d | 1 | 0.09mi |
| 12065 Greywing Sq Reston, VA | 1.0–2.0 | 1.0–1.5 | 946 | $2,064 | $2.18 | 1d | 21 | 0.25mi |
| 11990 Heafield WAY Reston, VA | 1.0–3.0 | 1.0–2.0 | 1164 | $3,616 | $3.11 | 1d | 116 | 0.29mi |
| 11830 Sunrise Valley Dr Reston, VA | 3.0 | 1.0–3.0 | 1174 | $3,038 | $2.59 | 1d | 26 | 0.43mi |
| 12265 Laurel Glade Ct Reston, VA | 1.0–3.0 | 1.0 | 881 | $2,248 | $2.55 | 3d | 8 | 0.49mi |
| 11760 Sunrise Valley Dr #508 Reston, VA | 1.0 | 1.0 | 720 | $1,950 | $2.71 | 43d | 1 | 0.55mi |
| 11864 Breton Ct Unit 14A Reston, VA | 3.0 | 2.5 | 1072 | $2,900 | $2.71 | 43d | 1 | 0.56mi |
| 2319 Freetown Ct Unit 23/21C Reston, VA | 3.0 | 1.0 | 1004 | $2,500 | $2.49 | 43d | 1 | 0.57mi |
| 2319 Freetown Ct Unit 21C Reston, VA | 3.0 | 1.0 | 1004 | $2,500 | $2.49 | 24d | 1 | 0.57mi |
| 11805 Breton Ct Unit 1A Reston, VA | 1.0 | 1.0 | 903 | $2,300 | $2.55 | 1d | 1 | 0.63mi |
| 11815 Breton Ct Reston, VA | 2.0 | 1.0 | 1073 | $2,200 | $2.05 | 43d | 1 | 0.63mi |
| 1925 Roland Clarke Pl Reston, VA | 2.0 | 1.0–2.0 | 905 | $3,225 | $3.56 | 1d | 22 | 0.70mi |
| 2294 White Cornus Ln Reston, VA | 2.0 | 2.5 | 1104 | $2,250 | $2.04 | 16d | 1 | 0.71mi |
| 11723 Karbon Hill Ct Unit T3 Reston, VA | 2.0 | 2.0 | 1053 | $2,250 | $2.14 | 14d | 1 | 0.75mi |
| 12000 Inspiration St Reston, VA | 3.0 | 1.0–2.5 | 982 | $4,347 | $4.42 | 2d | 37 | 0.79mi |
| 1897 Oracle Way Reston, VA | 1.0–3.0 | 1.0–2.5 | 1062 | $3,432 | $3.23 | 1d | 22 | 0.81mi |
| 11800 Sunset Hills Rd Reston, VA | 1.0–2.0 | 1.0–2.0 | 960 | $2,800 | $2.92 | 17d | 2 | 0.85mi |
| 11800 Sunset Hills Rd Reston, VA | 1.0 | 1.0 | 842 | $2,350 | $2.79 | 43d | 2 | 0.85mi |
| 11800 Sunset Hills Rd Reston, VA | 1.0 | 1.0 | 796 | $2,300 | $2.89 | 24d | 2 | 0.85mi |
| 11800 Sunset Hills Rd Reston, VA | 1.0–2.0 | 1.0–2.0 | 997 | $2,800 | $2.81 | 20d | 1 | 0.85mi |
| 2225 Lovedale Ln Unit 1 Reston, VA | 2.0 | 2.0 | 1108 | $2,400 | $2.17 | 24d | 1 | 0.88mi |
| 11500 Commerce Park Dr Reston, VA | 2.0 | 1.0–2.0 | 882 | $2,795 | $3.17 | 1d | 26 | 0.91mi |
| 12025 Town Square St Reston, VA | 2.0 | 1.0–2.0 | 919 | $3,838 | $4.18 | 1d | 26 | 0.94mi |
| 2231 Castle Rock Sq Unit 21C Reston, VA | 3.0 | 2.0 | 1029 | $2,418 | $2.35 | 43d | 1 | 0.94mi |
| 12001 Market St #377 Reston, VA | 2.0 | 2.0 | 1060 | $2,500 | $2.36 | 14d | 1 | 0.95mi |
| 12001 Market St Unit T51 Reston, VA | 1.0 | 1.0 | 751 | $1,899 | $2.53 | 10d | 1 | 0.95mi |
| 1860 Stratford Park Pl #201 Reston, VA | 2.0 | 2.0 | 930 | $2,500 | $2.69 | 12d | 1 | 0.98mi |
| 11659 Stoneview Sq Unit 11C Reston, VA | 3.0 | 2.0 | 1029 | $2,650 | $2.58 | 43d | 1 | 0.98mi |
| 2247 Castle Rock Sq Unit 12C Reston, VA | 3.0 | 2.0 | 1029 | $2,650 | $2.58 | 15d | 1 | 1.01mi |
| 12001 Market St Reston, VA | 1.0–2.0 | 1.0–2.0 | 875 | $2,500 | $2.86 | 17d | 2 | 1.01mi |
| 11990 Market St #216 Reston, VA | 1.0 | 2.0 | 939 | $2,900 | $3.09 | 18d | 1 | 1.03mi |
| 11645 Stoneview Sq Unit 1B Reston, VA | 2.0 | 2.0 | 894 | $2,000 | $2.24 | 43d | 1 | 1.03mi |
| 12000 Market St Reston, VA | 1.0 | 1.0 | 718 | $2,025 | $2.82 | 10d | 2 | 1.04mi |
| 12000 Market St Reston, VA | 1.0–2.0 | 1.0 | 818 | $3,200 | $3.91 | 5d | 1 | 1.04mi |
| 1815 Sycamore Valley Dr Reston, VA | 1.0–3.0 | 1.0–2.0 | 879 | $2,545 | $2.90 | 1d | 9 | 1.05mi |
| 11911 Freedom Dr Unit 1039947P Reston, VA | 1.0 | 1.0 | 688 | $6,390 | $9.29 | 7d | 1 | 1.06mi |
| 11911 Freedom Dr Unit 1039943P Reston, VA | 1.0–2.0 | 1.0–2.0 | 973 | $7,374 | $7.57 | 1d | 2 | 1.06mi |
| 11911 Freedom Dr Unit 1043417P Reston, VA | 1.0 | 1.0 | 688 | $6,823 | $9.92 | 12d | 1 | 1.06mi |
| 11850 Freedom Dr Reston, VA | 2.0 | 1.0–2.5 | 1152 | $5,495 | $4.77 | 1d | 43 | 1.11mi |
HOA detail condo
- Monthly dues
- $445 · $5,340/yr
- Assessments
- None detected in remarks — confirm with the listing agent.
Listing history 8 events
-
2026-05-21historical
-
2026-05-21$215,000
-
2000-02-28soldstatus $73,500
-
2000-02-02historical
-
1999-12-27$73,500
-
1995-08-30soldstatus $67,500
-
1995-07-25historical
-
1995-07-13$70,500
ⓘ Source: listings_history table (triggers on properties + properties_extension) + one-shot
backfill from property_details.listing_events for pre-trigger history.
Climate risk First Street
- Flood 1/10 Low FEMA zone X (unshaded) · 0% chance over 30 yrs
- Wildfire 1/10 Low
- Heat 7/10 Severe 7 d/yr ≥102°F today · 16 d/yr by 30 yrs out
- Wind 4/10 Moderate 12% chance of damaging wind over 30 yrs
- Air quality 2/10 Low 1 unhealthy d/yr today · 2 by 30 yrs out
Nearby sold comps map
Loading sold comps map…
Walkable amenities ~0.75 mi
Loading nearby amenities…
Taxation est. · year 1
- Rental income
- $30,294
- − Mortgage interest
- −$12,043
- − Property taxes
- −$3,225
- − Insurance
- −$1,075
- − Repairs & maintenance
- −$2,424
- − Management
- −$2,424
- − HOA
- −$5,340
- − Depreciation
- −$6,255
- Taxable loss
- −$2,491
- Est. tax savings @ 24.0%
- +$598
- After-tax cash flow
- $1,360/yr
For passive investors: Depreciation is non-cash, so a rental often shows a tax loss while cash-flowing — sheltering income. Rental losses are passive: they offset passive income freely, and up to $25,000/yr can offset ordinary (W-2) income if you actively participate and your MAGI is under $100k (phasing out to $0 by $150k); unused losses carry forward. On sale, claimed depreciation is recaptured at up to 25%, and gains may owe capital-gains tax (a 1031 exchange can defer both). Figures are a year-1 estimate at your 24.0% rate — not tax advice; consult a CPA.
Schools (NCES district)
- District
- Fairfax County Public School District
- NCES district ID
- 5101260
- Math proficiency
- 61% ▼ -24.00%
- Reading proficiency
- 73% ▼ -8.00%
- Median HH income
- $110,238
- Composite
- 62.59/100
- National rank
- #679
- State rank
- #13 of 131 in VA
Livability — Reston
- Score
- 88/100
- State rank
- #7
- US rank
- #177
Category grades
Schools grade is shown separately in the Schools card above.
Census & demographics
- Census place
- Reston, VA
- County
- Fairfax County · 1,104,456 people
- City population
- 65,298
- Metro
- Washington-Arlington-Alexandria, DC-VA-MD-WV
- Population (ZIP)
- 31,011
- Household income
- $151,185
- Rent vs Own
- Severe rent burden
- 751.0
Population outlook (Fairfax County) Hauer SSP2
- Today (2025)
- 1,237,259 people
- By 2030
- 1,277,758 · +3.3%
- By 2040
- 1,346,508 · +8.8%
- By 2050
- 1,397,919 · +13.0%
- By 2075
- 1,493,100 · +20.7%
- By 2100
- 1,465,712 · +18.5%
Race, ethnicity, and origin ACS 2023
- Neighborhood character
- Diverse neighborhood (Simpson 0.64)
- Race & ethnicity
- White 55% Hispanic / Latino 18% Asian 12% Two or more races 12% Black 9%
- Hispanic origin (detail)
- Mexican 1%
- Common ancestry
- Romanian 3% Slovak 2% Italian 2%
- Foreign-born
- 30% · Canada, China, Vietnam
- Languages at home
- 65% English-only · Spanish 14% Other Indo-European 8% Russian/Polish/Slavic 2%
Political lean MEDSL · Fairfax
- 2024 margin
- Solid D (+35.0) · D 66.1% · R 31.1% · Other 2.8%
- 2008→2024 swing
- +13.8pp toward D · 2008: 21.2pp · 2024: 35.0pp
- All cycles
- 2024: D+35.0 2020: D+41.9 2016: D+36.2 2012: D+19.8 2008: D+21.2
Not yet ingested
- Civics
- —
Market trends
- HPI YoY
- ▼ -394.27%
- Current HPI
- 335.9261
- Rent YoY
- ▲ 1.78%
- Metro
- Washington-Arlington-Alexandria, DC-VA-MD-WV
- State GDP YoY
- ▲ 2.40%
- F500 in state
- 50
Industry mix (Fortune 500 HQ in VA)
| Industry | F500 HQs | Revenue |
|---|---|---|
| Aerospace / Defense | 4 | $236B |
|
||
| Technology / Defense | 3 | $32B |
|
||
| Financial Services | 2 | $176B |
|
||
| Utilities | 2 | $27B |
|
||
| Insurance | 2 | $25B |
|
||
| Technology | 2 | $15B |
|
||
Price history
+205.0% since first listed8 events — show timeline
- 2026-05-21 Listed $215,000 BRIGHT MLS
- 2026-05-21 Listing Removed — BRIGHT MLS
- 2000-02-28 Sold (MLS) $73,500 MRIS
- 2000-02-02 Delisted — MRIS
- 1999-12-27 Listed $73,500 MRIS
- 1995-08-30 Sold (MLS) $67,500 MRIS
- 1995-07-25 Delisted — MRIS
- 1995-07-13 Listed $70,500 MRIS
Cash-flow waterfall
monthlySold comps — $/sqft
last 12 mo · ≤1 miLoading sold comps…