 🏗️ New Construction
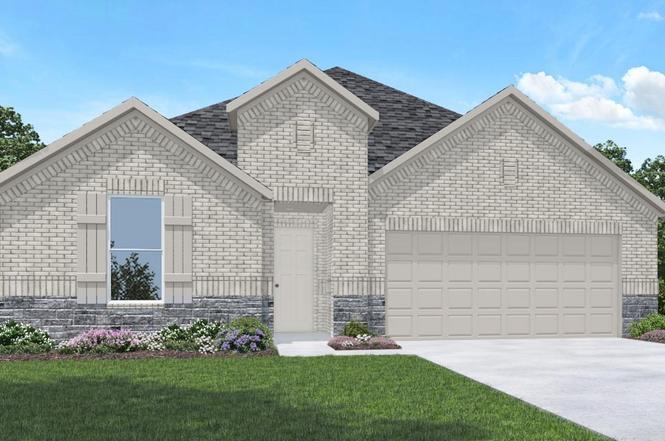
15214 Evening Light Dr · Magnolia, TX
Flood risk 1/10 · Minimal
- FEMA flood zone
- X (unshaded)
- Chance of flooding over 30 yrs
- 0.0%
- Est. flood insurance / yr
- $507 – $1,088
Fire risk 4/10 · Minor
- Est. fire insurance / yr
- $1,222 – $2,270
Heat risk 8/10 · Major
- Hot days now (above 111°F)
- 7 days/yr
- Hot days in 30 yrs
- 23 days/yr
Wind risk 8/10 · Major
- Chance of severe wind over 30 yrs
- 99.0%
Air-quality risk 2/10 · Minimal
- Unhealthy air days now
- 2 days/yr
- Unhealthy air days in 30 yrs
- 2 days/yr
Risk factors via First Street. Map © Google.
Why this score? — see what drove the D+ grade
The composite is a weighted blend of 9 inputs, each scored 0–100. Each bar is that input's sub-score; the figure is the points it added to the 100-point composite (weight × sub-score).
- Cash flow +11.5/30.0
- Appreciation +10.0/10.0
- ARV discount +7.5/15.0
- Schools +3.9/10.0
- Livability +3.7/5.0
- 1% rule +3.6/10.0
- DSCR +3.4/10.0
- Rent growth +2.6/5.0
- Condition / age +2.5/5.0
$354,740
🖨 Deal sheet (PDF) 📄 Offer letter ✓ Due diligence
Listing remarks
GORGEOUS finishes in this NEW DR HORTON 1 story 4 Bedroom home in Mill Creek Estates! Open Concept Living at its finest! MODERN features include 42" Cabinets, Built In Oven w/ 5 Burner Gas Cook-top, Large Farmhouse Sink, Lovely Primary Suite with Separate Tub & Shower, Smart Home, Deako Smart Switches, LED Canlights, 8' Solid Core Interior Doors w 5" Baseboards, Full Sprinklers, RINNAI Tankless Water Heater! Covered Patio w/ Gas Stub!! Great Outdoor Space! MILL CREEK ESTATES IN MAGNOLIA, TX offers beautiful lots, WALKING TRAILS, Playground, Pool, & BRAND NEW DOG PARK, Zoned to MAGNOLIA ISD! DR Horton is America's #1 Homebuilder! Come out to MILL CREEK ESTATES and make t
Key facts
- Led canlights
- Open concept living
- Smart home
Tags
Property features AI
Finance
- Other: Builder: D.R. Horton
- HOA & community: Association (Inframark); Annual association fee; Community pool; Dog park; Playground; Park; Curbs; Clubhouse and recreation facilities included in association fees
Exterior
- Parking: Attached 2-car garage; Driveway; Garage with garage door opener
- Security: Prewired for security; Owned security system; Smoke detectors
- Utilities: Public water; Public sewer
- Home design: Residential property; New construction (under construction); Faces south; Slab foundation
- Construction: Built in 2026; Brick, cement siding and stone exterior; Composition roof
- Exterior features: Covered patio; Deck; Patio; Private yard; Back yard fencing; Hot tub/spa (spa: hot tub); Subdivision lot; Concrete road access
Interior
- Kitchen: Dishwasher; Electric oven; Gas cooktop; Disposal; Microwave; Kitchen island; Breakfast bar; Quartz counters; Walk-in pantry
- Bedrooms: Primary bedroom (first level) — 15 x 14; Bedroom (first level) — 12 x 10; Bedroom (first level) — 12 x 10; Bedroom (first level) — 11 x 11
- Flooring: Plank flooring; Tile flooring; Vinyl flooring
- Bathrooms: 2 full bathrooms; Double vanity; Soaking tub; Separate shower; Tub/shower combination
- Heating & cooling: Central heating (gas); Central electric air conditioning
- Interior features: Breakfast bar; Double vanity; Entrance foyer; High ceilings; Kitchen island; Kitchen/family room combo; Quartz counters; Soaking tub; Separate shower; Tub/shower combination; Vanity; Walk-in pantry; Ceiling fan(s); Kitchen/dining combo; Programmable thermostat; Insulated doors; Low emissivity windows; Reverse osmosis system
- Laundry & utility: Washer hookup; Electric dryer hookup; Tankless water heater
Neighborhood map
What this means for you Summary
Snapshot
- This is a 4-bed/2.0-bath single-family listed at $355k.
Deal economics
- At list price, monthly cash flow is $-98 ($-1k/yr) — negative.
- To cash-flow at today's rent, offer at most $281k (20.8% below list).
- To meet the 1% rule (rent ≥ 1% of price), the offer needs to be $254k (28.5% below list).
- Recommended offer: $254k (28.5% below list) — sets the bar for 1% rule.
- Cap rate 5.9% vs local median 3.4% in Magnolia — top-decile yield for the area; either an underpriced asset or a hidden risk that comps aren't pricing in. Stress-test before assuming the spread holds.
Location & tenants
- Location reads 73/100 on livability (#222 in TX) — a middle-class / working-renter tenant base. Strengths: crime A+, cost of living A+, housing A+; Watch: amenities F, commute F.
- Magnolia ISD (rural): math 42% / reading 45% proficiency, ranked #247 of 826 in TX (top 30%) — families likely to look elsewhere, expect single-tenant / working-renter base with shorter leases.
- Zoned schools: Willie E Williams El (math 46% / reading 41%, grade F, #1,269 of 4,322 statewide, top 30%, 869 students, 70% FRL); Magnolia J H (math 35% / reading 37%, grade F, #805 of 1,662 statewide, top 50%, 1,103 students, 57% FRL); Magnolia H S (math 47% / reading 62%, grade C-, #379 of 1,632 statewide, top 26%, 2,248 students, 31% FRL).
- Market conditions: Rents flat; 1622 active listings in the ZIP; 7 comparable units currently listed for rent nearby; rentals at typical pace (median 26d on market — plan ~3-4 weeks tenant-placement turnaround); 43% of comp listings sitting > 30 days — soft ceiling on asking rent; high-income renter base; 13,259 units permitted in Montgomery County in 2024 (1,402 in 5+ unit buildings).
Forward outlook
- In year one you build about $32k of equity ($2k loan paydown + $29k appreciation (10.0% local appreciation)).
- Montgomery County population projected at +65% by 2050 — long-run rental-demand tailwind backs the buy-and-hold thesis.
- By year 2, paydown + projected appreciation supports a ~$51k cash-out refi (75% LTV) — recoverable capital for the next deal without selling this one.
Negotiation context
- Only 4 days on market — expect competitive offers; lowballing is unlikely to land.
Risks & watch-outs
- Climate carrying-cost: severe wind risk, 99% chance of damaging wind over 30y; extreme-heat days projected 7→23/yr by 2055 (HVAC capex compounding) — expect insurance premiums to compound above CPI over the hold.
Questions for the listing agent
- What do current leases actually rent for vs. the listed asking? Can we see a recent rent roll and the last 12 months of T-12 income?
- What does the HOA fee cover, when was the last increase, and are there any pending special assessments or reserve-fund shortfalls?
- Is there a deadline driving the sale (1031 exchange, divorce, estate, relocation)? That informs how much negotiation room exists.
- Schools are D-rated, which usually means shorter tenancies and higher turnover. Who's the typical renter profile here, and what's been the actual vacancy rate?
- The area grade is low — what's the realistic commute time and amenity access for the typical tenant pool here? Any planned neighborhood developments (good or bad) we should know about?
- What's the average days-on-market for RENTAL listings here right now (not sales)? A rising rental-DOM trend means longer vacancies and softer asking-rent achievability than the comps imply.
- What's the recent tenant-quality profile in this submarket — average credit score on applications, eviction rate, late-payment / NSF rate, and stable-employment percentage? A property-management company in the area should have these aggregated.
- How much new for-sale + rental construction is in the pipeline within 1–3 miles? Heavy new supply typically softens prices + rents 12–24 months out; constrained supply supports both.
Investment metrics
- 1% rule
- 0.86% ✗
- Cap rate
- 5.89%
- Cash-on-cash
- -1.42%
- DSCR
- 0.94
- GRM
- 9.7
CMA / ARV
- ARV (on-the-fly)
- $294,986
- Comps found
- 12
Show comp detail 12 sales within ~0.75 mi
| Address | Dist | Beds/Ba | Sqft | Sold | Price | $/sf | Match |
|---|---|---|---|---|---|---|---|
| 40814 Hawthorne Glades St | 0.30mi | 5/2.0 (+1) | 1,882 (+1%) | 0mo | $279,990 | $149 | 80 |
| 40807 Hawthorne Glades | 0.27mi | 5/2.5 (+1) | 1,892 (+1%) | 2mo | $259,990 | $137 | 77 |
| 40966 Seasoned Oak Ln | 0.29mi | 5/2.5 (+1) | 1,892 (+1%) | 3mo | $254,990 | $135 | 75 |
| 41046 Riverside Meadows Dr | 0.10mi | 4/3.0 | 2,060 (+10%) | 3mo | $366,540 | $178 | 72 |
| 14805 Prickly Pear Cv | 0.52mi | 4/2.0 | 1,934 (+4%) | 3mo | $295,000 | $153 | 67 |
| 15019 Baikal Teal Ter | 0.48mi | 3/2.0 (-1) | 1,931 (+3%) | 0mo | $317,900 | $165 | 67 |
| 40603 Balsam Run Ln | 0.38mi | 4/3.0 | 2,041 (+9%) | 1mo | $321,990 | $158 | 62 |
| 40610 Mill Creek Rd | 0.39mi | 4/2.0 | 2,082 (+12%) | 2mo | $575,000 | $276 | 61 |
| 15315 Mountain Plover Pl | 0.54mi | 4/2.5 | 1,689 (-10%) | 1mo | $299,990 | $178 | 56 |
| 15307 Mountain Plover Pl | 0.55mi | 4/2.5 | 2,064 (+11%) | 1mo | $314,900 | $153 | 54 |
| 15459 Park Perch Pl | 0.60mi | 4/2.5 | 2,061 (+10%) | 2mo | $309,990 | $150 | 51 |
| 15443 Park Perch Pl | 0.61mi | 4/2.5 | 2,064 (+11%) | 2mo | $327,900 | $159 | 50 |
Match score weights: distance 35% · size 25% · config 20% · recency 20%. Top-matched comps best support the ARV.
Projected returns pro-forma
10.0% appreciation · 0.32% rent growth · sell at horizon
- IRR
- 22.4%
- Equity multiple
- 2.79×
- Total profit
- $147,827
- Equity at exit
- $265,747
- IRR
- 19.5%
- Equity multiple
- 6.19×
- Total profit
- $428,303
- Equity at exit
- $573,093
Cash invested: $82,596 (down + closing). Projections, not guarantees.
Landlord ↔ Tenant lean methodology
- Overall (STATE)
- 87 Strongly Landlord-Friendly
- State Texas
- 87 Strongly Landlord-Friendly · R+5
- County
- — inherits STATE
- City
- — inherits STATE
ZIP-level market 77354
- Home prices YoY
- 2.4%
- Rents YoY
- 0.3%
- Active inventory
- 1622
- Price-to-rent
- 11.7×
Monthly cashflow live
- Estimated rent
- $2,536 high interval (Pro) →
- Mortgage (P&I)
- −$1,547
- Tax est. 1.5%
- −$369 /mo · $4,425/yr
- Insurance
- −$123
- HOA
- −$63
- Vacancy / Maint / Mgmt
- −$533
- Net cashflow
- $-98
Break-even live
Sensitivity live
| Price | -10% $106 | -5% $4 | +0% $-98 | +5% $-200 | +10% $-302 |
|---|---|---|---|---|---|
| Rent | -10% $-298 | -5% $-198 | +0% $-98 | +5% $2 | +10% $102 |
| Rate | -1.0pp $50 | -0.5pp $-23 | base $-98 | +0.5pp $-175 | +1.0pp $-252 |
UW: 25.0% down · 7.5% · 30yr · 1.5% tax · 5.0% vac · 8.0% maint · 8.0% mgmt
Financing live
Cash to close
- Down payment
- $73,746
- Closing costs
- $8,850
- Reserves months
- —
- Total cash needed
- —
Loan-product check · same deal, 3 products live
Conventional
25% down · 7.5% · 30yr
- Down + closing
- —
- Monthly P&I
- —
- Monthly cashflow
- —
- DSCR
- —
- Eligible?
- —
Personal DTI + credit; lowest rate.
DSCR
20% down · 8.5% · 30yr
- Down + closing
- —
- Monthly P&I
- —
- Monthly cashflow
- —
- DSCR
- —
- Eligible?
- —
No personal income docs; deal must DSCR.
Hard money
10% down · 12.0% · 12mo
- Down + closing
- —
- Monthly P&I
- —
- Monthly cashflow
- —
- DSCR
- —
- Eligible?
- —
Short-term bridge; refi at stabilization.
Rent comps 7 comps
| Address | Beds | Baths | Sqft | Rent | $/sqft | DOM | Units | Dist |
|---|---|---|---|---|---|---|---|---|
| 15128 Lavender Mist Ct Magnolia, TX | 4.0 | 3.0 | 2561 | $2,800 | $1.09 | 21d | 1 | 0.25mi |
| 14983 Clay Harvest Rdg Magnolia, TX | 4.0 | 3.0 | 2173 | $2,375 | $1.09 | 45d | 1 | 0.35mi |
| 14541 Montclair Way Montgomery, TX | 4.0 | 3.0 | 2170 | $2,200 | $1.01 | 0d | 1 | 0.51mi |
| 14727 Band Tailed Pigeon Ct Magnolia, TX | 4.0 | 3.0 | 1942 | $2,700 | $1.39 | 45d | 1 | 0.76mi |
| 39899 Mill Creek Rd Magnolia, TX | 1.0–3.0 | 1.0–2.0 | 1104 | $2,726 | $2.47 | 0d | 40 | 1.03mi |
| 40547 Berylline Ln Magnolia, TX | 4.0 | 2.0 | 1753 | $2,300 | $1.31 | 45d | 1 | 1.23mi |
| 40558 Berylline Ln Unit NA Magnolia, TX | 3.0 | 2.0 | 1499 | $2,150 | $1.43 | 26d | 1 | 1.25mi |
HOA detail
- Monthly dues
- $63 · $756/yr
- Likely covers
- watergaspool
Listing history 3 events
-
2026-06-21days on market $354,740 Active 4 DOM
-
2026-06-17remarks 681-char remark
-
2026-06-17$354,740 Active 1 DOM
ⓘ Source: listings_history table (triggers on properties + properties_extension) + one-shot
backfill from property_details.listing_events for pre-trigger history.
Climate risk First Street
- Flood 1/10 Low FEMA zone X (unshaded) · 0% chance over 30 yrs
- Wildfire 4/10 Moderate
- Heat 8/10 Severe 7 d/yr ≥111°F today · 23 d/yr by 30 yrs out
- Wind 8/10 Severe 99% chance of damaging wind over 30 yrs
- Air quality 2/10 Low 2 unhealthy d/yr today · 2 by 30 yrs out
Nearby sold comps map
Loading sold comps map…
Walkable amenities ~0.75 mi
Loading nearby amenities…
Taxation est. · year 1
- Rental income
- $30,433
- − Mortgage interest
- −$16,524
- − Property taxes
- −$4,425
- − Insurance
- −$1,475
- − Repairs & maintenance
- −$2,435
- − Management
- −$2,435
- − HOA
- −$756
- − Depreciation
- −$8,581
- Taxable loss
- −$6,197
- Est. tax savings @ 24.0%
- +$1,487
- After-tax cash flow
- $310/yr
For passive investors: Depreciation is non-cash, so a rental often shows a tax loss while cash-flowing — sheltering income. Rental losses are passive: they offset passive income freely, and up to $25,000/yr can offset ordinary (W-2) income if you actively participate and your MAGI is under $100k (phasing out to $0 by $150k); unused losses carry forward. On sale, claimed depreciation is recaptured at up to 25%, and gains may owe capital-gains tax (a 1031 exchange can defer both). Figures are a year-1 estimate at your 24.0% rate — not tax advice; consult a CPA.
Schools (NCES district)
- District
- Magnolia ISD
- NCES district ID
- 4828740
- Math proficiency
- 42% ▼ -7.00%
- Reading proficiency
- 45% ▼ -4.00%
- Median HH income
- $71,692
- Composite
- 39.46/100
- National rank
- #3958
- State rank
- #247 of 826 in TX
Livability — Magnolia
- Score
- 73/100
- State rank
- #222
- US rank
- #5442
Category grades
Schools grade is shown separately in the Schools card above.
Census & demographics
- County
- Montgomery County · 663,713 people
- City population
- 32,847
- Metro
- Houston-The Woodlands-Sugar Land, TX
- Population (ZIP)
- 44,900
- Household income
- $112,504
- Rent vs Own
- Severe rent burden
- 586.0
Population outlook (Montgomery County) Hauer SSP2
- Today (2025)
- 713,896 people
- By 2030
- 805,263 · +12.8%
- By 2040
- 992,708 · +39.1%
- By 2050
- 1,179,590 · +65.2%
- By 2075
- 1,628,084 · +128.1%
- By 2100
- 1,937,880 · +171.5%
Race, ethnicity, and origin ACS 2023
- Neighborhood character
- Predominantly White (66%)
- Race & ethnicity
- White 66% Hispanic / Latino 25% Two or more races 18% Black 3% Asian 1%
- Hispanic origin (detail)
- Mexican 14% Puerto Rican 1%
- Common ancestry
- Lithuanian 4% Slovak 2% Italian 2%
- Foreign-born
- 11% · Canada, Vietnam
- Languages at home
- 83% English-only · Spanish 15% Other Indo-European 1% German/W. Germanic 1%
Political lean MEDSL · Montgomery
- 2024 margin
- Solid R (+45.5) · D 26.8% · R 72.3%
- 2008→2024 swing
- +7.2pp toward D · 2008: -52.7pp · 2024: -45.5pp
- All cycles
- 2024: R+45.5 2020: R+43.8 2016: R+51.4 2012: R+60.7 2008: R+52.7
Not yet ingested
- Civics
- —
Market trends
- HPI YoY
- ▲ 12.09%
- Current HPI
- 512.87
- Rent YoY
- ▲ 0.32%
- Metro
- Houston-The Woodlands-Sugar Land, TX
- State GDP YoY
- ▲ 3.95%
- F500 in state
- 110
Industry mix (Fortune 500 HQ in TX)
| Industry | F500 HQs | Revenue |
|---|---|---|
| Energy | 16 | $1,198B |
|
||
| Technology | 5 | $198B |
|
||
| Engineering / Construction | 4 | $72B |
|
||
| Energy Services | 3 | $60B |
|
||
| Utilities | 3 | $41B |
|
||
| Healthcare | 2 | $330B |
|
||
Price history
1 event — show timeline
- 2026-06-17 Listed $354,740 HARMLS
Cash-flow waterfall
monthlySold comps — $/sqft
last 12 mo · ≤1 miLoading sold comps…