 🏗️ New Construction
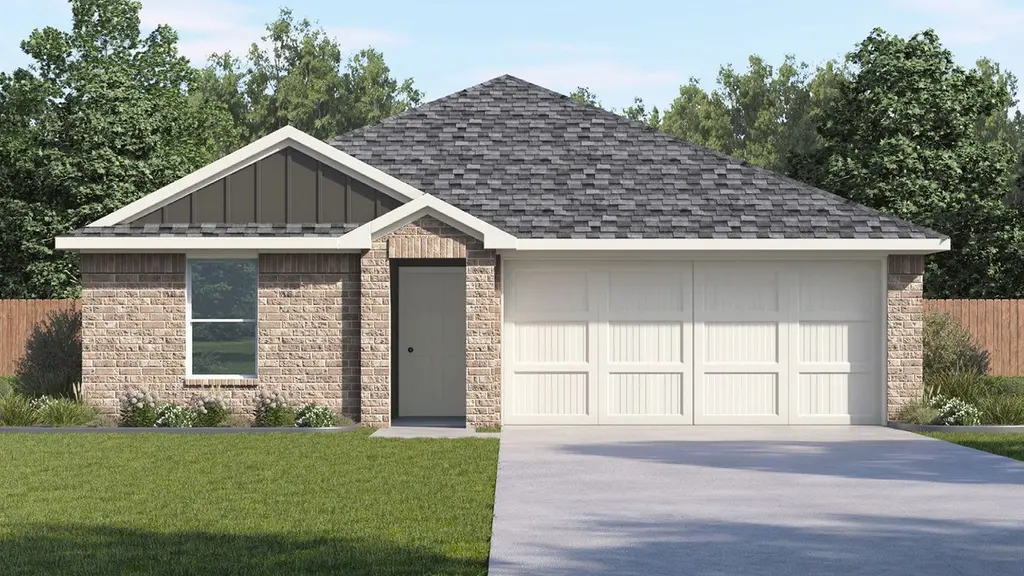
Anderson Plan · Sealy, TX
Flood risk No data
- FEMA flood zone
- —
- Chance of flooding over 30 yrs
- —
- Est. flood insurance / yr
- —
Fire risk No data
- Est. fire insurance / yr
- —
Heat risk No data
- Hot days now (above threshold)
- —
- Hot days in 30 yrs
- —
Wind risk No data
- Chance of severe wind over 30 yrs
- —
Air-quality risk No data
- Unhealthy air days now
- —
- Unhealthy air days in 30 yrs
- —
Risk factors via First Street. Map © Google.
Why this score? — see what drove the D grade
The composite is a weighted blend of 9 inputs, each scored 0–100. Each bar is that input's sub-score; the figure is the points it added to the 100-point composite (weight × sub-score).
- Cash flow +15.8/30.0
- ARV discount +7.5/15.0
- DSCR +4.9/10.0
- 1% rule +4.3/10.0
- Livability +3.5/5.0
- Schools +3.4/10.0
- Rent growth +2.5/5.0
- Condition / age +2.2/5.0
- Appreciation +0.0/10.0
$261,990
🖨 Deal sheet (PDF) 📄 Offer letter ✓ Due diligence
Listing remarks MLS
The Anderson at Westward Pointe is a beautifully designed 1,328 sq. ft. single-story home that lives effortlessly. The open family room, kitchen, and dining space create a warm, inviting hub for everyday moments and easy entertaining. The kitchen stands out with premium countertops, sleek cabinetry, and stainless-steel appliances, anchored by a spacious center island and generous pantry. Tucked away is the private primary suite includes an en-suite bath and walk-in closet, while two additional bedrooms are situated separately and share a full secondary bathroom perfect for family, guests, or a home office setup. A welcoming foyer opens from the covered front porch, and the attached two-car garage provides convenient direct access to the home. Designed with efficiency and comfort in mind, The Anderson offers smart use of space, ample storage, and a layout that lives larger than its square footage. * Images and 3D tour are for illustration only and options may vary from home as built.
Key facts
- Generous pantry
- Sleek cabinetry
- Premium countertops
Tags
Neighborhood map
What this means for you Summary
Snapshot
- This is a 3-bed/2.0-bath single-family listed at $262k. Condition is rated fair.
Deal economics
- At list price, monthly cash flow is $119 ($1k/yr) — positive.
- The deal already cash-flows at list — no discount required.
- To meet the 1% rule (rent ≥ 1% of price), the offer needs to be $240k (8.4% below list).
- Recommended offer: $238k (9.0% below list) — sets the bar for market timing.
- Cap rate 6.8% vs local median 2.6% in Sealy — top-decile yield for the area; either an underpriced asset or a hidden risk that comps aren't pricing in. Stress-test before assuming the spread holds.
Location & tenants
- Location reads 70/100 on livability (#342 in TX) — a middle-class / working-renter tenant base. Strengths: cost of living A+, housing A+, crime A; Watch: amenities F, commute F.
- Sealy ISD (rural): math 39% / reading 39% proficiency, ranked #405 of 826 in TX (top 49%) — families likely to look elsewhere, expect single-tenant / working-renter base with shorter leases.
- Zoned schools: Selman El (math 31% / reading 36%, grade F, #2,174 of 4,322 statewide, top 51%, 639 students, 71% FRL); Sealy J H (math 38% / reading 38%, grade F, #717 of 1,662 statewide, top 44%, 664 students, 63% FRL); Sealy H S (math 42% / reading 44%, grade F, #713 of 1,632 statewide, top 44%, 903 students, 61% FRL).
- Market conditions: 312 active listings in the ZIP; 1 comparable units currently listed for rent nearby; 410 units permitted in Austin County in 2024 (0 in 5+ unit buildings).
Forward outlook
- Local home prices are declining (-3.0%/yr); year-one equity from $2k of loan paydown is wiped out by about $8k of value loss. Plan a longer hold.
- Austin County population projected at +18% by 2050 — long-run rental-demand tailwind backs the buy-and-hold thesis.
Negotiation context
- It's been on market 102 days — a 9% lower offer ($238k) is reasonable based on typical stale-listing flexibility.
Questions for the listing agent
- It's been on market 102 days. Have you received any prior offers? Is the seller open to a 9% concession, seller financing, or rate buy-down credit?
- Have any recent inspections been done? Can we get a copy of the seller's disclosures and any deferred-maintenance estimates?
- Why hasn't it sold? Are there any deal-killer items the seller is aware of (foundation, flood, title, zoning, code violations)?
- Is there a deadline driving the sale (1031 exchange, divorce, estate, relocation)? That informs how much negotiation room exists.
- Schools are D-rated, which usually means shorter tenancies and higher turnover. Who's the typical renter profile here, and what's been the actual vacancy rate?
- The area grade is low — what's the realistic commute time and amenity access for the typical tenant pool here? Any planned neighborhood developments (good or bad) we should know about?
- What's the average days-on-market for RENTAL listings here right now (not sales)? A rising rental-DOM trend means longer vacancies and softer asking-rent achievability than the comps imply.
- What's the recent tenant-quality profile in this submarket — average credit score on applications, eviction rate, late-payment / NSF rate, and stable-employment percentage? A property-management company in the area should have these aggregated.
- How much new for-sale + rental construction is in the pipeline within 1–3 miles? Heavy new supply typically softens prices + rents 12–24 months out; constrained supply supports both.
Investment metrics
- 1% rule
- 0.93% ✗
- Cap rate
- 6.85%
- Cash-on-cash
- 1.98%
- DSCR
- 1.09
- GRM
- 8.9
CMA / ARV
- ARV (median comp)
- $257,139
- List price
- $261,990
- Delta
- 1.89%
- Verdict
- FAIR
- Comps
- 20 within 1.0 mi
Projected returns pro-forma
-3.0% appreciation · 3.0% rent growth · sell at horizon
- IRR
- -13.1%
- Equity multiple
- 0.53×
- Total profit
- $-34,054
- Equity at exit
- $38,340
- IRR
- -4.1%
- Equity multiple
- 0.73×
- Total profit
- $-19,749
- Equity at exit
- $22,233
Cash invested: $71,999 (down + closing). Projections, not guarantees.
Landlord ↔ Tenant lean methodology
- Overall (STATE)
- 87 Strongly Landlord-Friendly
- State Texas
- 87 Strongly Landlord-Friendly · R+5
- County
- — inherits STATE
- City
- — inherits STATE
ZIP-level market 77474
- Active inventory
- 312
- Price-to-rent
- 9.1×
Monthly cashflow live
- Estimated rent
- $2,400 medium interval (Pro) →
- Mortgage (P&I)
- −$1,348
- Tax est. 1.5%
- −$321 /mo · $3,857/yr
- Insurance
- −$107
- HOA
- −$0
- Vacancy / Maint / Mgmt
- −$504
- Net cashflow
- $119
Break-even live
Sensitivity live
| Price | -10% $297 | -5% $208 | +0% $119 | +5% $30 | +10% $-59 |
|---|---|---|---|---|---|
| Rent | -10% $-71 | -5% $24 | +0% $119 | +5% $214 | +10% $309 |
| Rate | -1.0pp $248 | -0.5pp $184 | base $119 | +0.5pp $52 | +1.0pp $-15 |
UW: 25.0% down · 7.5% · 30yr · 1.5% tax · 5.0% vac · 8.0% maint · 8.0% mgmt
Financing live
Cash to close
- Down payment
- $64,285
- Closing costs
- $7,714
- Reserves months
- —
- Total cash needed
- —
Loan-product check · same deal, 3 products live
Conventional
25% down · 7.5% · 30yr
- Down + closing
- —
- Monthly P&I
- —
- Monthly cashflow
- —
- DSCR
- —
- Eligible?
- —
Personal DTI + credit; lowest rate.
DSCR
20% down · 8.5% · 30yr
- Down + closing
- —
- Monthly P&I
- —
- Monthly cashflow
- —
- DSCR
- —
- Eligible?
- —
No personal income docs; deal must DSCR.
Hard money
10% down · 12.0% · 12mo
- Down + closing
- —
- Monthly P&I
- —
- Monthly cashflow
- —
- DSCR
- —
- Eligible?
- —
Short-term bridge; refi at stabilization.
Rent comps 1 comps
| Address | Beds | Baths | Sqft | Rent | $/sqft | DOM | Units | Dist |
|---|---|---|---|---|---|---|---|---|
| 305 Morning Dove Trl Sealy, TX | 4.0 | 2.0 | 1845 | $2,400 | $1.30 | 0d | 1 | 0.67mi |
Listing history 16 events
-
2026-06-21days on market $261,990 Active 102 DOM
-
2026-06-18days on market $261,990 Active 99 DOM
-
2026-06-17days on market $261,990 Active 98 DOM
-
2026-06-16days on market $261,990 Active 97 DOM
-
2026-06-15days on market $261,990 Active 96 DOM
-
2026-06-13days on market $261,990 Active 94 DOM
-
2026-06-09days on market $261,990 Active 90 DOM
-
2026-06-08days on market $261,990 Active 89 DOM
-
2026-06-07days on market $261,990 Active 88 DOM
-
2026-06-04days on market $261,990 Active 85 DOM
-
2026-06-03days on market $261,990 Active 84 DOM
-
2026-06-02days on market $261,990 Active 83 DOM
-
2026-06-01days on market $261,990 Active 82 DOM
-
2026-05-31days on market $261,990 Active 81 DOM
-
2026-05-17price $261,990 997-char remark
Show marketing remark (997 chars)
The Anderson at Westward Pointe is a beautifully designed 1,328 sq. ft. single-story home that lives effortlessly. The open family room, kitchen, and dining space create a warm, inviting hub for everyday moments and easy entertaining. The kitchen stands out with premium countertops, sleek cabinetry, and stainless-steel appliances, anchored by a spacious center island and generous pantry. Tucked away is the private primary suite includes an en-suite bath and walk-in closet, while two additional bedrooms are situated separately and share a full secondary bathroom perfect for family, guests, or a home office setup. A welcoming foyer opens from the covered front porch, and the attached two-car garage provides convenient direct access to the home. Designed with efficiency and comfort in mind, The Anderson offers smart use of space, ample storage, and a layout that lives larger than its square footage. * Images and 3D tour are for illustration only and options may vary from home as built.
-
2026-03-11$259,990 Active 997-char remark
Show marketing remark (997 chars)
The Anderson at Westward Pointe is a beautifully designed 1,328 sq. ft. single-story home that lives effortlessly. The open family room, kitchen, and dining space create a warm, inviting hub for everyday moments and easy entertaining. The kitchen stands out with premium countertops, sleek cabinetry, and stainless-steel appliances, anchored by a spacious center island and generous pantry. Tucked away is the private primary suite includes an en-suite bath and walk-in closet, while two additional bedrooms are situated separately and share a full secondary bathroom perfect for family, guests, or a home office setup. A welcoming foyer opens from the covered front porch, and the attached two-car garage provides convenient direct access to the home. Designed with efficiency and comfort in mind, The Anderson offers smart use of space, ample storage, and a layout that lives larger than its square footage. * Images and 3D tour are for illustration only and options may vary from home as built.
ⓘ Source: listings_history table (triggers on properties + properties_extension) + one-shot
backfill from property_details.listing_events for pre-trigger history.
Nearby sold comps map
Loading sold comps map…
Walkable amenities ~0.75 mi
Loading nearby amenities…
Taxation est. · year 1
- Rental income
- $28,800
- − Mortgage interest
- −$14,404
- − Property taxes
- −$3,857
- − Insurance
- −$1,286
- − Repairs & maintenance
- −$2,304
- − Management
- −$2,304
- − Depreciation
- −$7,480
- Taxable loss
- −$2,835
- Est. tax savings @ 24.0%
- +$680
- After-tax cash flow
- $2,108/yr
For passive investors: Depreciation is non-cash, so a rental often shows a tax loss while cash-flowing — sheltering income. Rental losses are passive: they offset passive income freely, and up to $25,000/yr can offset ordinary (W-2) income if you actively participate and your MAGI is under $100k (phasing out to $0 by $150k); unused losses carry forward. On sale, claimed depreciation is recaptured at up to 25%, and gains may owe capital-gains tax (a 1031 exchange can defer both). Figures are a year-1 estimate at your 24.0% rate — not tax advice; consult a CPA.
Condition & rehab AI · 2 photos
The home is in fair condition with good roof and exterior. It needs exterior painting and gutter maintenance to enhance its curb appeal and resale value.
Value-add opportunities
- Both Paint exterior — Enhances curb appeal and resale value
- Both Replace or clean gutters — Improves drainage and prevents water damage
Renovation cost estimate screening
Value-add ROI direction
- Both Paint exterior — Enhances curb appeal and resale value ↑
- Both Replace or clean gutters — Improves drainage and prevents water damage ↑
ⓘ Cost ranges are severity-bucket heuristics (US national rule-of-thumb). Get contractor quotes + a written scope before underwriting a rehab budget.
Schools (NCES district)
- District
- Sealy ISD
- NCES district ID
- 4839630
- Math proficiency
- 39% ▼ -6.00%
- Reading proficiency
- 39% ▼ -2.00%
- Median HH income
- $57,842
- Composite
- 34.42/100
- National rank
- #5200
- State rank
- #405 of 826 in TX
Livability — Sealy
- Score
- 70/100
- State rank
- #342
- US rank
- #7463
Category grades
Schools grade is shown separately in the Schools card above.
Census & demographics
- Census place
- Sealy, TX
- Population (ZIP)
- 14,846
Population outlook (Austin County) Hauer SSP2
- Today (2025)
- 32,206 people
- By 2030
- 33,459 · +3.9%
- By 2040
- 35,809 · +11.2%
- By 2050
- 37,933 · +17.8%
- By 2075
- 44,179 · +37.2%
- By 2100
- 47,870 · +48.6%
Race, ethnicity, and origin ACS 2023
- Neighborhood character
- Diverse neighborhood (Simpson 0.58)
- Race & ethnicity
- White 56% Hispanic / Latino 32% Black 9% Two or more races 8% Asian 1%
- Hispanic origin (detail)
- Mexican 28%
- Common ancestry
- Romanian 2% Lithuanian 1% Serbian 1%
- Foreign-born
- 12% · Canada
- Languages at home
- 73% English-only · Spanish 24% Russian/Polish/Slavic 1% Other Indo-European 1%
Political lean MEDSL · Austin
- 2024 margin
- Solid R (+62.7) · D 18.3% · R 81.0%
- 2008→2024 swing
- -11.8pp toward R · 2008: -50.9pp · 2024: -62.7pp
- All cycles
- 2024: R+62.7 2020: R+58.4 2016: R+59.7 2012: R+60.3 2008: R+50.9
Not yet ingested
- Civics
- —
Market trends
- HPI YoY
- ▼ -130.57%
- Current HPI
- 195.9491
- Rent YoY
- —
- Metro
- —
- State GDP YoY
- ▲ 3.95%
- F500 in state
- 110
Industry mix (Fortune 500 HQ in TX)
| Industry | F500 HQs | Revenue |
|---|---|---|
| Energy | 16 | $1,198B |
|
||
| Technology | 5 | $198B |
|
||
| Engineering / Construction | 4 | $72B |
|
||
| Energy Services | 3 | $60B |
|
||
| Utilities | 3 | $41B |
|
||
| Healthcare | 2 | $330B |
|
||
Price history
+0.8% since first listed2 events — show timeline
- 2026-05-17 Price Changed $261,990 Zillow
- 2026-03-11 Listed $259,990 Zillow
Cash-flow waterfall
monthlySold comps — $/sqft
last 12 mo · ≤1 miLoading sold comps…