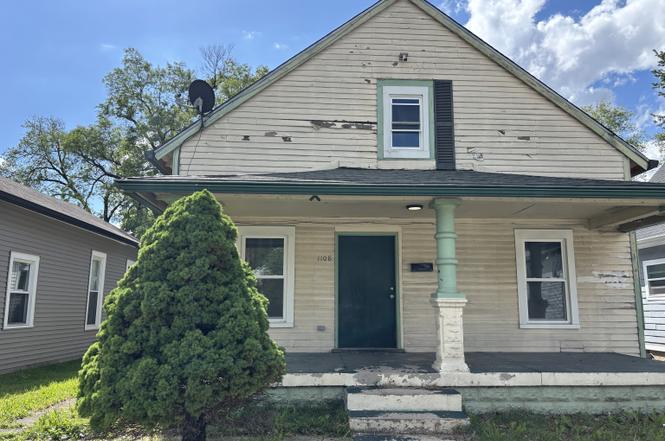
1108 N Warman Ave · Indianapolis city (balance), IN
Flood risk 4/10 · Minor
- FEMA flood zone
- X (unshaded)
- Chance of flooding over 30 yrs
- 0.22%
- Est. flood insurance / yr
- $507 – $1,088
Fire risk 1/10 · Minimal
- Est. fire insurance / yr
- $717 – $1,331
Heat risk 4/10 · Minor
- Hot days now (above 102°F)
- 7 days/yr
- Hot days in 30 yrs
- 19 days/yr
Wind risk 2/10 · Minimal
- Chance of severe wind over 30 yrs
- 0.0%
Air-quality risk 4/10 · Minor
- Unhealthy air days now
- 5 days/yr
- Unhealthy air days in 30 yrs
- 7 days/yr
Risk factors via First Street. Map © Google.
Why this score? — see what drove the B grade
The composite is a weighted blend of 9 inputs, each scored 0–100. Each bar is that input's sub-score; the figure is the points it added to the 100-point composite (weight × sub-score).
- Cash flow +30.0/30.0
- ARV discount +15.0/15.0
- 1% rule +10.0/10.0
- DSCR +10.0/10.0
- Rent growth +3.1/5.0
- Livability +2.5/5.0
- Condition / age +2.5/5.0
- Schools +1.4/10.0
- Appreciation +0.0/10.0
$108,500
🖨 Deal sheet 📄 Offer letter ✓ Due diligence
Listing remarks
Opportunity knocks at 1108 N Warman Ave! This home is being sold as-is, offering the perfect chance for an investor, rehabber, or buyer looking to build equity with some vision and elbow grease. The property features solid structure and great bones, making it an ideal candidate for a thoughtful refresh. Inside, the home is ready for a full cosmetic update-bring your ideas and transform the space into something truly special. With the right improvements, this property has strong potential for value-add upside whether as a flip or long-term hold. Conveniently located with easy access to downtown Indianapolis, schools, and major routes, this is a great opportunity to invest in an area with con
Key facts
- Full cosmetic update
- Solid structure
- 4,792 sq ft lot
Tags
Property features AI
Finance
- Other: Lot under 1/4 acre (about 0.11 acres); Approximately 1,303 sq ft living area (1,693 total building area; finished lower/basement area included ~58 sq ft)
Exterior
- Parking: Alley access
- Utilities: Public water; Municipal sewer connected; Electricity connected; Natural gas connected; Solid waste service available
- Home design: Single-family residence; Two levels; Property classified as residential (fixer condition)
- Construction: Crawl space foundation; Other construction materials
- Exterior features: Covered patio/porch; Storage shed; No fence
Interior
- Kitchen: Electric oven; Refrigerator
- Bedrooms: Two bedrooms total (one on the main level, one on the upper level); Upper bedroom approx. 14 x 9; Main bedroom approx. 12 x 12
- Bathrooms: One full bathroom with a full shower stall
- Heating & cooling: Electric heating; Central air conditioning
- Interior features: Attic access; Partial finished basement
- Laundry & utility: Main level laundry room (approx. 8 x 10); Water heater included
Neighborhood map
What this means for you Summary
Snapshot
- This is a 3-bed/1.0-bath single-family listed at $108k.
Deal economics
- At list price, monthly cash flow is $568 ($7k/yr) — positive.
- The deal already cash-flows at list — no discount required.
- Meets the 1% rule at list price ($2k rent vs $108k).
- Cap rate 12.6% vs local median 4.4% in Indianapolis city (balance) — top-decile yield for the area; either an underpriced asset or a hidden risk that comps aren't pricing in. Stress-test before assuming the spread holds.
Location & tenants
- Location reads: area grade B — affects rentability + tenant quality, not the cash-flow math above.
- Indianapolis Public Schools (urban): math 14% / reading 20% proficiency, ranked #286 of 301 in IN (top 95%) — low school quality limits family demand, transient renter base, plan for 1-2y turnover; 77% free/reduced lunch — lower-income household profile, screen leases tightly.
- Market conditions: Rents rising (+2.5%/yr); 170 active listings in the ZIP; 21 comparable units currently listed for rent nearby; rentals at typical pace (median 16d on market — plan ~3-4 weeks tenant-placement turnaround); 1,906 units permitted in Marion County in 2024 (621 in 5+ unit buildings).
- This rent runs 39% of the median local income ($51k/yr) — at the standard rent-burdened threshold; future hikes will face affordability resistance.
Forward outlook
- Local home prices are declining (-3.0%/yr); year-one equity from $750 of loan paydown is wiped out by about $3k of value loss. Plan a longer hold.
- Marion County population projected at +18% by 2050 — long-run rental-demand tailwind backs the buy-and-hold thesis.
- At projected returns (-3.0% appreciation + 2.5% rent growth), your $30k cash investment doubles in ~6 years — after that, you're playing with house money.
Negotiation context
- Only 2 days on market — expect competitive offers; lowballing is unlikely to land.
- 2 sale attempts since 7y ago with the ask held roughly flat each time — persistent listings suggest the price (not the market) is what's stuck; bring a comps-based counter.
- Current owner paid $75k; 45% above their basis — modest negotiation headroom, anchor on the comps not their cost.
Risks & watch-outs
- Watch-outs: built in 1913 — expect roof / HVAC / electrical / plumbing capex.
Questions for the listing agent
- Built in 1913 — when were the roof, HVAC, electrical panel, plumbing, and water heater last replaced?
- Is there a deadline driving the sale (1031 exchange, divorce, estate, relocation)? That informs how much negotiation room exists.
- What's the average days-on-market for RENTAL listings here right now (not sales)? A rising rental-DOM trend means longer vacancies and softer asking-rent achievability than the comps imply.
- What's the recent tenant-quality profile in this submarket — average credit score on applications, eviction rate, late-payment / NSF rate, and stable-employment percentage? A property-management company in the area should have these aggregated.
- How much new for-sale + rental construction is in the pipeline within 1–3 miles? Heavy new supply typically softens prices + rents 12–24 months out; constrained supply supports both.
Investment metrics
- 1% rule
- 1.52% ✓
- Cap rate
- 12.57%
- Cash-on-cash
- 22.43%
- DSCR
- 2.00
- GRM
- 5.5
CMA / ARV
- ARV (on-the-fly)
- $139,916
- Comps found
- 12
Show comp detail 12 sales within ~0.75 mi
| Address | Dist | Beds/Ba | Sqft | Sold | Price | $/sf | Match |
|---|---|---|---|---|---|---|---|
| 1325 Sharon Ave | 0.25mi | 2/1.5 (-1) | 1,782 (-3%) | 2mo | $145,000 | $81 | 74 |
| 1051 N Mount St | 0.25mi | 3/1.0 | 1,986 (+8%) | 3mo | $123,000 | $62 | 72 |
| 1114 King Ave | 0.13mi | 2/1.0 (-1) | 2,080 (+13%) | 4mo | $125,000 | $60 | 64 |
| 1062 N Berwick Ave | 0.66mi | 4/1.0 (+1) | 1,886 (+2%) | 5mo | $133,000 | $71 | 56 |
| 405 N Holmes Ave | 0.67mi | 2/1.5 (-1) | 1,920 (+4%) | 0mo | $69,900 | $36 | 54 |
| 3018 W 16th St | 0.42mi | 3/1.5 | 2,080 (+13%) | 3mo | $125,000 | $60 | 54 |
| 417 N Goodlet Ave | 0.72mi | 3/2.5 | 1,896 (+3%) | 2mo | $187,000 | $99 | 54 |
| 525 N Concord St | 0.53mi | 3/1.5 | 2,026 (+10%) | 4mo | $142,000 | $70 | 54 |
| 443 N Centennial St | 0.72mi | 4/2.0 (+1) | 1,820 (-1%) | 3mo | $145,000 | $80 | 53 |
| 1909 N Goodlet Ave | 0.74mi | 4/1.5 (+1) | 1,960 (+6%) | 2mo | $195,100 | $100 | 47 |
| 1911 Sharon Ave | 0.68mi | 2/1.0 (-1) | 1,636 (-11%) | 1mo | $125,000 | $76 | 44 |
| 2014 W Michigan St | 0.74mi | 3/2.5 | 2,070 (+12%) | 1mo | $315,000 | $152 | 38 |
Match score weights: distance 35% · size 25% · config 20% · recency 20%. Top-matched comps best support the ARV.
Projected returns pro-forma
-3.0% appreciation · 2.46% rent growth · sell at horizon
- IRR
- 14.6%
- Equity multiple
- 1.58×
- Total profit
- $17,705
- Equity at exit
- $16,178
- IRR
- 23.0%
- Equity multiple
- 2.92×
- Total profit
- $58,429
- Equity at exit
- $9,381
Cash invested: $30,380 (down + closing). Projections, not guarantees.
Landlord ↔ Tenant lean methodology
- Overall (STATE)
- 90 Strongly Landlord-Friendly
- State Indiana
- 90 Strongly Landlord-Friendly · R+11
- County
- — inherits STATE
- City
- — inherits STATE
ZIP-level market 46222
- Home prices YoY
- -16.7%
- Rents YoY
- 2.5%
- Active inventory
- 170
- Price-to-rent
- 5.5×
Monthly cashflow live
- Estimated rent
- $1,647 high interval (Pro) →
- Mortgage (P&I)
- −$569
- Tax from tax record
- −$119 /mo · $1,430/yr
- Insurance
- −$45
- HOA
- −$0
- Vacancy / Maint / Mgmt
- −$346
- Net cashflow
- $568
Break-even live
UW: 25.0% down · 7.5% · 30yr · 1.5% tax · 5.0% vac · 8.0% maint · 8.0% mgmt
Financing live
Cash to close
- Down payment
- $27,125
- Closing costs
- $3,255
- Reserves months
- —
- Total cash needed
- —
Loan-product check · same deal, 3 products live
Conventional
25% down · 7.5% · 30yr
- Down + closing
- —
- Monthly P&I
- —
- Monthly cashflow
- —
- DSCR
- —
- Eligible?
- —
Personal DTI + credit; lowest rate.
DSCR
20% down · 8.5% · 30yr
- Down + closing
- —
- Monthly P&I
- —
- Monthly cashflow
- —
- DSCR
- —
- Eligible?
- —
No personal income docs; deal must DSCR.
Hard money
10% down · 12.0% · 12mo
- Down + closing
- —
- Monthly P&I
- —
- Monthly cashflow
- —
- DSCR
- —
- Eligible?
- —
Short-term bridge; refi at stabilization.
Rent comps 21 comps
| Address | Beds | Baths | Sqft | Rent | $/sqft | DOM | Units | Dist |
|---|---|---|---|---|---|---|---|---|
| 1118 King Ave Indianapolis, IN | 3.0 | 1.0 | 1560 | $1,299 | $0.83 | 16d | 1 | 0.12mi |
| 742 N Sheffield Ave Unit 1228636P Indianapolis, IN | 4.0 | 2.0 | 1851 | $3,472 | $1.88 | 1d | 1 | 0.49mi |
| 545 N Goodlet Ave Indianapolis, IN | 3.0 | 1.0 | 1664 | $1,250 | $0.75 | 23d | 1 | 0.53mi |
| 955 N Traub Ave Indianapolis, IN | 3.0 | 2.0 | 1300 | $1,449 | $1.11 | 43d | 1 | 0.57mi |
| 326 N Warman Ave Indianapolis, IN | 3.0 | 2.5 | 1804 | $2,150 | $1.19 | 1d | 1 | 0.76mi |
| 3531 Garden Ave Indianapolis, IN | 3.0 | 1.0 | 1264 | $1,200 | $0.95 | 23d | 1 | 0.76mi |
| 3531 Garden Ave Indianapolis, IN | 3.0 | 1.0 | 1264 | $1,200 | $0.95 | 43d | 1 | 0.76mi |
| 2952 W New York St Indianapolis, IN | 2.0 | 2.5 | 1882 | $2,000 | $1.06 | 1d | 1 | 0.81mi |
| 2952 W New York St Indianapolis, IN | 2.0 | 2.5 | 1867 | $2,000 | $1.07 | 21d | 1 | 0.81mi |
| 264 N Holmes Ave Indianapolis, IN | 2.0 | 1.0 | 1540 | $1,199 | $0.78 | 23d | 1 | 0.85mi |
| 234 N Addison St Indianapolis, IN | 3.0 | 2.0 | 1892 | $1,900 | $1.00 | 43d | 1 | 0.90mi |
| 261 N Pershing Ave Indianapolis, IN | 2.0 | 2.0 | 1764 | $1,600 | $0.91 | 23d | 1 | 0.92mi |
| 156 Haugh St Indianapolis, IN | 3.0 | 2.5 | 1800 | $2,000 | $1.11 | 43d | 1 | 0.99mi |
| 1410 Breedlove Ln Indianapolis, IN | 2.0 | 1.0–2.0 | 886 | $2,557 | $2.88 | 1d | 63 | 1.14mi |
| 1551 W New York St Indianapolis, IN | 3.0 | 2.0 | 2619 | $1,600 | $0.61 | 7d | 1 | 1.16mi |
| 3621 Lawnview Ln Indianapolis, IN | 1.0–4.0 | 1.0–1.5 | 1012 | $1,162 | $1.15 | 1d | 13 | 1.36mi |
| 1920 Sugar Grove Ave Indianapolis, IN | 3.0 | 1.5 | 1378 | $1,175 | $0.85 | 2d | 1 | 1.36mi |
| 2602 Mansion Dr Indianapolis, IN | 2.0–3.0 | 2.0 | 1850 | $1,675 | $0.91 | 7d | 6 | 1.40mi |
| 1201 Indiana Ave Indianapolis, IN | 1.0–3.0 | 1.0–3.5 | 967 | $2,404 | $2.49 | 1d | 36 | 1.40mi |
| 1449 Montcalm St Indianapolis, IN | 3.0 | 1.0 | 1300 | $1,900 | $1.46 | 43d | 1 | 1.45mi |
| 1631 Montcalm St Indianapolis, IN | 3.0 | 2.0 | 2592 | $2,000 | $0.77 | 7d | 1 | 1.49mi |
Listing history 3 events
-
2026-06-18days on market $108,500 Active 2 DOM
-
2026-06-16remarks 699-char remark
-
2026-06-16$108,500 Active 1 DOM
ⓘ Source: listings_history table (triggers on properties + properties_extension) + one-shot
backfill from property_details.listing_events for pre-trigger history.
Tax reassessment forecast IN · Partial reset (capped growth)
- Current annual tax
- $1,430 · $119/mo
- Projected year-2 tax
- $1,430 · $119/mo
- Expected delta
- $0/yr ($0/mo · 0.0%)
ⓘ Screening estimate from a state-policy table — verify with the county assessor before closing.
Climate risk First Street
- Flood 4/10 Moderate FEMA zone X (unshaded) · 22% chance over 30 yrs
- Wildfire 1/10 Low
- Heat 4/10 Moderate 7 d/yr ≥102°F today · 19 d/yr by 30 yrs out
- Wind 2/10 Low 0% chance of damaging wind over 30 yrs
- Air quality 4/10 Moderate 5 unhealthy d/yr today · 7 by 30 yrs out
Nearby sold comps map
Loading sold comps map…
Walkable amenities ~0.75 mi
Loading nearby amenities…
Taxation est. · year 1
- Rental income
- $19,764
- − Mortgage interest
- −$6,078
- − Property taxes
- −$1,430
- − Insurance
- −$542
- − Repairs & maintenance
- −$1,581
- − Management
- −$1,581
- − Depreciation
- −$3,156
- Taxable income
- $5,395
- Est. tax owed @ 24.0%
- −$1,295
- After-tax cash flow
- $5,518/yr
For passive investors: Depreciation is non-cash, so a rental often shows a tax loss while cash-flowing — sheltering income. Rental losses are passive: they offset passive income freely, and up to $25,000/yr can offset ordinary (W-2) income if you actively participate and your MAGI is under $100k (phasing out to $0 by $150k); unused losses carry forward. On sale, claimed depreciation is recaptured at up to 25%, and gains may owe capital-gains tax (a 1031 exchange can defer both). Figures are a year-1 estimate at your 24.0% rate — not tax advice; consult a CPA.
Schools (NCES district)
- District
- Indianapolis Public Schools
- NCES district ID
- 1804770
- Math proficiency
- 14% ▼ -7.00%
- Reading proficiency
- 20% ▼ -3.00%
- Median HH income
- $32,034
- Composite
- 13.69/100
- National rank
- #9499
- State rank
- #286 of 301 in IN
Livability — Indianapolis city (balance)
No livability data for this city. (Only ~50 U.S. cities are tracked.)
Census & demographics
- Census place
- Indianapolis city (balance), IN
- County
- Marion County · 998,460 people
- City population
- 881,119
- Metro
- Indianapolis-Carmel-Anderson, IN
- Population (ZIP)
- 38,887
- Household income
- $50,783
- Rent vs Own
- Severe rent burden
- 1750.0
Population outlook (Marion County) Hauer SSP2
- Today (2025)
- 1,025,572 people
- By 2030
- 1,065,727 · +3.9%
- By 2040
- 1,141,577 · +11.3%
- By 2050
- 1,208,920 · +17.9%
- By 2075
- 1,367,288 · +33.3%
- By 2100
- 1,438,201 · +40.2%
Race, ethnicity, and origin ACS 2023
- Neighborhood character
- Highly diverse neighborhood (Simpson 0.72)
- Race & ethnicity
- White 32% Black 30% Hispanic / Latino 30% Two or more races 12% Asian 2%
- Hispanic origin (detail)
- Mexican 24% Puerto Rican 1%
- Common ancestry
- Lithuanian 1% Iranian 1% Slovak 1%
- Foreign-born
- 21% · Canada, Jamaica
- Languages at home
- 67% English-only · Spanish 25% Other Indo-European 3% Arabic 2%
Political lean MEDSL · Marion
- 2024 margin
- Strong D (+27.7) · D 63.0% · R 35.3% · Other 1.7%
- 2008→2024 swing
- -0.7pp no change · 2008: 28.4pp · 2024: 27.7pp
- All cycles
- 2024: D+27.7 2020: D+29.1 2016: D+22.8 2012: D+22.2 2008: D+28.4
Not yet ingested
- Civics
- —
Market trends
- HPI YoY
- ▼ -75.47%
- Current HPI
- 375.8479
- Rent YoY
- ▲ 2.46%
- Metro
- Indianapolis-Carmel-Anderson, IN
- State GDP YoY
- ▲ 2.90%
- F500 in state
- 18
Industry mix (Fortune 500 HQ in IN)
| Industry | F500 HQs | Revenue |
|---|---|---|
| Industrial Machinery | 2 | $37B |
|
||
| Healthcare | 1 | $177B |
|
||
| Pharmaceuticals | 1 | $45B |
|
||
| Metals / Steel | 1 | $18B |
|
||
| Agriculture | 1 | $17B |
|
||
| Packaging | 1 | $12B |
|
||
Price history
+81.1% since first listed6 events — show timeline
- 2026-06-15 Listed $108,500 MIBOR as Distributed by MLS Grid
- 2025-04-03 Sold (Public Records) $74,900 Public Records
- 2019-08-14 Listing Removed — MIBOR as Distributed by MLS Grid
- 2019-06-21 Price Changed $52,900 MIBOR as Distributed by MLS Grid
- 2019-06-03 Price Changed $54,900 MIBOR as Distributed by MLS Grid
- 2019-04-03 Listed $59,900 MIBOR as Distributed by MLS Grid
Property tax history
+22.3%/yrLatest (2025): $1,430 · -47.3% YoY. Source: county tax records.
Cash-flow waterfall
monthlySold comps — $/sqft
last 12 mo · ≤1 miLoading sold comps…