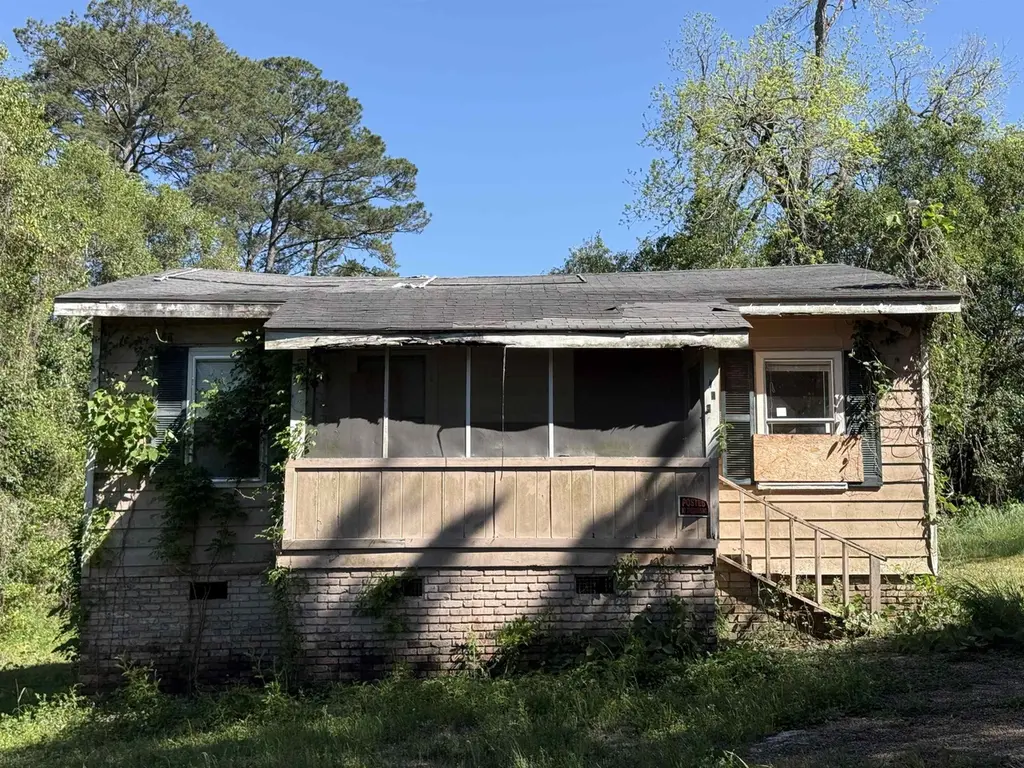
108 East Jerger St · Thomasville, GA
Flood risk 5/10 · Moderate
- FEMA flood zone
- X (unshaded)
- Chance of flooding over 30 yrs
- 0.24%
- Est. flood insurance / yr
- $507 – $1,088
Fire risk 3/10 · Minor
- Est. fire insurance / yr
- $963 – $1,789
Heat risk 8/10 · Major
- Hot days now (above 108°F)
- 7 days/yr
- Hot days in 30 yrs
- 19 days/yr
Wind risk 9/10 · Severe
- Chance of severe wind over 30 yrs
- 99.0%
Air-quality risk 5/10 · Moderate
- Unhealthy air days now
- 8 days/yr
- Unhealthy air days in 30 yrs
- 8 days/yr
Risk factors via First Street. Map © Google.
Why this score? — see what drove the B+ grade
The composite is a weighted blend of 9 inputs, each scored 0–100. Each bar is that input's sub-score; the figure is the points it added to the 100-point composite (weight × sub-score).
- Cash flow +30.0/30.0
- ARV discount +15.0/15.0
- 1% rule +10.0/10.0
- DSCR +10.0/10.0
- Livability +3.6/5.0
- Schools +2.7/10.0
- Rent growth +2.5/5.0
- Condition / age +2.5/5.0
- Appreciation +0.0/10.0
$48,000
🖨 Deal sheet 📄 Offer letter ✓ Due diligence
Listing remarks MLS
Exceptional investment opportunity on a generous 0.61-acre lot. This property offers a rare chance to reimagine and restore in one of the area’s most desirable locations. Ideal for investors, builders, and developers seeking a project with strong location fundamentals and long-term value potential. The lot has been rezoned to muti-family use. One structure with multiple units allowed. You may split the lot to increase the number of builds. Opportunities with this combination of lot size and location are increasingly rare. Sold as-is. Cash or renovation financing preferred.
Key facts
- Custom residence
- 0.61-acre lot
- Downtown district
Tags
Neighborhood map
What this means for you Summary
Snapshot
- This is a 3-bed/1.0-bath single-family listed at $48k.
Deal economics
- At list price, monthly cash flow is $1k ($14k/yr) — positive.
- The deal already cash-flows at list — no discount required.
- Meets the 1% rule at list price ($2k rent vs $48k).
- Recommended offer: $45k (6.0% below list) — sets the bar for market timing.
- Cap rate 35.3% vs local median 3.7% in Thomasville — top-decile yield for the area; either an underpriced asset or a hidden risk that comps aren't pricing in. Stress-test before assuming the spread holds.
Location & tenants
- Location reads 71/100 on livability (#77 in GA) — a middle-class / working-renter tenant base. Strengths: amenities A+, cost of living A+, health & safety A+; Watch: schools D, crime F, commute F.
- Thomasville City (town): math 29% / reading 37% proficiency, ranked #87 of 174 in GA (top 50%) — families likely to look elsewhere, expect single-tenant / working-renter base with shorter leases; 60% free/reduced lunch — lower-income household profile, screen leases tightly.
- Market conditions: 203 active listings in the ZIP; 2 comparable units currently listed for rent nearby; 213 units permitted in Thomas County in 2024 (72 in 5+ unit buildings).
- This rent runs 45% of the median local income ($50k/yr) — at the standard rent-burdened threshold; future hikes will face affordability resistance.
Forward outlook
- Local home prices are declining (-3.0%/yr); year-one equity from $332 of loan paydown is wiped out by about $1k of value loss. Plan a longer hold.
- Thomas County population projected to shrink 7% by 2050 — rents likely to lag national; underwrite the cash flow, not the appreciation.
- At projected returns (-3.0% appreciation + 3.0% rent growth), your $13k cash investment doubles in ~2 years — after that, you're playing with house money.
Negotiation context
- It's been on market 66 days — a 6% lower offer ($45k) is reasonable based on typical stale-listing flexibility.
- 2 sale attempts since 5y ago; this cycle's ask has dropped $15k (24%) from the opening price — seller is motivated, your offer sets the floor, not the list.
- Current owner paid $8k; list at $48k implies a 465% gain — meaningful room to come down on a strong offer.
Risks & watch-outs
- Climate carrying-cost: moderate flood risk; severe wind risk, 99% chance of damaging wind over 30y; extreme-heat days projected 7→19/yr by 2055 (HVAC capex compounding) — expect insurance premiums to compound above CPI over the hold.
Questions for the listing agent
- It's been on market 66 days. Have you received any prior offers? Is the seller open to a 6% concession, seller financing, or rate buy-down credit?
- Built in 1972 — when were the roof, HVAC, electrical panel, plumbing, and water heater last replaced?
- Why hasn't it sold? Are there any deal-killer items the seller is aware of (foundation, flood, title, zoning, code violations)?
- Is there a deadline driving the sale (1031 exchange, divorce, estate, relocation)? That informs how much negotiation room exists.
- Schools are D-rated, which usually means shorter tenancies and higher turnover. Who's the typical renter profile here, and what's been the actual vacancy rate?
- Crime grade is F in this area — have there been break-ins, vandalism, or insurance claims at this property in the last 3 years? What carrier currently insures it and at what premium?
- What's the average days-on-market for RENTAL listings here right now (not sales)? A rising rental-DOM trend means longer vacancies and softer asking-rent achievability than the comps imply.
- What's the recent tenant-quality profile in this submarket — average credit score on applications, eviction rate, late-payment / NSF rate, and stable-employment percentage? A property-management company in the area should have these aggregated.
- How much new for-sale + rental construction is in the pipeline within 1–3 miles? Heavy new supply typically softens prices + rents 12–24 months out; constrained supply supports both.
Investment metrics
- 1% rule
- 3.93% ✓
- Cap rate
- 35.26%
- Cash-on-cash
- 103.47%
- DSCR
- 5.60
- GRM
- 2.1
CMA / ARV
- ARV (median comp)
- $94,563
- List price
- $48,000
- Delta
- -49.24%
- Verdict
- UNDERPRICED
- Comps
- 20 within 1.0 mi
Show comp detail 12 sales within ~0.75 mi
| Address | Dist | Beds/Ba | Sqft | Sold | Price | $/sf | Match |
|---|---|---|---|---|---|---|---|
| 915 N Crawford St | 0.16mi | 3/1.0 | 1,108 (+11%) | 14mo | $35,000 | $32 | 62 |
| 341 E Washington St | 0.52mi | 2/2.0 (-1) | 969 (-3%) | 2mo | $149,900 | $155 | 60 |
| 105 Sunnyland Ct | 0.39mi | 2/1.0 (-1) | 966 (-3%) | 17mo | $147,000 | $152 | 58 |
| 1214 N Dawson St | 0.52mi | 2/1.0 (-1) | 1,028 (+3%) | 11mo | $138,500 | $135 | 56 |
| 609 E Clay St | 0.50mi | 3/1.0 | 960 (-4%) | 18mo | $105,000 | $109 | 55 |
| 102 Dixon St | 0.61mi | 3/2.0 | 1,010 (+2%) | 14mo | $165,500 | $164 | 54 |
| 1307 N Dawson St | 0.58mi | 3/1.0 | 1,112 (+12%) | 5mo | $80,000 | $72 | 50 |
| 520 E Walcott St | 0.45mi | 2/1.0 (-1) | 925 (-7%) | 17mo | $45,000 | $49 | 48 |
| 339 E Washington St | 0.52mi | 2/2.0 (-1) | 900 (-10%) | 4mo | $140,000 | $156 | 47 |
| 1110 N Young St | 0.68mi | 2/1.0 (-1) | 1,104 (+11%) | 7mo | $137,500 | $125 | 39 |
| 104 Dixon St | 0.61mi | 2/1.0 (-1) | 848 (-15%) | 5mo | $134,000 | $158 | 37 |
| 210 Old Albany Rd | 0.68mi | 2/1.0 (-1) | 1,044 (+5%) | 22mo | $100,000 | $96 | 37 |
Match score weights: distance 35% · size 25% · config 20% · recency 20%. Top-matched comps best support the ARV.
Projected returns pro-forma
-3.0% appreciation · 3.0% rent growth · sell at horizon
- IRR
- —
- Equity multiple
- 5.91×
- Total profit
- $66,056
- Equity at exit
- $7,157
- IRR
- —
- Equity multiple
- 12.36×
- Total profit
- $152,672
- Equity at exit
- $4,150
Cash invested: $13,440 (down + closing). Projections, not guarantees.
Landlord ↔ Tenant lean methodology
- Overall (STATE)
- 90 Strongly Landlord-Friendly
- State Georgia
- 90 Strongly Landlord-Friendly · R+3
- County
- — inherits STATE
- City
- — inherits STATE
ZIP-level market 31792
- Home prices YoY
- -29.0%
- Active inventory
- 203
- Price-to-rent
- 2.1×
Monthly cashflow live
- Estimated rent
- $1,887 medium interval (Pro) →
- Mortgage (P&I)
- −$252
- Tax est. 1.5%
- −$60 /mo · $720/yr
- Insurance
- −$20
- HOA
- −$0
- Vacancy / Maint / Mgmt
- −$396
- Net cashflow
- $1,159
Break-even live
UW: 25.0% down · 7.5% · 30yr · 1.5% tax · 5.0% vac · 8.0% maint · 8.0% mgmt
Financing live
Cash to close
- Down payment
- $12,000
- Closing costs
- $1,440
- Reserves months
- —
- Total cash needed
- —
Loan-product check · same deal, 3 products live
Conventional
25% down · 7.5% · 30yr
- Down + closing
- —
- Monthly P&I
- —
- Monthly cashflow
- —
- DSCR
- —
- Eligible?
- —
Personal DTI + credit; lowest rate.
DSCR
20% down · 8.5% · 30yr
- Down + closing
- —
- Monthly P&I
- —
- Monthly cashflow
- —
- DSCR
- —
- Eligible?
- —
No personal income docs; deal must DSCR.
Hard money
10% down · 12.0% · 12mo
- Down + closing
- —
- Monthly P&I
- —
- Monthly cashflow
- —
- DSCR
- —
- Eligible?
- —
Short-term bridge; refi at stabilization.
Rent comps 2 comps
| Address | Beds | Baths | Sqft | Rent | $/sqft | DOM | Units | Dist |
|---|---|---|---|---|---|---|---|---|
| 813 N Spair St Thomasville, GA | 2.0 | 1.0 | 865 | $1,500 | $1.73 | 43d | 1 | 0.49mi |
| 403 Remington Ave Thomasville, GA | 2.0 | 1.0 | 891 | $1,575 | $1.77 | 43d | 1 | 0.85mi |
Listing history 10 events
-
2026-06-02days on market $48,000 Active 66 DOM
-
2026-06-01days on market $48,000 Active 65 DOM
-
2026-05-31days on market $48,000 Active 64 DOM
-
2026-05-31days on market $48,000 Active 63 DOM
-
2026-05-18price $48,000 585-char remark
Show marketing remark (585 chars)
Exceptional investment opportunity on a generous 0.61-acre lot. This property offers a rare chance to reimagine and restore in one of the area’s most desirable locations. Ideal for investors, builders, and developers seeking a project with strong location fundamentals and long-term value potential. The lot has been rezoned to muti-family use. One structure with multiple units allowed. You may split the lot to increase the number of builds. Opportunities with this combination of lot size and location are increasingly rare. Sold as-is. Cash or renovation financing preferred.
-
2026-03-29$63,000 Active 585-char remark
Show marketing remark (585 chars)
Exceptional investment opportunity on a generous 0.61-acre lot. This property offers a rare chance to reimagine and restore in one of the area’s most desirable locations. Ideal for investors, builders, and developers seeking a project with strong location fundamentals and long-term value potential. The lot has been rezoned to muti-family use. One structure with multiple units allowed. You may split the lot to increase the number of builds. Opportunities with this combination of lot size and location are increasingly rare. Sold as-is. Cash or renovation financing preferred.
-
2021-06-30soldstatus $8,500 67-char remark
Show marketing remark (67 chars)
3 bedroom 1 bath home that would be good for an investment project.
-
2021-05-26$15,000 67-char remark
Show marketing remark (67 chars)
3 bedroom 1 bath home that would be good for an investment project.
-
2008-06-01soldstatus $117,000
-
2006-08-01soldstatus $101,000
ⓘ Source: listings_history table (triggers on properties + properties_extension) + one-shot
backfill from property_details.listing_events for pre-trigger history.
Climate risk First Street
- Flood 5/10 Major FEMA zone X (unshaded) · 24% chance over 30 yrs
- Wildfire 3/10 Moderate
- Heat 8/10 Severe 7 d/yr ≥108°F today · 19 d/yr by 30 yrs out
- Wind 9/10 Extreme 99% chance of damaging wind over 30 yrs
- Air quality 5/10 Major 8 unhealthy d/yr today · 8 by 30 yrs out
Nearby sold comps map
Loading sold comps map…
Walkable amenities ~0.75 mi
Loading nearby amenities…
Taxation est. · year 1
- Rental income
- $22,641
- − Mortgage interest
- −$2,689
- − Property taxes
- −$720
- − Insurance
- −$240
- − Repairs & maintenance
- −$1,811
- − Management
- −$1,811
- − Depreciation
- −$1,396
- Taxable income
- $13,973
- Est. tax owed @ 24.0%
- −$3,354
- After-tax cash flow
- $10,552/yr
For passive investors: Depreciation is non-cash, so a rental often shows a tax loss while cash-flowing — sheltering income. Rental losses are passive: they offset passive income freely, and up to $25,000/yr can offset ordinary (W-2) income if you actively participate and your MAGI is under $100k (phasing out to $0 by $150k); unused losses carry forward. On sale, claimed depreciation is recaptured at up to 25%, and gains may owe capital-gains tax (a 1031 exchange can defer both). Figures are a year-1 estimate at your 24.0% rate — not tax advice; consult a CPA.
Schools (NCES district)
- District
- Thomasville City
- NCES district ID
- 1304950
- Math proficiency
- 29% ▼ -6.00%
- Reading proficiency
- 37% ▼ -8.00%
- Median HH income
- $31,040
- Composite
- 26.85/100
- National rank
- #7106
- State rank
- #87 of 174 in GA
Livability — Thomasville
- Score
- 71/100
- State rank
- #77
- US rank
- #6678
Category grades
Schools grade is shown separately in the Schools card above.
Census & demographics
- Census place
- Thomasville, GA
- County
- Thomas County · 22,962 people
- City population
- 22,962
- Metro
- Thomasville, GA
- Population (ZIP)
- 22,962
- Household income
- $50,460
- Rent vs Own
- Severe rent burden
- 1059.0
Population outlook (Thomas County) Hauer SSP2
- Today (2025)
- 45,303 people
- By 2030
- 45,052 · -0.6%
- By 2040
- 44,034 · -2.8%
- By 2050
- 42,310 · -6.6%
- By 2075
- 37,569 · -17.1%
- By 2100
- 30,676 · -32.3%
Race, ethnicity, and origin ACS 2023
- Race & ethnicity
- Black 49% White 47% Two or more races 2% Hispanic / Latino 2%
- Common ancestry
- Slovak 2% Italian 1% Lithuanian 1%
- Foreign-born
- 2% · Canada
- Languages at home
- 96% English-only · Spanish 2%
Political lean MEDSL · Thomas
- 2024 margin
- Strong R (+24.1) · D 37.8% · R 61.9%
- 2008→2024 swing
- -8.3pp toward R · 2008: -15.8pp · 2024: -24.1pp
- All cycles
- 2024: R+24.1 2020: R+19.5 2016: R+21.8 2012: R+18.5 2008: R+15.8
Not yet ingested
- Civics
- —
Market trends
- HPI YoY
- ▼ -93.17%
- Current HPI
- 228.0107
- Rent YoY
- —
- Metro
- Thomasville, GA
- State GDP YoY
- ▲ 2.66%
- F500 in state
- 28
Industry mix (Fortune 500 HQ in GA)
| Industry | F500 HQs | Revenue |
|---|---|---|
| Paper / Packaging | 2 | $29B |
|
||
| Retail | 1 | $160B |
|
||
| Transportation / Logistics | 1 | $91B |
|
||
| Airlines | 1 | $62B |
|
||
| Consumer Goods | 1 | $47B |
|
||
| Utilities | 1 | $25B |
|
||
Price history
-52.5% since first listed6 events — show timeline
- 2026-05-18 Price Changed $48,000 CATRS
- 2026-03-29 Listed $63,000 CATRS
- 2021-06-30 Sold (MLS) $8,500 MBOR
- 2021-05-26 Listed $15,000 MBOR
- 2008-06-01 Sold (Public Records) $117,000 Public Records
- 2006-08-01 Sold (Public Records) $101,000 Public Records
Property tax history
-13.4%/yrLatest (2025): $39 · +68.4% YoY. Source: county tax records.
Cash-flow waterfall
monthlySold comps — $/sqft
last 12 mo · ≤1 miLoading sold comps…