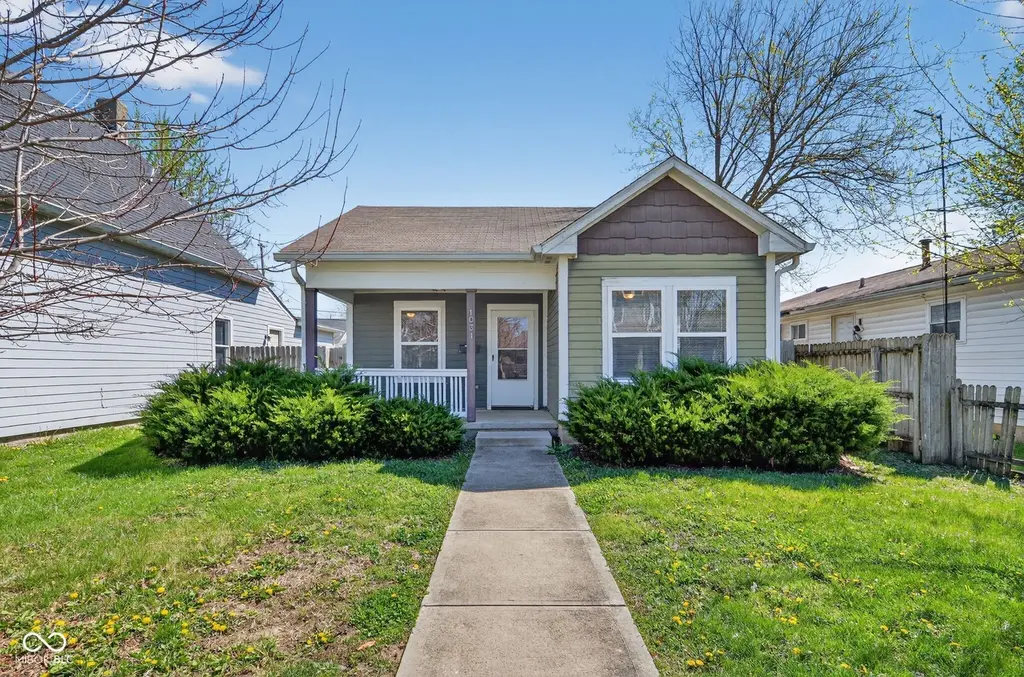
1031 Saint Paul St · Indianapolis city (balance), IN
Flood risk 1/10 · Minimal
- FEMA flood zone
- X (unshaded)
- Chance of flooding over 30 yrs
- 0.0%
- Est. flood insurance / yr
- $473 – $860
Fire risk 1/10 · Minimal
- Est. fire insurance / yr
- $717 – $1,331
Heat risk 4/10 · Minor
- Hot days now (above 101°F)
- 7 days/yr
- Hot days in 30 yrs
- 19 days/yr
Wind risk 2/10 · Minimal
- Chance of severe wind over 30 yrs
- 0.0%
Air-quality risk 4/10 · Minor
- Unhealthy air days now
- 5 days/yr
- Unhealthy air days in 30 yrs
- 7 days/yr
Risk factors via First Street. Map © Google.
Why this score? — see what drove the D grade
The composite is a weighted blend of 9 inputs, each scored 0–100. Each bar is that input's sub-score; the figure is the points it added to the 100-point composite (weight × sub-score).
- ARV discount +15.0/15.0
- Cash flow +10.2/30.0
- 1% rule +3.9/10.0
- Rent growth +3.2/5.0
- DSCR +2.9/10.0
- Livability +2.5/5.0
- Condition / age +2.5/5.0
- Schools +1.4/10.0
- Appreciation +0.0/10.0
$184,900
🖨 Deal sheet (PDF) 📄 Offer letter ✓ Due diligence
Listing remarks MLS
An inviting single family residence awaits at 1031 Saint Paul ST in INDIANAPOLIS, IN, USA, presenting a ready-to-move-in condition for its fortunate new inhabitants. Culinary aspirations find their home within the kitchen, distinguished by its elegant shaker cabinets that offer both beauty and ample utility for everyday living. Embracing a modern aesthetic, the open floor plan creates an expansive atmosphere, allowing for effortless daily routines and comfortable gatherings within the 1850 square feet of living area. With four serene bedrooms, restful nights and personal sanctuaries are readily available. Complementing these private spaces are one full bathroom and an additional half bathroom, thoughtfully appointed for convenience. Constructed in 2015, this single-story residence is situated within a pleasant residential area, offering a sense of community. The exterior delights with a welcoming porch, perfect for greeting the day, while a spacious deck provides an ideal setting for outdoor enjoyment. The fenced backyard ensures a private outdoor haven, further enhanced by the presence of a convenient shed for storage needs. The generous 5009 square feet lot area provides ample space for outdoor pursuits. This thoughtfully designed single family residence offers a truly comfortable and enriching living experience.
Key facts
- Open floor plan
- Convenient shed
- Spacious deck
Tags
Neighborhood map
What this means for you Summary
Snapshot
- This is a 3-bed/2.0-bath single-family listed at $185k.
Deal economics
- At list price, monthly cash flow is $-105 ($-1k/yr) — negative.
- To cash-flow at today's rent, offer at most $166k (10.0% below list).
- To meet the 1% rule (rent ≥ 1% of price), the offer needs to be $164k (11.3% below list).
- Recommended offer: $164k (11.3% below list) — sets the bar for 1% rule.
- Cap rate 5.6% vs local median 4.4% in Indianapolis city (balance) — meaningfully above typical; check what's discounted (condition, days-on-market, listing class) to confirm the premium yield is real.
Location & tenants
- Location reads: area grade D — affects rentability + tenant quality, not the cash-flow math above.
- Indianapolis Public Schools (urban): math 14% / reading 20% proficiency, ranked #286 of 301 in IN (top 95%) — low school quality limits family demand, transient renter base, plan for 1-2y turnover; 77% free/reduced lunch — lower-income household profile, screen leases tightly.
- Zoned schools: Frederick Douglass School 19 (math 9% / reading 13%, grade F, #909 of 994 statewide, top 92%, 444 students, 81% FRL); H L Harshman Middle School (math 3% / reading 16%, grade F, #316 of 330 statewide, top 96%, 549 students, 84% FRL); Arsenal Technical High School (math 6% / reading 27%, grade F, #353 of 369 statewide, top 96%, 2,366 students, 74% FRL) — zoned schools at 80% FRL track the district average.
- Market conditions: Rents rising (+2.9%/yr); 500 active listings in the ZIP; 40 comparable units currently listed for rent nearby; rentals at typical pace (median 26d on market — plan ~3-4 weeks tenant-placement turnaround); 1,906 units permitted in Marion County in 2024 (621 in 5+ unit buildings).
- This rent runs 34% of the median local income ($57k/yr) — at the standard rent-burdened threshold; future hikes will face affordability resistance.
Forward outlook
- Local home prices are declining (-3.0%/yr); year-one equity from $1k of loan paydown is wiped out by about $6k of value loss. Plan a longer hold.
- Marion County population projected at +18% by 2050 — long-run rental-demand tailwind backs the buy-and-hold thesis.
Negotiation context
- It's been on market 48 days — a 3% lower offer ($179k) is reasonable based on typical stale-listing flexibility.
- 5 sale attempts since 25y ago with the ask held roughly flat each time — persistent listings suggest the price (not the market) is what's stuck; bring a comps-based counter.
- Current owner paid $140k; 32% above their basis — modest negotiation headroom, anchor on the comps not their cost.
Questions for the listing agent
- What do current leases actually rent for vs. the listed asking? Can we see a recent rent roll and the last 12 months of T-12 income?
- It's been on market 48 days. Have you received any prior offers? Is the seller open to a 11% concession, seller financing, or rate buy-down credit?
- Is there a deadline driving the sale (1031 exchange, divorce, estate, relocation)? That informs how much negotiation room exists.
- The area grade is low — what's the realistic commute time and amenity access for the typical tenant pool here? Any planned neighborhood developments (good or bad) we should know about?
- What's the average days-on-market for RENTAL listings here right now (not sales)? A rising rental-DOM trend means longer vacancies and softer asking-rent achievability than the comps imply.
- What's the recent tenant-quality profile in this submarket — average credit score on applications, eviction rate, late-payment / NSF rate, and stable-employment percentage? A property-management company in the area should have these aggregated.
- How much new for-sale + rental construction is in the pipeline within 1–3 miles? Heavy new supply typically softens prices + rents 12–24 months out; constrained supply supports both.
Investment metrics
- 1% rule
- 0.89% ✗
- Cap rate
- 5.61%
- Cash-on-cash
- -2.42%
- DSCR
- 0.89
- GRM
- 9.4
CMA / ARV
- ARV (median comp)
- $229,021
- List price
- $184,900
- Delta
- -19.27%
- Verdict
- UNDERPRICED
- Comps
- 20 within 1.0 mi
Show comp detail 12 sales within ~0.75 mi
| Address | Dist | Beds/Ba | Sqft | Sold | Price | $/sf | Match |
|---|---|---|---|---|---|---|---|
| 1004 S Keystone Ave | 0.11mi | 2/2.5 (-1) | 1,218 (-6%) | 4mo | $265,000 | $218 | 76 |
| 714 S Keystone Ave | 0.31mi | 2/1.0 (-1) | 1,223 (-5%) | 2mo | $172,900 | $141 | 67 |
| 442 S Oxford St | 0.64mi | 3/2.5 | 1,272 (-1%) | 0mo | $170,000 | $134 | 65 |
| 2320 Spann Ave | 0.39mi | 2/2.0 (-1) | 1,219 (-6%) | 5mo | $183,000 | $150 | 64 |
| 319 S Temple Ave | 0.67mi | 3/2.5 | 1,313 (+2%) | 4mo | $177,500 | $135 | 60 |
| 2820 English Ave | 0.62mi | 2/2.0 (-1) | 1,260 (-2%) | 3mo | $140,000 | $111 | 60 |
| 1502 Spann Ave | 0.67mi | 4/1.5 (+1) | 1,288 (-0%) | 2mo | $235,000 | $182 | 59 |
| 1740 Spann Ave | 0.51mi | 3/2.0 | 1,178 (-9%) | 8mo | $280,000 | $238 | 55 |
| 2336 Hoyt Ave | 0.29mi | 2/1.0 (-1) | 1,106 (-14%) | 6mo | $85,000 | $77 | 49 |
| 1512 English Ave | 0.70mi | 3/2.0 | 1,416 (+10%) | 4mo | $145,000 | $102 | 47 |
| 1413 S Oxford St | 0.56mi | 3/1.0 | 1,140 (-12%) | 7mo | $150,000 | $132 | 45 |
| 158 Harlan St | 0.72mi | 3/1.0 | 1,172 (-9%) | 3mo | $57,000 | $49 | 44 |
Match score weights: distance 35% · size 25% · config 20% · recency 20%. Top-matched comps best support the ARV.
Projected returns pro-forma
-3.0% appreciation · 2.88% rent growth · sell at horizon
- IRR
- -20.4%
- Equity multiple
- 0.29×
- Total profit
- $-36,720
- Equity at exit
- $27,569
- IRR
- -13.7%
- Equity multiple
- 0.21×
- Total profit
- $-40,956
- Equity at exit
- $15,987
Cash invested: $51,772 (down + closing). Projections, not guarantees.
Landlord ↔ Tenant lean methodology
- Overall (STATE)
- 90 Strongly Landlord-Friendly
- State Indiana
- 90 Strongly Landlord-Friendly · R+11
- County
- — inherits STATE
- City
- — inherits STATE
ZIP-level market 46203
- Home prices YoY
- -26.7%
- Rents YoY
- 2.9%
- Active inventory
- 500
- Price-to-rent
- 9.4×
Monthly cashflow live
- Estimated rent
- $1,639 high interval (Pro) →
- Mortgage (P&I)
- −$970
- Tax from tax record
- −$353 /mo · $4,237/yr
- Insurance
- −$77
- HOA
- −$0
- Vacancy / Maint / Mgmt
- −$344
- Net cashflow
- $-105
Break-even live
Sensitivity live
| Price | -10% $0 | -5% $-52 | +0% $-105 | +5% $-157 | +10% $-209 |
|---|---|---|---|---|---|
| Rent | -10% $-234 | -5% $-169 | +0% $-105 | +5% $-40 | +10% $25 |
| Rate | -1.0pp $-11 | -0.5pp $-58 | base $-105 | +0.5pp $-152 | +1.0pp $-201 |
UW: 25.0% down · 7.5% · 30yr · 1.5% tax · 5.0% vac · 8.0% maint · 8.0% mgmt
Financing live
Cash to close
- Down payment
- $46,225
- Closing costs
- $5,547
- Reserves months
- —
- Total cash needed
- —
Loan-product check · same deal, 3 products live
Conventional
25% down · 7.5% · 30yr
- Down + closing
- —
- Monthly P&I
- —
- Monthly cashflow
- —
- DSCR
- —
- Eligible?
- —
Personal DTI + credit; lowest rate.
DSCR
20% down · 8.5% · 30yr
- Down + closing
- —
- Monthly P&I
- —
- Monthly cashflow
- —
- DSCR
- —
- Eligible?
- —
No personal income docs; deal must DSCR.
Hard money
10% down · 12.0% · 12mo
- Down + closing
- —
- Monthly P&I
- —
- Monthly cashflow
- —
- DSCR
- —
- Eligible?
- —
Short-term bridge; refi at stabilization.
Rent comps 40 comps
| Address | Beds | Baths | Sqft | Rent | $/sqft | DOM | Units | Dist |
|---|---|---|---|---|---|---|---|---|
| 1123 Churchman Ave Indianapolis, IN | 3.0 | 1.5 | 1472 | $1,360 | $0.92 | 16d | 1 | 0.10mi |
| 2230 Woodlawn Ave Indianapolis, IN | 2.0 | 1.0 | 924 | $1,350 | $1.46 | 45d | 1 | 0.11mi |
| 909 Saint Peter St Indianapolis, IN | 3.0 | 2.0 | 1200 | $1,800 | $1.50 | 45d | 1 | 0.13mi |
| 1142 S Keystone Ave Indianapolis, IN | 3.0 | 1.0 | 1056 | $1,650 | $1.56 | 0d | 1 | 0.14mi |
| 1013 Harlan St Indianapolis, IN | 2.0 | 1.0 | 1008 | $1,475 | $1.46 | 45d | 1 | 0.15mi |
| 1011 Harlan St Indianapolis, IN | 2.0 | 2.0 | 1008 | $1,525 | $1.51 | 45d | 1 | 0.16mi |
| 2116 Woodlawn Ave Indianapolis, IN | 2.0 | 2.0 | 1054 | $1,175 | $1.11 | 9d | 1 | 0.17mi |
| 2218 Pleasant St Indianapolis, IN | 3.0 | 2.0 | 1376 | $2,499 | $1.82 | 25d | 1 | 0.17mi |
| 1053 Villa Ave Indianapolis, IN | 3.0 | 1.5 | 1281 | $1,400 | $1.09 | 45d | 1 | 0.21mi |
| 1020 S Randolph St Indianapolis, IN | 3.0 | 1.5 | 1550 | $1,650 | $1.06 | 25d | 1 | 0.30mi |
| 2320 Spann Ave Indianapolis, IN | 2.0 | 2.0 | 1219 | $1,675 | $1.37 | 0d | 1 | 0.42mi |
| 2320 Spann Ave Indianapolis, IN | 2.0 | 2.0 | 1219 | $1,795 | $1.47 | 18d | 1 | 0.42mi |
| 453 S Keystone Ave Indianapolis, IN | 2.0 | 1.5 | 950 | $1,150 | $1.21 | 0d | 1 | 0.51mi |
| 1527 Prospect St Indianapolis, IN | 3.0 | 1.5 | 1150 | $1,200 | $1.04 | 25d | 1 | 0.52mi |
| 1534 Dawson St Indianapolis, IN | 3.0 | 1.0 | 1040 | $1,499 | $1.44 | 25d | 1 | 0.53mi |
| 420 Hamilton Ave Unit A Indianapolis, IN | 3.0 | 2.0 | 1350 | $1,550 | $1.15 | 45d | 1 | 0.53mi |
| 420 Hamilton Ave Unit B Indianapolis, IN | 3.0 | 2.0 | 1350 | $1,450 | $1.07 | 12d | 1 | 0.53mi |
| 420 Harlan St Indianapolis, IN | 2.0 | 2.0 | 1260 | $1,500 | $1.19 | 25d | 1 | 0.54mi |
| 1502 Woodlawn Ave Indianapolis, IN | 2.0 | 2.0 | 1441 | $2,500 | $1.73 | 16d | 1 | 0.56mi |
| 1505 S Rural St Indianapolis, IN | 3.0 | 1.0 | 1104 | $1,500 | $1.36 | 14d | 1 | 0.56mi |
| 2631 Southeastern Ave Indianapolis, IN | 3.0 | 2.0 | 1072 | $1,195 | $1.11 | 13d | 1 | 0.57mi |
| 518 S State Ave Indianapolis, IN | 2.0 | 1.0 | 900 | $725 | $0.81 | 45d | 1 | 0.60mi |
| 512 S State Ave Unit 512 State 120% AMI Indianapolis, IN | 3.0 | 1.0 | 1200 | $1,400 | $1.17 | 25d | 1 | 0.61mi |
| 1441 Prospect St Indianapolis, IN | 2.0 | 1.0–2.0 | 2840 | $1,949 | $0.69 | 0d | 14 | 0.61mi |
| 1543 S State Ave Indianapolis, IN | 2.0 | 1.0 | 1086 | $1,100 | $1.01 | 9d | 1 | 0.61mi |
| 225 Hamilton Ave Indianapolis, IN | 2.0 | 2.0 | 1008 | $1,695 | $1.68 | 45d | 1 | 0.66mi |
| 1605 English Ave Indianapolis, IN | 3.0 | 2.0 | 1567 | $3,000 | $1.91 | 0d | 1 | 0.66mi |
| 1602 Quill St Unit B Indianapolis, IN | 3.0 | 2.0 | 1250 | $1,750 | $1.40 | 45d | 1 | 0.67mi |
| 1602 Quill St Unit B Indianapolis, IN | 3.0 | 2.0 | 1250 | $1,650 | $1.32 | 16d | 1 | 0.67mi |
| 1602 Quill St Unit B Indianapolis, IN | 3.0 | 2.0 | 1250 | $1,525 | $1.22 | 0d | 1 | 0.67mi |
| 1449 Fletcher Ave Indianapolis, IN | 2.0 | 2.0 | 1000 | $2,000 | $2.00 | 19d | 1 | 0.68mi |
| 2015 Southeastern Ave Unit 2015 Indianapolis, IN | 2.0 | 2.5 | 1350 | $2,200 | $1.63 | 25d | 1 | 0.70mi |
| 330 S Rural St Indianapolis, IN | 2.0 | 1.0 | 960 | $1,050 | $1.09 | 9d | 1 | 0.71mi |
| 1815 Dawson St Unit 1815 Indianapolis, IN | 2.0 | 1.0 | 1019 | $999 | $0.98 | 16d | 1 | 0.73mi |
| 1512 English Ave Indianapolis, IN | 3.0 | 2.0 | 1416 | $1,650 | $1.17 | 6d | 1 | 0.73mi |
| 323 S Rural St Indianapolis, IN | 3.0 | 1.5 | 1090 | $1,050 | $0.96 | 45d | 1 | 0.75mi |
| 151 Harlan St Unit A Indianapolis, IN | 3.0 | 2.0 | 1250 | $1,549 | $1.24 | 25d | 1 | 0.75mi |
| 1224 Prospect St Indianapolis, IN | 2.0 | 1.0–2.0 | 691 | $2,223 | $3.21 | 0d | 8 | 0.76mi |
| 3441 Prospect St Indianapolis, IN | 2.0 | 1.0 | 1008 | $1,500 | $1.49 | 25d | 1 | 0.77mi |
| 3441 Prospect St Indianapolis, IN | 2.0 | 1.0 | 1008 | $1,700 | $1.69 | 46d | 1 | 0.77mi |
Listing history 16 events
-
2026-06-07statusdays on market $184,900 Pending 48 DOM
-
2026-06-03days on market $184,900 Active 47 DOM
-
2026-06-02days on market $184,900 Active 46 DOM
-
2026-06-01days on market $184,900 Active 45 DOM
-
2026-05-31days on market $184,900 Active 44 DOM
-
2026-05-15price $184,900 1339-char remark
Show marketing remark (1339 chars)
An inviting single family residence awaits at 1031 Saint Paul ST in INDIANAPOLIS, IN, USA, presenting a ready-to-move-in condition for its fortunate new inhabitants. Culinary aspirations find their home within the kitchen, distinguished by its elegant shaker cabinets that offer both beauty and ample utility for everyday living. Embracing a modern aesthetic, the open floor plan creates an expansive atmosphere, allowing for effortless daily routines and comfortable gatherings within the 1850 square feet of living area. With four serene bedrooms, restful nights and personal sanctuaries are readily available. Complementing these private spaces are one full bathroom and an additional half bathroom, thoughtfully appointed for convenience. Constructed in 2015, this single-story residence is situated within a pleasant residential area, offering a sense of community. The exterior delights with a welcoming porch, perfect for greeting the day, while a spacious deck provides an ideal setting for outdoor enjoyment. The fenced backyard ensures a private outdoor haven, further enhanced by the presence of a convenient shed for storage needs. The generous 5009 square feet lot area provides ample space for outdoor pursuits. This thoughtfully designed single family residence offers a truly comfortable and enriching living experience.
-
2026-04-17$189,900 Active 1339-char remark
Show marketing remark (1339 chars)
An inviting single family residence awaits at 1031 Saint Paul ST in INDIANAPOLIS, IN, USA, presenting a ready-to-move-in condition for its fortunate new inhabitants. Culinary aspirations find their home within the kitchen, distinguished by its elegant shaker cabinets that offer both beauty and ample utility for everyday living. Embracing a modern aesthetic, the open floor plan creates an expansive atmosphere, allowing for effortless daily routines and comfortable gatherings within the 1850 square feet of living area. With four serene bedrooms, restful nights and personal sanctuaries are readily available. Complementing these private spaces are one full bathroom and an additional half bathroom, thoughtfully appointed for convenience. Constructed in 2015, this single-story residence is situated within a pleasant residential area, offering a sense of community. The exterior delights with a welcoming porch, perfect for greeting the day, while a spacious deck provides an ideal setting for outdoor enjoyment. The fenced backyard ensures a private outdoor haven, further enhanced by the presence of a convenient shed for storage needs. The generous 5009 square feet lot area provides ample space for outdoor pursuits. This thoughtfully designed single family residence offers a truly comfortable and enriching living experience.
-
2021-09-07soldstatus $140,000 Closed 566-char remark
Show marketing remark (566 chars)
You can't miss this 4 BED-2 BATH Ranch Home that has so much potential. Open concept home that offers separate sleeping quarters away from the main living area of the home. Owners quarters features a private bathroom. Property offers a privacy type fenced in back yard w/ a sliding gate for easy access to park your vehicle in the rear of the home. Take advantage of the mini barn for plenty of extra storage. Located near Fountain Square. Enjoy the endless dining and shopping opportunities near by. Stop in for a tour today! WELCOME HOME to 1031 Saint Paul Street.
-
2021-08-16status Pending 566-char remark
Show marketing remark (566 chars)
You can't miss this 4 BED-2 BATH Ranch Home that has so much potential. Open concept home that offers separate sleeping quarters away from the main living area of the home. Owners quarters features a private bathroom. Property offers a privacy type fenced in back yard w/ a sliding gate for easy access to park your vehicle in the rear of the home. Take advantage of the mini barn for plenty of extra storage. Located near Fountain Square. Enjoy the endless dining and shopping opportunities near by. Stop in for a tour today! WELCOME HOME to 1031 Saint Paul Street.
-
2021-07-26$150,000 Active 566-char remark
Show marketing remark (566 chars)
You can't miss this 4 BED-2 BATH Ranch Home that has so much potential. Open concept home that offers separate sleeping quarters away from the main living area of the home. Owners quarters features a private bathroom. Property offers a privacy type fenced in back yard w/ a sliding gate for easy access to park your vehicle in the rear of the home. Take advantage of the mini barn for plenty of extra storage. Located near Fountain Square. Enjoy the endless dining and shopping opportunities near by. Stop in for a tour today! WELCOME HOME to 1031 Saint Paul Street.
-
2015-11-13soldstatus $57,000
-
2015-11-12$57,000
-
2006-05-30soldstatus $10,000
-
2006-02-10$13,900
-
2002-02-03historical
-
2001-03-08$39,999
ⓘ Source: listings_history table (triggers on properties + properties_extension) + one-shot
backfill from property_details.listing_events for pre-trigger history.
Tax reassessment forecast IN · Partial reset (capped growth)
- Current annual tax
- $4,237 · $353/mo
- Projected year-2 tax
- $4,237 · $353/mo
- Expected delta
- $0/yr ($0/mo · 0.0%)
ⓘ Screening estimate from a state-policy table — verify with the county assessor before closing.
Climate risk First Street
- Flood 1/10 Low FEMA zone X (unshaded) · 0% chance over 30 yrs
- Wildfire 1/10 Low
- Heat 4/10 Moderate 7 d/yr ≥101°F today · 19 d/yr by 30 yrs out
- Wind 2/10 Low 0% chance of damaging wind over 30 yrs
- Air quality 4/10 Moderate 5 unhealthy d/yr today · 7 by 30 yrs out
Nearby sold comps map
Loading sold comps map…
Walkable amenities ~0.75 mi
Loading nearby amenities…
Taxation est. · year 1
- Rental income
- $19,674
- − Mortgage interest
- −$10,357
- − Property taxes
- −$4,237
- − Insurance
- −$924
- − Repairs & maintenance
- −$1,574
- − Management
- −$1,574
- − Depreciation
- −$5,379
- Taxable loss
- −$4,372
- Est. tax savings @ 24.0%
- +$1,049
- After-tax cash flow
- $-206/yr
For passive investors: Depreciation is non-cash, so a rental often shows a tax loss while cash-flowing — sheltering income. Rental losses are passive: they offset passive income freely, and up to $25,000/yr can offset ordinary (W-2) income if you actively participate and your MAGI is under $100k (phasing out to $0 by $150k); unused losses carry forward. On sale, claimed depreciation is recaptured at up to 25%, and gains may owe capital-gains tax (a 1031 exchange can defer both). Figures are a year-1 estimate at your 24.0% rate — not tax advice; consult a CPA.
Schools (NCES district)
- District
- Indianapolis Public Schools
- NCES district ID
- 1804770
- Math proficiency
- 14% ▼ -7.00%
- Reading proficiency
- 20% ▼ -3.00%
- Median HH income
- $32,034
- Composite
- 13.69/100
- National rank
- #9499
- State rank
- #286 of 301 in IN
Livability — Indianapolis city (balance)
No livability data for this city. (Only ~50 U.S. cities are tracked.)
Census & demographics
- Census place
- Indianapolis city (balance), IN
- County
- Marion County · 998,460 people
- City population
- 881,119
- Metro
- Indianapolis-Carmel-Anderson, IN
- Population (ZIP)
- 37,758
- Household income
- $57,393
- Rent vs Own
- Severe rent burden
- 1499.0
Population outlook (Marion County) Hauer SSP2
- Today (2025)
- 1,025,572 people
- By 2030
- 1,065,727 · +3.9%
- By 2040
- 1,141,577 · +11.3%
- By 2050
- 1,208,920 · +17.9%
- By 2075
- 1,367,288 · +33.3%
- By 2100
- 1,438,201 · +40.2%
Race, ethnicity, and origin ACS 2023
- Neighborhood character
- Predominantly White (69%)
- Race & ethnicity
- White 69% Hispanic / Latino 14% Black 12% Two or more races 8% Asian 2% Native American 1%
- Hispanic origin (detail)
- Mexican 12% Puerto Rican 1%
- Common ancestry
- Slovak 2% Lithuanian 2% Italian 1%
- Foreign-born
- 8% · Canada
- Languages at home
- 88% English-only · Spanish 10% Other Indo-European 1%
Political lean MEDSL · Marion
- 2024 margin
- Strong D (+27.7) · D 63.0% · R 35.3% · Other 1.7%
- 2008→2024 swing
- -0.7pp no change · 2008: 28.4pp · 2024: 27.7pp
- All cycles
- 2024: D+27.7 2020: D+29.1 2016: D+22.8 2012: D+22.2 2008: D+28.4
Not yet ingested
- Civics
- —
Market trends
- HPI YoY
- ▼ -127.37%
- Current HPI
- 349.579
- Rent YoY
- ▲ 2.88%
- Metro
- Indianapolis-Carmel-Anderson, IN
- State GDP YoY
- ▲ 2.90%
- F500 in state
- 18
Industry mix (Fortune 500 HQ in IN)
| Industry | F500 HQs | Revenue |
|---|---|---|
| Industrial Machinery | 2 | $37B |
|
||
| Healthcare | 1 | $177B |
|
||
| Pharmaceuticals | 1 | $45B |
|
||
| Metals / Steel | 1 | $18B |
|
||
| Agriculture | 1 | $17B |
|
||
| Packaging | 1 | $12B |
|
||
Price history
+362.3% since first listed11 events — show timeline
- 2026-05-15 Price Changed $184,900 MIBOR as Distributed by MLS Grid
- 2026-04-17 Listed $189,900 MIBOR as Distributed by MLS Grid
- 2021-09-07 Sold (MLS) $140,000 MIBOR as Distributed by MLS Grid
- 2021-08-16 Pending — MIBOR as Distributed by MLS Grid
- 2021-07-26 Listed $150,000 MIBOR as Distributed by MLS Grid
- 2015-11-13 Sold (MLS) $57,000 MIBOR as Distributed by MLS Grid
- 2015-11-12 Listed $57,000 MIBOR as Distributed by MLS Grid
- 2006-05-30 Sold (MLS) $10,000 MIBOR as Distributed by MLS Grid
- 2006-02-10 Listed $13,900 MIBOR as Distributed by MLS Grid
- 2002-02-03 Listing Removed — MIBOR as Distributed by MLS Grid
- 2001-03-08 Listed $39,999 MIBOR as Distributed by MLS Grid
Property tax history
+26.8%/yrLatest (2025): $4,237 · -1.7% YoY. Source: county tax records.
Cash-flow waterfall
monthlySold comps — $/sqft
last 12 mo · ≤1 miLoading sold comps…