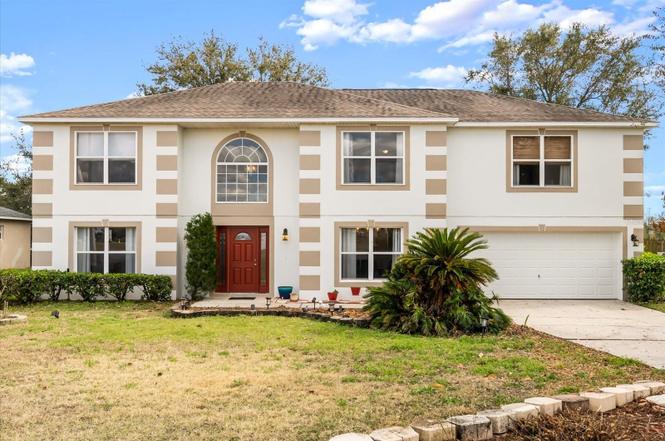
1678 Ridgemoor Dr · Mascotte, FL
Flood risk 1/10 · Minimal
- FEMA flood zone
- X (unshaded)
- Chance of flooding over 30 yrs
- 0.0%
- Est. flood insurance / yr
- $507 – $1,088
Fire risk 6/10 · Moderate
- Est. fire insurance / yr
- $947 – $1,759
Heat risk 8/10 · Major
- Hot days now (above 108°F)
- 4 days/yr
- Hot days in 30 yrs
- 13 days/yr
Wind risk 9/10 · Severe
- Chance of severe wind over 30 yrs
- 99.0%
Air-quality risk 1/10 · Minimal
- Unhealthy air days now
- 0 days/yr
- Unhealthy air days in 30 yrs
- 0 days/yr
Risk factors via First Street. Map © Google.
Why this score? — see what drove the C grade
The composite is a weighted blend of 9 inputs, each scored 0–100. Each bar is that input's sub-score; the figure is the points it added to the 100-point composite (weight × sub-score).
- ARV discount +15.0/15.0
- Cash flow +12.5/30.0
- Appreciation +10.0/10.0
- Schools +4.2/10.0
- DSCR +3.7/10.0
- Livability +3.6/5.0
- 1% rule +2.7/10.0
- Rent growth +2.5/5.0
- Condition / age +2.5/5.0
$389,900
🖨 Deal sheet 📄 Offer letter ✓ Due diligence
Listing remarks
Welcome to this spacious and beautifully maintained 5-bedroom home in the heart of Mascotte! From the moment you arrive, you’ll appreciate the fresh exterior paint completed in 2024 (backed by a 7-year warranty) and the peace of mind that comes with a roof replaced in 2017. Step inside to a grand foyer with soaring ceilings, creating an inviting and open first impression. The bright, open floor plan offers a seamless flow between the formal living and dining areas—perfect for hosting gatherings. Toward the rear of the home, a generously sized family room opens effortlessly to the kitchen, making it ideal for both everyday living and entertaining. The kitchen serves as the hear
Key facts
- Open floor plan
- Roof repaired
- Grand foyer
Tags
Property features AI
Finance
- Other: Living area and building area reported from public records; Lot dimensions approximately 80 x 175 (about 0.33 acres)
- Financial info: Total annual fees reported; No lease restrictions noted
- HOA & community: Has HOA (Dukes Lake HOA) with monthly equivalent fees; quarterly association fee; Association amenities: park, playground; Pets allowed; Deed restrictions; Irrigation equipment present
Exterior
- Parking: Driveway; Attached garage with 2 garage spaces
- Utilities: Public water; Septic tank sewer; Broadband/high-speed internet available; Cable available and connected; Electricity connected
- Home design: Single-family residence; Residential property; Completed condition; Two levels; Northwest facing; Slab foundation
- Construction: Block, stucco, and frame construction; Shingle roof
- Exterior features: Deck; Patio; Fire pit; French doors; Sliding doors; Sidewalk; Mature landscaping with oak trees; Trees/landscaped; Lakefront location with lake view; City limits lot, level and paved
Interior
- Kitchen: Dishwasher; Disposal; Microwave; Refrigerator; Electric water heater
- Bedrooms: 5 bedrooms
- Flooring: Ceramic tile; Laminate; Wood
- Bathrooms: 2 full baths; 1 half bath
- Heating & cooling: Central heating (electric); Central air conditioning
- Interior features: Ceiling fans; Eat-in kitchen; High ceilings; Kitchen/family room combo; Open floorplan; Solid surface counters; Stone counters; Thermostat; Vaulted ceilings; Walk-in closets
- Laundry & utility: Inside laundry room on upper level; Inside utility
Neighborhood map
What this means for you Summary
Snapshot
- This is a 5-bed/2.5-bath single-family listed at $390k.
Deal economics
- At list price, monthly cash flow is $-55 ($-657/yr) — negative.
- To cash-flow at today's rent, offer at most $380k (2.5% below list).
- To meet the 1% rule (rent ≥ 1% of price), the offer needs to be $302k (22.5% below list).
- Recommended offer: $302k (22.5% below list) — sets the bar for 1% rule.
- Cap rate 6.1% vs local median 4.8% in Mascotte — meaningfully above typical; check what's discounted (condition, days-on-market, listing class) to confirm the premium yield is real.
Location & tenants
- Location reads 71/100 on livability (#405 in FL) — a middle-class / working-renter tenant base. Strengths: cost of living A+, housing A+, health & safety A+; Watch: schools D-, amenities F, commute F.
- Lake (suburban): math 49% / reading 50% proficiency, ranked #37 of 73 in FL (top 51%) — families likely to look elsewhere, expect single-tenant / working-renter base with shorter leases.
- Market conditions: 98 active listings in the ZIP; 4 comparable units currently listed for rent nearby; rentals at typical pace (median 24d on market — plan ~3-4 weeks tenant-placement turnaround); solid renter incomes; 4,799 units permitted in Lake County in 2024 (814 in 5+ unit buildings).
- This rent runs 43% of the median local income ($84k/yr) — at the standard rent-burdened threshold; future hikes will face affordability resistance.
Forward outlook
- In year one you build about $42k of equity ($3k loan paydown + $39k appreciation (10.0% local appreciation)).
- Lake County population projected at +37% by 2050 — long-run rental-demand tailwind backs the buy-and-hold thesis.
- At projected returns (10.0% appreciation + 3.0% rent growth), your $109k cash investment doubles in ~3 years — after that, you're playing with house money.
- By year 2, paydown + projected appreciation supports a ~$67k cash-out refi (75% LTV) — recoverable capital for the next deal without selling this one.
Negotiation context
- It's been on market 101 days — a 9% lower offer ($355k) is reasonable based on typical stale-listing flexibility.
- 2 sale attempts since 9y ago with the ask held roughly flat each time — persistent listings suggest the price (not the market) is what's stuck; bring a comps-based counter.
- Current owner paid $317k; 23% above their basis — modest negotiation headroom, anchor on the comps not their cost.
Risks & watch-outs
- Climate carrying-cost: severe wind risk, 99% chance of damaging wind over 30y; major wildfire risk; extreme-heat days projected 4→13/yr by 2055 (HVAC capex compounding) — expect insurance premiums to compound above CPI over the hold.
Questions for the listing agent
- What do current leases actually rent for vs. the listed asking? Can we see a recent rent roll and the last 12 months of T-12 income?
- It's been on market 101 days. Have you received any prior offers? Is the seller open to a 23% concession, seller financing, or rate buy-down credit?
- What does the HOA fee cover, when was the last increase, and are there any pending special assessments or reserve-fund shortfalls?
- Why hasn't it sold? Are there any deal-killer items the seller is aware of (foundation, flood, title, zoning, code violations)?
- Is there a deadline driving the sale (1031 exchange, divorce, estate, relocation)? That informs how much negotiation room exists.
- Schools are D-rated, which usually means shorter tenancies and higher turnover. Who's the typical renter profile here, and what's been the actual vacancy rate?
- What's the average days-on-market for RENTAL listings here right now (not sales)? A rising rental-DOM trend means longer vacancies and softer asking-rent achievability than the comps imply.
- What's the recent tenant-quality profile in this submarket — average credit score on applications, eviction rate, late-payment / NSF rate, and stable-employment percentage? A property-management company in the area should have these aggregated.
- How much new for-sale + rental construction is in the pipeline within 1–3 miles? Heavy new supply typically softens prices + rents 12–24 months out; constrained supply supports both.
Investment metrics
- 1% rule
- 0.77% ✗
- Cap rate
- 6.12%
- Cash-on-cash
- -0.60%
- DSCR
- 0.97
- GRM
- 10.8
CMA / ARV
- ARV (on-the-fly)
- $506,880
- Comps found
- 3
Show comp detail 3 sales within ~0.75 mi
| Address | Dist | Beds/Ba | Sqft | Sold | Price | $/sf | Match |
|---|---|---|---|---|---|---|---|
| 2122 Medina Hills Ln | 0.14mi | 5/2.5 | 3,072 (0%) | 18mo | $380,000 | $124 | 78 |
| 6152 Chorus Dr | 0.38mi | 4/2.5 (-1) | 3,269 (+6%) | 8mo | $548,290 | $168 | 60 |
| 6616 Tempo Way | 0.61mi | 6/3.5 (+1) | 3,054 (-1%) | 24mo | $504,580 | $165 | 42 |
Match score weights: distance 35% · size 25% · config 20% · recency 20%. Top-matched comps best support the ARV.
Projected returns pro-forma
10.0% appreciation · 3.0% rent growth · sell at horizon
- IRR
- 23.8%
- Equity multiple
- 2.91×
- Total profit
- $208,752
- Equity at exit
- $351,253
- IRR
- 21.2%
- Equity multiple
- 6.65×
- Total profit
- $617,264
- Equity at exit
- $757,490
Cash invested: $109,172 (down + closing). Projections, not guarantees.
Landlord ↔ Tenant lean methodology
- Overall (STATE)
- 87 Strongly Landlord-Friendly
- State Florida
- 87 Strongly Landlord-Friendly · R+3
- County
- — inherits STATE
- City
- — inherits STATE
ZIP-level market 34753
- Home prices YoY
- 7.2%
- Active inventory
- 98
- Price-to-rent
- 10.8×
Monthly cashflow live
- Estimated rent
- $3,021 medium interval (Pro) →
- Mortgage (P&I)
- −$2,045
- Tax from tax record
- −$205 /mo · $2,460/yr
- Insurance
- −$162
- HOA
- −$29
- Vacancy / Maint / Mgmt
- −$634
- Net cashflow
- $-55
Break-even live
UW: 25.0% down · 7.5% · 30yr · 1.5% tax · 5.0% vac · 8.0% maint · 8.0% mgmt
Financing live
Cash to close
- Down payment
- $97,475
- Closing costs
- $11,697
- Reserves months
- —
- Total cash needed
- —
Loan-product check · same deal, 3 products live
Conventional
25% down · 7.5% · 30yr
- Down + closing
- —
- Monthly P&I
- —
- Monthly cashflow
- —
- DSCR
- —
- Eligible?
- —
Personal DTI + credit; lowest rate.
DSCR
20% down · 8.5% · 30yr
- Down + closing
- —
- Monthly P&I
- —
- Monthly cashflow
- —
- DSCR
- —
- Eligible?
- —
No personal income docs; deal must DSCR.
Hard money
10% down · 12.0% · 12mo
- Down + closing
- —
- Monthly P&I
- —
- Monthly cashflow
- —
- DSCR
- —
- Eligible?
- —
Short-term bridge; refi at stabilization.
Rent comps 4 comps
| Address | Beds | Baths | Sqft | Rent | $/sqft | DOM | Units | Dist |
|---|---|---|---|---|---|---|---|---|
| 1063 Bluegrass Dr Groveland, FL | 4.0 | 2.0 | 2182 | $2,500 | $1.15 | 23d | 1 | 0.57mi |
| 187 Hydra Way Groveland, FL | 4.0 | 3.0 | 2542 | $2,699 | $1.06 | 23d | 1 | 1.09mi |
| 5990 Churchill Square Way Groveland, FL | 5.0 | 3.0 | 2696 | $2,889 | $1.07 | 2d | 1 | 1.32mi |
| 7436 Capstone Dr Groveland, FL | 4.0 | 2.5 | 2731 | $2,800 | $1.03 | 23d | 1 | 1.42mi |
HOA detail
- Monthly dues
- $29 · $348/yr
Listing history 7 events
-
2026-06-02statusdays on market $389,900 Pending 101 DOM
-
2026-05-31days on market $389,900 Active 100 DOM
-
2026-04-17price $389,900
-
2026-02-20$395,000 Active
-
2017-11-07historical
-
2017-08-29$235,000 Active
-
2004-10-29soldstatus $316,800
ⓘ Source: listings_history table (triggers on properties + properties_extension) + one-shot
backfill from property_details.listing_events for pre-trigger history.
Tax reassessment forecast FL · Resets to sale price
- Current annual tax
- $2,460 · $205/mo
- Projected year-2 tax
- $3,236 · $270/mo
- Expected delta
- +$777/yr (+$65/mo · 31.6%)
ⓘ Screening estimate from a state-policy table — verify with the county assessor before closing.
Climate risk First Street
- Flood 1/10 Low FEMA zone X (unshaded) · 0% chance over 30 yrs
- Wildfire 6/10 Major
- Heat 8/10 Severe 4 d/yr ≥108°F today · 13 d/yr by 30 yrs out
- Wind 9/10 Extreme 99% chance of damaging wind over 30 yrs
- Air quality 1/10 Low 0 unhealthy d/yr today · 0 by 30 yrs out
Nearby sold comps map
Loading sold comps map…
Walkable amenities ~0.75 mi
Loading nearby amenities…
Taxation est. · year 1
- Rental income
- $36,248
- − Mortgage interest
- −$21,840
- − Property taxes
- −$2,460
- − Insurance
- −$1,950
- − Repairs & maintenance
- −$2,900
- − Management
- −$2,900
- − HOA
- −$348
- − Depreciation
- −$11,343
- Taxable loss
- −$7,492
- Est. tax savings @ 24.0%
- +$1,798
- After-tax cash flow
- $1,141/yr
For passive investors: Depreciation is non-cash, so a rental often shows a tax loss while cash-flowing — sheltering income. Rental losses are passive: they offset passive income freely, and up to $25,000/yr can offset ordinary (W-2) income if you actively participate and your MAGI is under $100k (phasing out to $0 by $150k); unused losses carry forward. On sale, claimed depreciation is recaptured at up to 25%, and gains may owe capital-gains tax (a 1031 exchange can defer both). Figures are a year-1 estimate at your 24.0% rate — not tax advice; consult a CPA.
Schools (NCES district)
- District
- Lake
- NCES district ID
- 1201050
- Math proficiency
- 49% ▼ -7.00%
- Reading proficiency
- 50% ▼ -4.00%
- Median HH income
- $46,632
- Composite
- 42.05/100
- National rank
- #3327
- State rank
- #37 of 73 in FL
Livability — Mascotte
- Score
- 71/100
- State rank
- #405
- US rank
- #7156
Category grades
Schools grade is shown separately in the Schools card above.
Census & demographics
- Census place
- Mascotte, FL
- County
- Lake County · 364,602 people
- City population
- 33,565
- Metro
- Orlando-Kissimmee-Sanford, FL
- Population (ZIP)
- 7,985
- Household income
- $83,868
- Rent vs Own
- Severe rent burden
- 16.0
Population outlook (Lake County) Hauer SSP2
- Today (2025)
- 386,640 people
- By 2030
- 417,107 · +7.9%
- By 2040
- 476,676 · +23.3%
- By 2050
- 531,296 · +37.4%
- By 2075
- 648,303 · +67.7%
- By 2100
- 698,530 · +80.7%
Race, ethnicity, and origin ACS 2023
- Neighborhood character
- Diverse neighborhood (Simpson 0.69)
- Race & ethnicity
- White 38% Hispanic / Latino 35% Two or more races 25% Black 20% Asian 3%
- Hispanic origin (detail)
- Mexican 11% Puerto Rican 12% Dominican 2%
- Common ancestry
- Slovak 1% Serbian 1% Romanian 1%
- Foreign-born
- 10% · Canada, Jamaica
- Languages at home
- 67% English-only · Spanish 32%
Political lean MEDSL · Lake
- 2024 margin
- Strong R (+24.7) · D 37.3% · R 62.0%
- 2008→2024 swing
- -11.2pp toward R · 2008: -13.5pp · 2024: -24.7pp
- All cycles
- 2024: R+24.7 2020: R+20.0 2016: R+23.1 2012: R+17.1 2008: R+13.5
Not yet ingested
- Civics
- —
Market trends
- HPI YoY
- ▲ 19.01%
- Current HPI
- 281.96
- Rent YoY
- —
- Metro
- Orlando-Kissimmee-Sanford, FL
- State GDP YoY
- ▲ 3.28%
- F500 in state
- 36
Industry mix (Fortune 500 HQ in FL)
| Industry | F500 HQs | Revenue |
|---|---|---|
| Industrial Technology | 2 | $29B |
|
||
| Insurance | 2 | $17B |
|
||
| Retail | 1 | $60B |
|
||
| Technology Distribution | 1 | $58B |
|
||
| Homebuilding | 1 | $35B |
|
||
| Technology Manufacturing | 1 | $35B |
|
||
Price history
+23.1% since first listed5 events — show timeline
- 2026-04-17 Price Changed $389,900 Stellar MLS as Distributed by MLS Grid
- 2026-02-20 Listed $395,000 Stellar MLS as Distributed by MLS Grid
- 2017-11-07 Listing Removed — Stellar MLS as Distributed by MLS Grid
- 2017-08-29 Listed $235,000 Stellar MLS as Distributed by MLS Grid
- 2004-10-29 Sold (Public Records) $316,800 Public Records
Property tax history
+4.3%/yrLatest (2025): $2,460 · +6.2% YoY. Source: county tax records.
Cash-flow waterfall
monthlySold comps — $/sqft
last 12 mo · ≤1 miLoading sold comps…