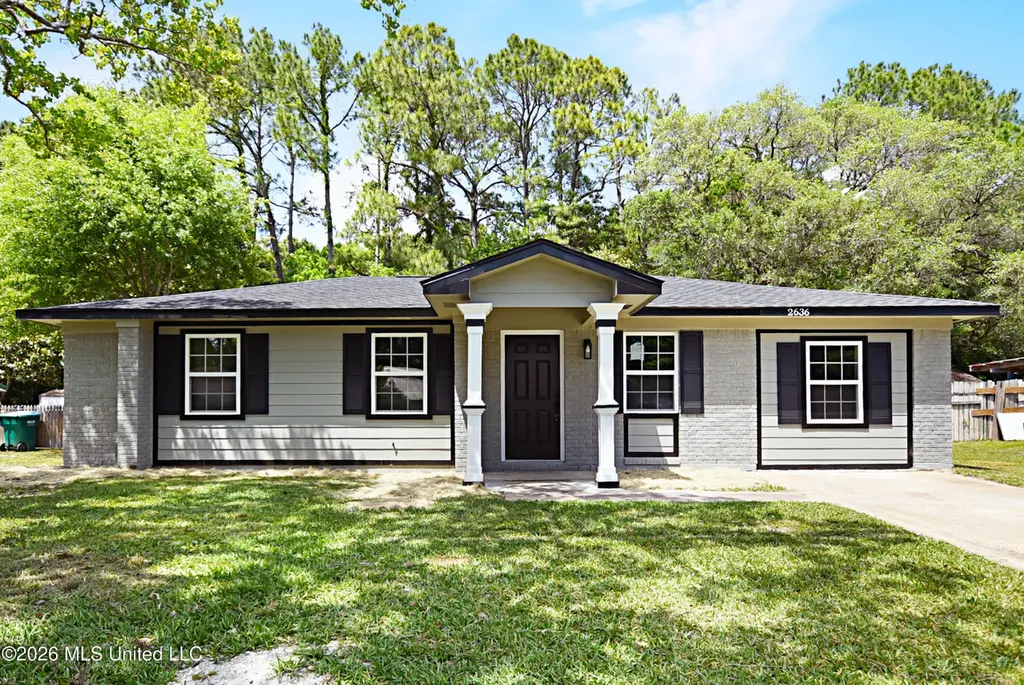
2636 Southern Dr · Gautier, MS
Flood risk 4/10 · Minor
- FEMA flood zone
- X (shaded)
- Chance of flooding over 30 yrs
- 0.13%
- Est. flood insurance / yr
- $507 – $1,088
Fire risk 2/10 · Minimal
- Est. fire insurance / yr
- $1,241 – $2,305
Heat risk 10/10 · Severe
- Hot days now (above 106°F)
- 7 days/yr
- Hot days in 30 yrs
- 24 days/yr
Wind risk 9/10 · Severe
- Chance of severe wind over 30 yrs
- 99.0%
Air-quality risk 2/10 · Minimal
- Unhealthy air days now
- 1 days/yr
- Unhealthy air days in 30 yrs
- 2 days/yr
Risk factors via First Street. Map © Google.
Why this score? — see what drove the D grade
The composite is a weighted blend of 9 inputs, each scored 0–100. Each bar is that input's sub-score; the figure is the points it added to the 100-point composite (weight × sub-score).
- Cash flow +20.4/30.0
- DSCR +6.5/10.0
- 1% rule +4.0/10.0
- Schools +3.3/10.0
- Livability +3.3/5.0
- Rent growth +2.5/5.0
- Condition / age +2.5/5.0
- ARV discount +0.0/15.0
- Appreciation +0.0/10.0
$174,900
🖨 Deal sheet 📄 Offer letter ✓ Due diligence
Listing remarks
4 Bedrooms and 2 full baths. A block from elementary school. No flood ins. required. Total remodel. New roof, paint, flooring, plumbing and electrical fixtures, cabinets, counters, appliances.
Key facts
- New plumbing
- New flooring
- New paint
Tags
Property features AI
Exterior
- Parking: Concrete driveway
- Utilities: Public water; Public sewer; Electricity connected; Cable available; Sewer connected; Water connected
- Home design: Single-family house; One story; Move-in ready
- Construction: Brick veneer exterior; Architectural shingle roof; Slab foundation; Built (year source: Assessor)
- Exterior features: Private yard; Back yard partial fencing; City lot, level and rectangular
Interior
- Kitchen: Dishwasher; Electric range; Microwave
- Flooring: Luxury vinyl
- Bathrooms: 2 full bathrooms
- Heating & cooling: Central electric heating; Central air conditioning (electric)
- Interior features: Tray ceilings; Double pane windows
- Laundry & utility: Laundry room with washer and electric dryer hookups; Electric water heater
Neighborhood map
What this means for you Summary
Snapshot
- This is a 4-bed/1.0-bath single-family listed at $175k.
Deal economics
- At list price, monthly cash flow is $228 ($3k/yr) — positive.
- The deal already cash-flows at list — no discount required.
- To meet the 1% rule (rent ≥ 1% of price), the offer needs to be $158k (9.7% below list).
- Recommended offer: $158k (9.7% below list) — sets the bar for 1% rule.
- Cap rate 7.9% vs local median 4.2% in Gautier — top-decile yield for the area; either an underpriced asset or a hidden risk that comps aren't pricing in. Stress-test before assuming the spread holds.
Location & tenants
- Location reads 66/100 on livability (#89 in MS) — a middle-class / working-renter tenant base. Strengths: cost of living A+, housing A+; Watch: health & safety D+, schools D, employment D.
- Pascagoula-Gautier School District (urban): math 40% / reading 38% proficiency, ranked #41 of 130 in MS (top 32%) — families likely to look elsewhere, expect single-tenant / working-renter base with shorter leases; 78% free/reduced lunch — lower-income household profile, screen leases tightly.
- Market conditions: 208 active listings in the ZIP; 516 units permitted in Jackson County in 2024 (6 in 5+ unit buildings).
- This rent runs 33% of the median local income ($57k/yr) — at the standard rent-burdened threshold; future hikes will face affordability resistance.
Forward outlook
- Local home prices are declining (-3.0%/yr); year-one equity from $1k of loan paydown is wiped out by about $5k of value loss. Plan a longer hold.
Negotiation context
- It's been on market 19 days — a 2% lower offer ($172k) is reasonable based on typical stale-listing flexibility.
- 2 sale attempts with the ask held roughly flat each time — persistent listings suggest the price (not the market) is what's stuck; bring a comps-based counter.
Risks & watch-outs
- Climate carrying-cost: severe wind risk, 99% chance of damaging wind over 30y; extreme-heat days projected 7→24/yr by 2055 (HVAC capex compounding) — expect insurance premiums to compound above CPI over the hold.
Questions for the listing agent
- Built in 1968 — when were the roof, HVAC, electrical panel, plumbing, and water heater last replaced?
- Is there a deadline driving the sale (1031 exchange, divorce, estate, relocation)? That informs how much negotiation room exists.
- Schools are D-rated, which usually means shorter tenancies and higher turnover. Who's the typical renter profile here, and what's been the actual vacancy rate?
- The area grade is low — what's the realistic commute time and amenity access for the typical tenant pool here? Any planned neighborhood developments (good or bad) we should know about?
- What's the average days-on-market for RENTAL listings here right now (not sales)? A rising rental-DOM trend means longer vacancies and softer asking-rent achievability than the comps imply.
- What's the recent tenant-quality profile in this submarket — average credit score on applications, eviction rate, late-payment / NSF rate, and stable-employment percentage? A property-management company in the area should have these aggregated.
- How much new for-sale + rental construction is in the pipeline within 1–3 miles? Heavy new supply typically softens prices + rents 12–24 months out; constrained supply supports both.
Investment metrics
- 1% rule
- 0.90% ✗
- Cap rate
- 7.86%
- Cash-on-cash
- 5.59%
- DSCR
- 1.25
- GRM
- 9.2
CMA / ARV
- ARV (on-the-fly)
- $123,552
- Comps found
- 12
Show comp detail 12 sales within ~0.75 mi
| Address | Dist | Beds/Ba | Sqft | Sold | Price | $/sf | Match |
|---|---|---|---|---|---|---|---|
| 2823 Woodlane St | 0.15mi | 3/1.0 (-1) | 1,011 (+8%) | 2mo | $160,900 | $159 | 74 |
| 2307 Ladnier Rd | 0.22mi | 3/2.0 (-1) | 960 (+3%) | 4mo | $135,000 | $141 | 73 |
| 2000 Carol Dr | 0.37mi | 3/1.0 (-1) | 936 (0%) | 7mo | $87,500 | $93 | 72 |
| 2612 Fraternity Dr | 0.24mi | 3/1.0 (-1) | 927 (-1%) | 22mo | $107,500 | $116 | 64 |
| 2137 Woodbury Rd | 0.36mi | 3/1.0 (-1) | 914 (-2%) | 15mo | $119,000 | $130 | 62 |
| 2413 Northbrook Dr | 0.30mi | 3/1.5 (-1) | 1,023 (+9%) | 4mo | $152,500 | $149 | 60 |
| 2313 Ladnier Rd | 0.21mi | 3/2.0 (-1) | 1,025 (+10%) | 10mo | $134,900 | $132 | 57 |
| 2306 Calle De Desoto St | 0.23mi | 3/2.0 (-1) | 1,032 (+10%) | 8mo | $95,000 | $92 | 56 |
| 3013 W Park Dr | 0.42mi | 3/1.5 (-1) | 962 (+3%) | 16mo | $159,000 | $165 | 55 |
| 1905 C W Webb Rd | 0.41mi | 3/1.0 (-1) | 856 (-8%) | 9mo | $109,000 | $127 | 54 |
| 2001 S Haven Dr | 0.61mi | 3/1.5 (-1) | 962 (+3%) | 10mo | $135,000 | $140 | 52 |
| 3108 Bemis Ave | 0.63mi | 3/1.0 (-1) | 1,053 (+12%) | 12mo | $135,000 | $128 | 34 |
Match score weights: distance 35% · size 25% · config 20% · recency 20%. Top-matched comps best support the ARV.
Projected returns pro-forma
-3.0% appreciation · 3.0% rent growth · sell at horizon
- IRR
- -7.7%
- Equity multiple
- 0.72×
- Total profit
- $-13,909
- Equity at exit
- $26,078
- IRR
- 1.8%
- Equity multiple
- 1.13×
- Total profit
- $6,216
- Equity at exit
- $15,122
Cash invested: $48,972 (down + closing). Projections, not guarantees.
Landlord ↔ Tenant lean methodology
- Overall (STATE)
- 90 Strongly Landlord-Friendly
- State Mississippi
- 90 Strongly Landlord-Friendly · R+11
- County
- — inherits STATE
- City
- — inherits STATE
ZIP-level market 39553
- Home prices YoY
- -17.0%
- Active inventory
- 208
- Price-to-rent
- 9.2×
Monthly cashflow live
- Estimated rent
- $1,579 medium interval (Pro) →
- Mortgage (P&I)
- −$917
- Tax from tax record
- −$30 /mo · $355/yr
- Insurance
- −$73
- HOA
- −$0
- Vacancy / Maint / Mgmt
- −$332
- Net cashflow
- $228
Break-even live
UW: 25.0% down · 7.5% · 30yr · 1.5% tax · 5.0% vac · 8.0% maint · 8.0% mgmt
Financing live
Cash to close
- Down payment
- $43,725
- Closing costs
- $5,247
- Reserves months
- —
- Total cash needed
- —
Loan-product check · same deal, 3 products live
Conventional
25% down · 7.5% · 30yr
- Down + closing
- —
- Monthly P&I
- —
- Monthly cashflow
- —
- DSCR
- —
- Eligible?
- —
Personal DTI + credit; lowest rate.
DSCR
20% down · 8.5% · 30yr
- Down + closing
- —
- Monthly P&I
- —
- Monthly cashflow
- —
- DSCR
- —
- Eligible?
- —
No personal income docs; deal must DSCR.
Hard money
10% down · 12.0% · 12mo
- Down + closing
- —
- Monthly P&I
- —
- Monthly cashflow
- —
- DSCR
- —
- Eligible?
- —
Short-term bridge; refi at stabilization.
Listing history 14 events
-
2026-06-13status $174,900 Pending 19 DOM
-
2026-06-10days on market $174,900 Active 19 DOM
-
2026-06-09days on market $174,900 Active 18 DOM
-
2026-06-08days on market $174,900 Active 17 DOM
-
2026-06-07statusdays on market $174,900 Active 16 DOM
-
2026-06-01statusdays on market $174,900 Pending 12 DOM
-
2026-05-31days on market $174,900 Active 11 DOM
-
2026-05-30statusdays on market $174,900 Active 10 DOM
-
2026-05-08status Pending
-
2026-05-05status Active
-
2026-05-01status Pending
-
2026-04-25$174,900 Active
-
2025-11-21soldstatus
-
2025-11-21soldstatus
ⓘ Source: listings_history table (triggers on properties + properties_extension) + one-shot
backfill from property_details.listing_events for pre-trigger history.
Tax reassessment forecast MS · Resets to sale price
- Current annual tax
- $355 · $30/mo
- Projected year-2 tax
- $1,382 · $115/mo
- Expected delta
- +$1,026/yr (+$86/mo · 288.9%)
ⓘ Screening estimate from a state-policy table — verify with the county assessor before closing.
Climate risk First Street
- Flood 4/10 Moderate FEMA zone X (shaded) · 13% chance over 30 yrs
- Wildfire 2/10 Low
- Heat 10/10 Extreme 7 d/yr ≥106°F today · 24 d/yr by 30 yrs out
- Wind 9/10 Extreme 99% chance of damaging wind over 30 yrs
- Air quality 2/10 Low 1 unhealthy d/yr today · 2 by 30 yrs out
Nearby sold comps map
Loading sold comps map…
Walkable amenities ~0.75 mi
Loading nearby amenities…
Taxation est. · year 1
- Rental income
- $18,953
- − Mortgage interest
- −$9,797
- − Property taxes
- −$355
- − Insurance
- −$874
- − Repairs & maintenance
- −$1,516
- − Management
- −$1,516
- − Depreciation
- −$5,088
- Taxable loss
- −$194
- Est. tax savings @ 24.0%
- +$47
- After-tax cash flow
- $2,783/yr
For passive investors: Depreciation is non-cash, so a rental often shows a tax loss while cash-flowing — sheltering income. Rental losses are passive: they offset passive income freely, and up to $25,000/yr can offset ordinary (W-2) income if you actively participate and your MAGI is under $100k (phasing out to $0 by $150k); unused losses carry forward. On sale, claimed depreciation is recaptured at up to 25%, and gains may owe capital-gains tax (a 1031 exchange can defer both). Figures are a year-1 estimate at your 24.0% rate — not tax advice; consult a CPA.
Schools (NCES district)
- District
- Pascagoula-Gautier School District
- NCES district ID
- 2803480
- Math proficiency
- 40% ▼ -3.00%
- Reading proficiency
- 38% ▼ -4.00%
- Median HH income
- $41,392
- Composite
- 32.86/100
- National rank
- #5613
- State rank
- #41 of 130 in MS
Livability — Gautier
- Score
- 66/100
- State rank
- #89
- US rank
- #11250
Category grades
Schools grade is shown separately in the Schools card above.
Census & demographics
- Census place
- Gautier, MS
- County
- Jackson County · 82,196 people
- City population
- 17,225
- Metro
- Gulfport-Biloxi, MS
- Population (ZIP)
- 17,225
- Household income
- $57,460
- Rent vs Own
- Severe rent burden
- 653.0
Population outlook (Jackson County) Hauer SSP2
- Today (2025)
- 146,926 people
- By 2030
- 148,442 · +1.0%
- By 2040
- 149,631 · +1.8%
- By 2050
- 148,723 · +1.2%
- By 2075
- 147,845 · +0.6%
- By 2100
- 144,510 · -1.6%
Race, ethnicity, and origin ACS 2023
- Neighborhood character
- Diverse neighborhood (Simpson 0.60)
- Race & ethnicity
- White 55% Black 28% Hispanic / Latino 12% Two or more races 7% Asian 1%
- Hispanic origin (detail)
- Mexican 3% Puerto Rican 8%
- Common ancestry
- Slovak 4% Lithuanian 3% Serbian 2%
- Foreign-born
- 3% · Canada, China
- Languages at home
- 90% English-only · Spanish 8% Chinese 0%
Political lean MEDSL · Jackson
- 2024 margin
- Solid R (+39.9) · D 29.5% · R 69.4% · Other 1.1%
- 2008→2024 swing
- -6.4pp toward R · 2008: -33.5pp · 2024: -39.9pp
- All cycles
- 2024: R+39.9 2020: R+34.6 2016: R+39.9 2012: R+36.1 2008: R+33.5
Not yet ingested
- Civics
- —
Market trends
- HPI YoY
- ▼ -42.77%
- Current HPI
- 209.1746
- Rent YoY
- —
- Metro
- Gulfport-Biloxi, MS
- State GDP YoY
- —
- F500 in state
- 0
Price history
6 events — show timeline
- 2026-05-08 Pending — MLSU
- 2026-05-05 Relisted — MLSU
- 2026-05-01 Pending — MLSU
- 2026-04-25 Listed $174,900 MLSU
- 2025-11-21 Sold (Public Records) — Public Records
- 2025-11-21 Sold (Public Records) — Public Records
Property tax history
-3.9%/yrLatest (2025): $355 · +11.9% YoY. Source: county tax records.
Cash-flow waterfall
monthlySold comps — $/sqft
last 12 mo · ≤1 miLoading sold comps…