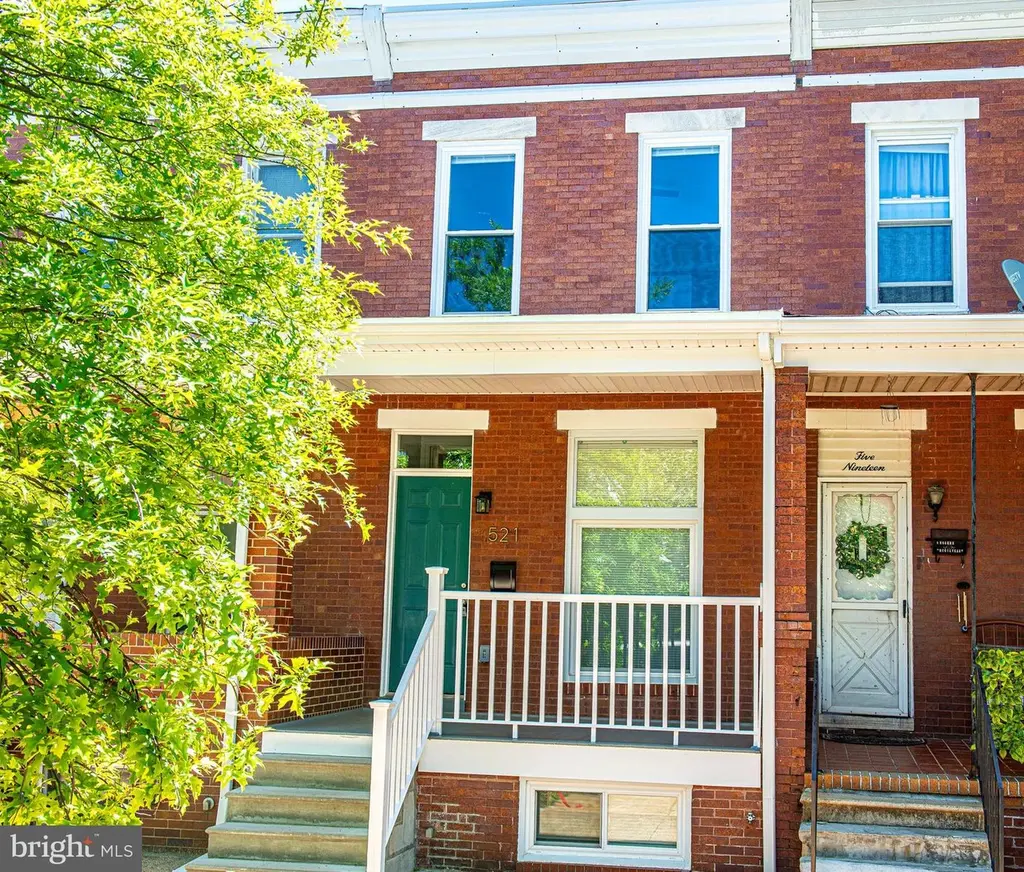
521 N Potomac St · Baltimore, MD
Flood risk 1/10 · Minimal
- FEMA flood zone
- X (unshaded)
- Chance of flooding over 30 yrs
- 0.0%
- Est. flood insurance / yr
- $473 – $860
Fire risk 1/10 · Minimal
- Est. fire insurance / yr
- $755 – $1,403
Heat risk 8/10 · Major
- Hot days now (above 103°F)
- 7 days/yr
- Hot days in 30 yrs
- 15 days/yr
Wind risk 6/10 · Moderate
- Chance of severe wind over 30 yrs
- 27.0%
Air-quality risk 4/10 · Minor
- Unhealthy air days now
- 6 days/yr
- Unhealthy air days in 30 yrs
- 7 days/yr
Risk factors via First Street. Map © Google.
Why this score? — see what drove the C grade
The composite is a weighted blend of 9 inputs, each scored 0–100. Each bar is that input's sub-score; the figure is the points it added to the 100-point composite (weight × sub-score).
- Cash flow +24.9/30.0
- DSCR +8.1/10.0
- ARV discount +7.4/15.0
- 1% rule +5.1/10.0
- Rent growth +5.0/5.0
- Livability +3.8/5.0
- Condition / age +2.5/5.0
- Schools +1.0/10.0
- Appreciation +0.0/10.0
$175,000
🖨 Deal sheet 📄 Offer letter ✓ Due diligence
Listing remarks MLS
List price to be opening bid at online only auction. Online auction to be conducted on Auctioneers website. Bidding begins Thursday, September 19th & ends Tuesday, September 24, 2024 @ 12:30PM. Renovation Opportunity: Brick-Front Townhouse in the "Elwood Park" Neighborhood of Baltimore City. with 2 or 3 bedrooms and 1 full bath. The house is in need of a full renovation and is not occupied. It is a great opportunity to renovate & flip, or use as a rental. According to SDAT, the house has 1,142 sq. ft of above grade living space with 3 bedrooms & 1 full bath. Location: The property has a convenient location near dining, shopping, schools, recreational facilities, and access to transportation routes. Johns Hopkins Hospital, Elwood Park and Patterson Park are nearby. Exterior Picture is from Google Maps.
Key facts
- Heating systems
- Spacious kitchen
- Unfinished basement
Tags
Property features AI
Exterior
- Parking: On-street parking
- Utilities: Public water; Public sewer; Electric service
- Home design: Interior townhouse/rowhouse; Fee simple ownership; Major remodel/effective year 2026
- Construction: Brick exterior; Permanent foundation; Unfinished below-grade area
- Exterior features: Brick construction; Above-grade and below-grade structures
Interior
- Kitchen: Built-in microwave; Dishwasher; Gas oven/range; Refrigerator; Stainless steel appliances
- Bedrooms: 2 bedrooms on the first upper level
- Bathrooms: 1 full bathroom; 1 half bathroom
- Heating & cooling: Forced air heating (natural gas); Central air conditioning with ceiling fans; Electric hot water
- Interior features: Unfinished basement; Basement laundry
- Laundry & utility: Washer and dryer (laundry in basement)
Neighborhood map
What this means for you Summary
Snapshot
- This is a 2-bed/1.0-bath townhouse listed at $175k.
Deal economics
- At list price, monthly cash flow is $376 ($5k/yr) — positive.
- The deal already cash-flows at list — no discount required.
- Meets the 1% rule at list price ($2k rent vs $175k).
- Cap rate 8.9% vs local median 6.0% in Baltimore — top-decile yield for the area; either an underpriced asset or a hidden risk that comps aren't pricing in. Stress-test before assuming the spread holds.
Location & tenants
- Location reads 76/100 on livability (#90 in MD, #3,396 nationally) — a middle-class / working-renter tenant base. Strengths: amenities A+, commute A+, housing A+; Watch: schools D, crime F.
- Baltimore City Public Schools (urban): math 7% / reading 16% proficiency, ranked #24 of 24 in MD (top 100%) — low school quality limits family demand, transient renter base, plan for 1-2y turnover; 79% free/reduced lunch — lower-income household profile, screen leases tightly.
- Market conditions: Rents rising fast (+9.9%/yr); 143 active listings in the ZIP; 40 comparable units currently listed for rent nearby; rentals at typical pace (median 24d on market — plan ~3-4 weeks tenant-placement turnaround); lower-income renter base — watch delinquency; 1,273 units permitted in Baltimore city in 2024 (1,104 in 5+ unit buildings).
- At $1,775/mo this rent would consume 49% of the median local household income ($43k/yr) (locally 966% of renters already pay >50% of income on rent) — very limited rent-growth headroom before tenants either downsize or default.
Forward outlook
- Local home prices are declining (-3.0%/yr); year-one equity from $1k of loan paydown is wiped out by about $5k of value loss. Plan a longer hold.
- Baltimore County population projected to shrink 4% by 2050 — rents likely to lag national; underwrite the cash flow, not the appreciation.
- At projected returns (-3.0% appreciation + 8.0% rent growth), your $49k cash investment doubles in ~8 years — after that, you're playing with house money.
Negotiation context
- Only 11 days on market — expect competitive offers; lowballing is unlikely to land.
- 4 sale attempts since 29y ago with the ask held roughly flat each time — persistent listings suggest the price (not the market) is what's stuck; bring a comps-based counter.
- Current owner paid $56k; list at $175k implies a 212% gain — meaningful room to come down on a strong offer.
Risks & watch-outs
- Watch-outs: built in 1915 — expect roof / HVAC / electrical / plumbing capex.
- Climate carrying-cost: major wind risk, 27% chance of damaging wind over 30y; extreme-heat days projected 7→15/yr by 2055 (HVAC capex compounding) — expect insurance premiums to compound above CPI over the hold.
Questions for the listing agent
- Built in 1915 — when were the roof, HVAC, electrical panel, plumbing, and water heater last replaced?
- Is there a deadline driving the sale (1031 exchange, divorce, estate, relocation)? That informs how much negotiation room exists.
- Schools are D-rated, which usually means shorter tenancies and higher turnover. Who's the typical renter profile here, and what's been the actual vacancy rate?
- Crime grade is F in this area — have there been break-ins, vandalism, or insurance claims at this property in the last 3 years? What carrier currently insures it and at what premium?
- What's the average days-on-market for RENTAL listings here right now (not sales)? A rising rental-DOM trend means longer vacancies and softer asking-rent achievability than the comps imply.
- What's the recent tenant-quality profile in this submarket — average credit score on applications, eviction rate, late-payment / NSF rate, and stable-employment percentage? A property-management company in the area should have these aggregated.
- How much new for-sale + rental construction is in the pipeline within 1–3 miles? Heavy new supply typically softens prices + rents 12–24 months out; constrained supply supports both.
Investment metrics
- 1% rule
- 1.01% ✓
- Cap rate
- 8.87%
- Cash-on-cash
- 9.20%
- DSCR
- 1.41
- GRM
- 8.2
CMA / ARV
- ARV (on-the-fly)
- $174,726
- Comps found
- 12
Show comp detail 12 sales within ~0.75 mi
| Address | Dist | Beds/Ba | Sqft | Sold | Price | $/sf | Match |
|---|---|---|---|---|---|---|---|
| 629 N Kenwood Ave | 0.17mi | 2/1.5 | 1,100 (-4%) | 1mo | $76,500 | $70 | 83 |
| 134 N Curley St | 0.24mi | 2/2.0 | 1,170 (+2%) | 1mo | $270,000 | $231 | 80 |
| 149 N Highland Ave | 0.35mi | 2/1.0 | 1,170 (+2%) | 1mo | $75,000 | $64 | 79 |
| 14 S Curley St | 0.40mi | 2/1.0 | 1,092 (-4%) | 1mo | $269,000 | $246 | 73 |
| 2712 Ashland Ave | 0.34mi | 3/1.5 (+1) | 1,164 (+2%) | 1mo | $175,000 | $150 | 73 |
| 122 Ellwood Ave | 0.26mi | 3/1.5 (+1) | 1,200 (+5%) | 0mo | $235,000 | $196 | 72 |
| 3135 Mcelderry St | 0.14mi | 3/2.0 (+1) | 1,224 (+7%) | 1mo | $234,000 | $191 | 72 |
| 410 N Patterson Park Ave | 0.56mi | 3/1.0 (+1) | 1,180 (+3%) | 0mo | $180,000 | $153 | 63 |
| 2736 Mura St | 0.59mi | 3/2.0 (+1) | 1,120 (-2%) | 0mo | $81,000 | $72 | 60 |
| 2435 Jefferson St | 0.42mi | 3/1.0 (+1) | 1,260 (+10%) | 1mo | $140,000 | $111 | 58 |
| 280 S Robinson St | 0.63mi | 2/1.0 | 1,282 (+12%) | 1mo | $294,000 | $229 | 50 |
| 410 N Chester St | 0.70mi | 2/1.5 | 1,260 (+10%) | 0mo | $180,000 | $143 | 48 |
Match score weights: distance 35% · size 25% · config 20% · recency 20%. Top-matched comps best support the ARV.
Projected returns pro-forma
-3.0% appreciation · 8.0% rent growth · sell at horizon
- IRR
- 2.5%
- Equity multiple
- 1.10×
- Total profit
- $4,862
- Equity at exit
- $26,093
- IRR
- 16.0%
- Equity multiple
- 2.58×
- Total profit
- $77,389
- Equity at exit
- $15,131
Cash invested: $49,000 (down + closing). Projections, not guarantees.
Landlord ↔ Tenant lean methodology
- Overall (CITY)
- 12 Strongly Tenant-Friendly
- State Maryland
- 27 Tenant-Leaning · D+14
- County
- — inherits STATE
- City Baltimore
- 12 Strongly Tenant-Friendly · D+58
ZIP-level market 21205
- Home prices YoY
- -5.8%
- Rents YoY
- 9.9%
- Active inventory
- 143
- Price-to-rent
- 8.2×
Monthly cashflow live
- Estimated rent
- $1,775 high interval (Pro) →
- Mortgage (P&I)
- −$918
- Tax from tax record
- −$36 /mo · $432/yr
- Insurance
- −$73
- HOA
- −$0
- Vacancy / Maint / Mgmt
- −$373
- Net cashflow
- $376
Break-even live
UW: 25.0% down · 7.5% · 30yr · 1.5% tax · 5.0% vac · 8.0% maint · 8.0% mgmt
Financing live
Cash to close
- Down payment
- $43,750
- Closing costs
- $5,250
- Reserves months
- —
- Total cash needed
- —
Loan-product check · same deal, 3 products live
Conventional
25% down · 7.5% · 30yr
- Down + closing
- —
- Monthly P&I
- —
- Monthly cashflow
- —
- DSCR
- —
- Eligible?
- —
Personal DTI + credit; lowest rate.
DSCR
20% down · 8.5% · 30yr
- Down + closing
- —
- Monthly P&I
- —
- Monthly cashflow
- —
- DSCR
- —
- Eligible?
- —
No personal income docs; deal must DSCR.
Hard money
10% down · 12.0% · 12mo
- Down + closing
- —
- Monthly P&I
- —
- Monthly cashflow
- —
- DSCR
- —
- Eligible?
- —
Short-term bridge; refi at stabilization.
Rent comps 40 comps
| Address | Beds | Baths | Sqft | Rent | $/sqft | DOM | Units | Dist |
|---|---|---|---|---|---|---|---|---|
| 520 N Decker Ave Baltimore, MD | 2.0 | 1.0 | 1000 | $1,650 | $1.65 | 43d | 1 | 0.04mi |
| 2934 E Monument St Baltimore, MD | 2.0 | 1.0 | 1200 | $1,499 | $1.25 | 43d | 1 | 0.09mi |
| 718 N Curley St Baltimore, MD | 3.0 | 3.0 | 1500 | $2,000 | $1.33 | 4d | 1 | 0.13mi |
| 724 N Curley St Baltimore, MD | 3.0 | 3.0 | 1500 | $2,200 | $1.47 | 4d | 1 | 0.14mi |
| 404 N Robinson St Baltimore, MD | 3.0 | 3.0 | 1320 | $2,200 | $1.67 | 23d | 1 | 0.16mi |
| 404 N Robinson St Baltimore, MD | 3.0 | 3.0 | 1320 | $2,100 | $1.59 | 16d | 1 | 0.16mi |
| 2800 Orleans St Baltimore, MD | 3.0 | 1.0 | 1404 | $1,600 | $1.14 | 14d | 1 | 0.19mi |
| 2800 Orleans St Baltimore, MD | 3.0 | 1.0 | 1404 | $1,600 | $1.14 | 17d | 1 | 0.19mi |
| 2815 Orleans St Baltimore, MD | 2.0 | 1.0 | 1204 | $1,600 | $1.33 | 2d | 1 | 0.19mi |
| 531 N Belnord Ave Baltimore, MD | 2.0 | 1.5 | 1100 | $1,700 | $1.55 | 23d | 1 | 0.19mi |
| 3304 McElderry St Baltimore, MD | 3.0 | 2.0 | 1413 | $1,900 | $1.34 | 43d | 1 | 0.20mi |
| 415 N Belnord Ave Baltimore, MD | 2.0 | 1.0 | 1008 | $1,300 | $1.29 | 23d | 1 | 0.22mi |
| 627 N Lakewood Ave Baltimore, MD | 3.0 | 2.5 | 1175 | $1,900 | $1.62 | 21d | 1 | 0.23mi |
| 203 N Ellwood Ave Unit Main Baltimore, MD | 2.0 | 2.0 | 880 | $2,200 | $2.50 | 23d | 1 | 0.23mi |
| 150 N Curley St Baltimore, MD | 2.0 | 2.5 | 1266 | $1,850 | $1.46 | 17d | 1 | 0.26mi |
| 2729 Ashland Ave Baltimore, MD | 3.0 | 1.0 | 1000 | $1,350 | $1.35 | 2d | 1 | 0.28mi |
| 502 N Glover St Baltimore, MD | 2.0 | 1.5 | 827 | $1,250 | $1.51 | 20d | 1 | 0.29mi |
| 415 N Glover St Baltimore, MD | 2.0 | 2.5 | 1092 | $1,600 | $1.47 | 23d | 1 | 0.29mi |
| 2608 McElderry St Baltimore, MD | 3.0 | 1.0 | 1144 | $1,550 | $1.35 | 23d | 1 | 0.29mi |
| 3205 Esther Pl Baltimore, MD | 2.0 | 2.0 | 960 | $1,850 | $1.93 | 23d | 1 | 0.32mi |
| 218 N Glover St Baltimore, MD | 2.0 | 2.0 | 1360 | $1,750 | $1.29 | 43d | 1 | 0.34mi |
| 34 N Linwood Ave Baltimore, MD | 2.0 | 1.5 | 1288 | $2,400 | $1.86 | 23d | 1 | 0.34mi |
| 517 N Rose St Baltimore, MD | 3.0 | 1.0 | 845 | $1,400 | $1.66 | 4d | 1 | 0.34mi |
| 29 N Ellwood Ave Baltimore, MD | 3.0 | 1.5 | 1100 | $2,395 | $2.18 | 23d | 1 | 0.35mi |
| 2608 E Fayette St Unit 1 Baltimore, MD | 2.0 | 1.0 | 900 | $1,700 | $1.89 | 14d | 1 | 0.35mi |
| 225 N Luzerne Ave Baltimore, MD | 3.0 | 1.0 | 1198 | $1,350 | $1.13 | 19d | 1 | 0.35mi |
| 17 N East Ave Baltimore, MD | 2.0 | 2.0 | 1326 | $2,550 | $1.92 | 23d | 1 | 0.37mi |
| 113 N Clinton St Baltimore, MD | 2.0 | 1.0 | 1300 | $1,995 | $1.53 | 43d | 1 | 0.37mi |
| 127 N Glover St Baltimore, MD | 2.0 | 1.5 | 1110 | $2,100 | $1.89 | 2d | 1 | 0.38mi |
| 10 N Streeper St Baltimore, MD | 3.0 | 2.5 | 1440 | $2,500 | $1.74 | 23d | 1 | 0.38mi |
| 233 N Rose St Baltimore, MD | 2.0 | 2.5 | 934 | $1,750 | $1.87 | 17d | 1 | 0.38mi |
| 227 N Rose St Baltimore, MD | 2.0 | 4.0 | 1420 | $1,600 | $1.13 | 23d | 1 | 0.38mi |
| 425 N Milton Ave Baltimore, MD | 3.0 | 1.0 | 1200 | $1,525 | $1.27 | 14d | 1 | 0.39mi |
| 230 N Rose St Baltimore, MD | 2.0 | 1.5 | 1200 | $1,545 | $1.29 | 43d | 1 | 0.40mi |
| 224 N Rose St Baltimore, MD | 2.0 | 2.5 | 1120 | $1,875 | $1.67 | 17d | 1 | 0.40mi |
| 402 N Milton Ave Unit 402B Baltimore, MD | 2.0 | 1.0 | 950 | $1,290 | $1.36 | 43d | 1 | 0.42mi |
| 720 N Port St Baltimore, MD | 2.0 | 1.0 | 950 | $1,300 | $1.37 | 43d | 1 | 0.45mi |
| 104 N Rose St Baltimore, MD | 3.0 | 2.0 | 936 | $2,500 | $2.67 | 43d | 1 | 0.46mi |
| 437 N Montford Ave Baltimore, MD | 3.0 | 1.5 | 1100 | $1,450 | $1.32 | 43d | 1 | 0.46mi |
| 9 N Luzerne Ave Baltimore, MD | 3.0 | 2.5 | 1380 | $2,450 | $1.78 | 4d | 1 | 0.47mi |
Listing history 16 events
-
2026-06-04status $175,000 Pending 11 DOM
-
2026-06-03days on market $175,000 Active 11 DOM
-
2026-06-02days on market $175,000 Active 10 DOM
-
2026-06-01days on market $175,000 Active 9 DOM
-
2026-05-31days on market $175,000 Active 8 DOM
-
2026-05-23$175,000 Active
-
2024-10-24soldstatus $56,100 Closed 840-char remark
Show marketing remark (840 chars)
List price to be opening bid at online only auction. Online auction to be conducted on Auctioneers website. Bidding begins Thursday, September 19th & ends Tuesday, September 24, 2024 @ 12:30PM. Renovation Opportunity: Brick-Front Townhouse in the "Elwood Park" Neighborhood of Baltimore City. with 2 or 3 bedrooms and 1 full bath. The house is in need of a full renovation and is not occupied. It is a great opportunity to renovate & flip, or use as a rental. According to SDAT, the house has 1,142 sq. ft of above grade living space with 3 bedrooms & 1 full bath. Location: The property has a convenient location near dining, shopping, schools, recreational facilities, and access to transportation routes. Johns Hopkins Hospital, Elwood Park and Patterson Park are nearby. Exterior Picture is from Google Maps.
-
2024-10-02status Pending 840-char remark
Show marketing remark (840 chars)
List price to be opening bid at online only auction. Online auction to be conducted on Auctioneers website. Bidding begins Thursday, September 19th & ends Tuesday, September 24, 2024 @ 12:30PM. Renovation Opportunity: Brick-Front Townhouse in the "Elwood Park" Neighborhood of Baltimore City. with 2 or 3 bedrooms and 1 full bath. The house is in need of a full renovation and is not occupied. It is a great opportunity to renovate & flip, or use as a rental. According to SDAT, the house has 1,142 sq. ft of above grade living space with 3 bedrooms & 1 full bath. Location: The property has a convenient location near dining, shopping, schools, recreational facilities, and access to transportation routes. Johns Hopkins Hospital, Elwood Park and Patterson Park are nearby. Exterior Picture is from Google Maps.
-
2024-09-05$25,000 Active 840-char remark
Show marketing remark (840 chars)
List price to be opening bid at online only auction. Online auction to be conducted on Auctioneers website. Bidding begins Thursday, September 19th & ends Tuesday, September 24, 2024 @ 12:30PM. Renovation Opportunity: Brick-Front Townhouse in the "Elwood Park" Neighborhood of Baltimore City. with 2 or 3 bedrooms and 1 full bath. The house is in need of a full renovation and is not occupied. It is a great opportunity to renovate & flip, or use as a rental. According to SDAT, the house has 1,142 sq. ft of above grade living space with 3 bedrooms & 1 full bath. Location: The property has a convenient location near dining, shopping, schools, recreational facilities, and access to transportation routes. Johns Hopkins Hospital, Elwood Park and Patterson Park are nearby. Exterior Picture is from Google Maps.
-
2000-06-12historical
-
2000-01-16
-
1998-04-30soldstatus $50,000
-
1997-12-23soldstatus $15,000
-
1997-12-23soldstatus $20,900
-
1997-10-22historical
-
1997-04-30
ⓘ Source: listings_history table (triggers on properties + properties_extension) + one-shot
backfill from property_details.listing_events for pre-trigger history.
Tax reassessment forecast MD · Partial reset (capped growth)
- Current annual tax
- $432 · $36/mo
- Projected year-2 tax
- $1,170 · $97/mo
- Expected delta
- +$738/yr (+$61/mo · 170.7%)
ⓘ Screening estimate from a state-policy table — verify with the county assessor before closing.
Climate risk First Street
- Flood 1/10 Low FEMA zone X (unshaded) · 0% chance over 30 yrs
- Wildfire 1/10 Low
- Heat 8/10 Severe 7 d/yr ≥103°F today · 15 d/yr by 30 yrs out
- Wind 6/10 Major 27% chance of damaging wind over 30 yrs
- Air quality 4/10 Moderate 6 unhealthy d/yr today · 7 by 30 yrs out
Nearby sold comps map
Loading sold comps map…
Walkable amenities ~0.75 mi
Loading nearby amenities…
Taxation est. · year 1
- Rental income
- $21,301
- − Mortgage interest
- −$9,803
- − Property taxes
- −$432
- − Insurance
- −$875
- − Repairs & maintenance
- −$1,704
- − Management
- −$1,704
- − Depreciation
- −$5,091
- Taxable income
- $1,692
- Est. tax owed @ 24.0%
- −$406
- After-tax cash flow
- $4,102/yr
For passive investors: Depreciation is non-cash, so a rental often shows a tax loss while cash-flowing — sheltering income. Rental losses are passive: they offset passive income freely, and up to $25,000/yr can offset ordinary (W-2) income if you actively participate and your MAGI is under $100k (phasing out to $0 by $150k); unused losses carry forward. On sale, claimed depreciation is recaptured at up to 25%, and gains may owe capital-gains tax (a 1031 exchange can defer both). Figures are a year-1 estimate at your 24.0% rate — not tax advice; consult a CPA.
Schools (NCES district)
- District
- Baltimore City Public Schools
- NCES district ID
- 2400090
- Math proficiency
- 7% ▼ -9.00%
- Reading proficiency
- 16% ▼ -5.00%
- Median HH income
- $42,108
- Composite
- 10.08/100
- National rank
- #9805
- State rank
- #24 of 24 in MD
Livability — Baltimore
- Score
- 76/100
- State rank
- #90
- US rank
- #3396
Category grades
Schools grade is shown separately in the Schools card above.
Census & demographics
- Census place
- Baltimore, MD
- County
- Baltimore City · 558,601 people
- City population
- 588,727
- Metro
- Baltimore-Columbia-Towson, MD
- Population (ZIP)
- 13,013
- Household income
- $43,176
- Rent vs Own
- Severe rent burden
- 966.0
Population outlook (Baltimore County) Hauer SSP2
- Today (2025)
- 624,249 people
- By 2030
- 621,541 · -0.4%
- By 2040
- 609,756 · -2.3%
- By 2050
- 597,249 · -4.3%
- By 2075
- 552,236 · -11.5%
- By 2100
- 513,934 · -17.7%
Race, ethnicity, and origin ACS 2023
- Neighborhood character
- Diverse neighborhood (Simpson 0.60)
- Race & ethnicity
- Black 60% Hispanic / Latino 16% White 14% Two or more races 11% Asian 3%
- Hispanic origin (detail)
- Mexican 1% Cuban 1% Dominican 4%
- Common ancestry
- Slovak 3% Romanian 1%
- Foreign-born
- 16% · Canada, China
- Languages at home
- 79% English-only · Spanish 11% Arabic 4% Chinese 1%
Political lean MEDSL · Baltimore
- 2024 margin
- Solid D (+73.0) · D 85.2% · R 12.2% · Other 2.6%
- 2008→2024 swing
- -2.5pp toward R · 2008: 75.5pp · 2024: 73.0pp
- All cycles
- 2024: D+73.0 2020: D+76.6 2016: D+74.6 2012: D+76.4 2008: D+75.5
Not yet ingested
- Civics
- —
Market trends
- HPI YoY
- ▼ -15.03%
- Current HPI
- 244.1345
- Rent YoY
- ▲ 9.88%
- Metro
- Baltimore-Columbia-Towson, MD
- State GDP YoY
- ▲ 2.97%
- F500 in state
- 12
Industry mix (Fortune 500 HQ in MD)
| Industry | F500 HQs | Revenue |
|---|---|---|
| Aerospace / Defense | 1 | $71B |
|
||
| Utilities | 1 | $25B |
|
||
| Hotels | 1 | $24B |
|
||
| Consumer Goods | 1 | $7B |
|
||
| Real Estate | 1 | $6B |
|
||
| Chemicals | 1 | $2B |
|
||
Price history
+1066.7% since first listed11 events — show timeline
- 2026-05-23 Listed $175,000 BRIGHT MLS
- 2024-10-24 Sold (MLS) $56,100 BRIGHT MLS
- 2024-10-02 Pending — BRIGHT MLS
- 2024-09-05 Listed $25,000 BRIGHT MLS
- 2000-06-12 Delisted — MRIS
- 2000-01-16 Listed — MRIS
- 1998-04-30 Sold (Public Records) $50,000 Public Records
- 1997-12-23 Sold (Public Records) $20,900 Public Records
- 1997-12-23 Sold (Public Records) $15,000 Public Records
- 1997-10-22 Delisted — MRIS
- 1997-04-30 Listed — MRIS
Property tax history
-7.1%/yrLatest (2025): $432 · +6.8% YoY. Source: county tax records.
Cash-flow waterfall
monthlySold comps — $/sqft
last 12 mo · ≤1 miLoading sold comps…