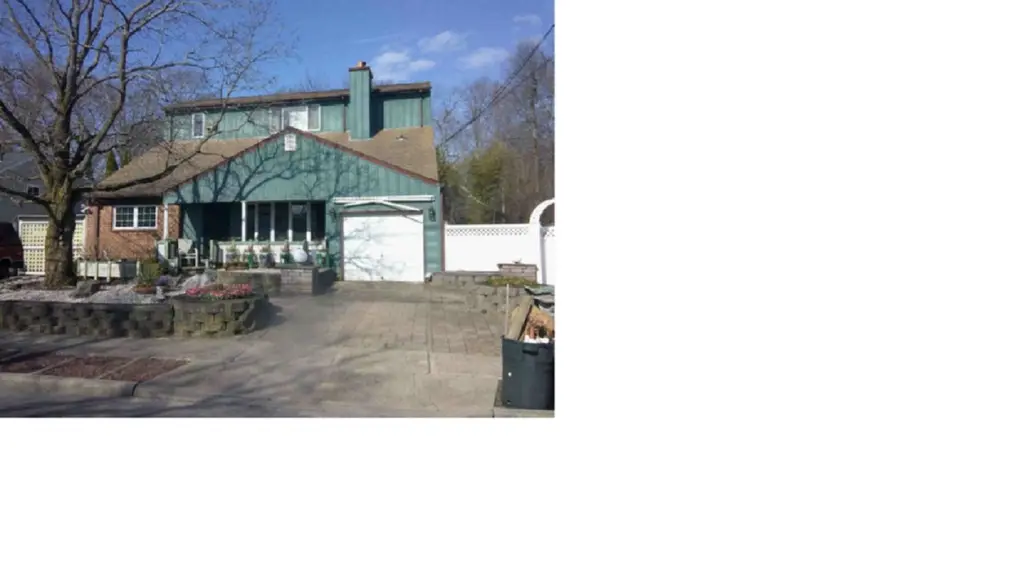
250 Lakeshore Blvd · Massapequa Park, NY
Flood risk 6/10 · Moderate
- FEMA flood zone
- X (unshaded)
- Chance of flooding over 30 yrs
- 0.54%
- Est. flood insurance / yr
- $473 – $860
Fire risk 3/10 · Minor
- Est. fire insurance / yr
- $691 – $1,283
Heat risk 5/10 · Moderate
- Hot days now (above 94°F)
- 7 days/yr
- Hot days in 30 yrs
- 16 days/yr
Wind risk 6/10 · Moderate
- Chance of severe wind over 30 yrs
- 71.0%
Air-quality risk 4/10 · Minor
- Unhealthy air days now
- 3 days/yr
- Unhealthy air days in 30 yrs
- 5 days/yr
Risk factors via First Street. Map © Google.
Why this score? — see what drove the D grade
The composite is a weighted blend of 9 inputs, each scored 0–100. Each bar is that input's sub-score; the figure is the points it added to the 100-point composite (weight × sub-score).
- ARV discount +15.0/15.0
- Schools +7.4/10.0
- Cash flow +7.1/30.0
- Livability +4.1/5.0
- Rent growth +2.5/5.0
- Condition / age +2.5/5.0
- 1% rule +1.5/10.0
- DSCR +1.3/10.0
- Appreciation +0.0/10.0
$925,000
🖨 Deal sheet 📄 Offer letter ✓ Due diligence
Listing remarks MLS
CASH ONLY BUYERS — SHOWINGS BY APPOINTMENT ONLY Spacious multi level home featuring a comfortable first floor layout with a living room, kitchen, and dining room, plus stair access to both upper and lower levels. Lower Level: • Large den • Laundry room • Boiler/utility room • Bonus bar room with pool table Upper Level: • Primary bedroom with full en suite bath • Two additional bedrooms and a second full bath • Upper-level addition includes an extra bedroom with walk in closet and a bonus den/flex room Outdoor Features: • Inground 20’ x 40’ gunite pool, recently updated with new coping, tile, electrical, and surrounding pavers • New 13’ x 15’ gazebo • Garage plus two driveways • Additional gated space for a boat or extra vehicle This property offers plenty of space, great bonus areas, and strong potential for the right cash buyer
Key facts
- Large den
- Laundry room
- Full en suite bath
Tags
Neighborhood map
What this means for you Summary
Snapshot
- This is a 4-bed/2.5-bath single-family listed at $925k.
Deal economics
- At list price, monthly cash flow is $-1k ($-16k/yr) — negative.
- To cash-flow at today's rent, offer at most $693k (25.1% below list).
- To meet the 1% rule (rent ≥ 1% of price), the offer needs to be $600k (35.1% below list).
- Recommended offer: $600k (35.1% below list) — sets the bar for 1% rule.
- Cap rate 4.6% vs local median 2.2% in Massapequa Park — top-decile yield for the area; either an underpriced asset or a hidden risk that comps aren't pricing in. Stress-test before assuming the spread holds.
Location & tenants
- Location reads 82/100 on livability (#85 in NY, #1,298 nationally) — a professional / high-income tenant draw. Strengths: crime A+, commute A+, employment A+; Watch: amenities D, cost of living F.
- Massapequa Union Free School District (suburban): math 76% / reading 83% proficiency, ranked #39 of 590 in NY (top 7%) — strong family-tenant draw, lease renewals of 3-5y typical; only 4% free/reduced lunch — higher-income household profile.
- Market conditions: 84 active listings in the ZIP; 1 comparable units currently listed for rent nearby; 824 units permitted in Nassau County in 2024 (153 in 5+ unit buildings).
Forward outlook
- Local home prices are declining (-3.0%/yr); year-one equity from $6k of loan paydown is wiped out by about $28k of value loss. Plan a longer hold.
- Nassau County population projected at +7% by 2050 — modest demand growth; plan on rents tracking national, not racing it.
Negotiation context
- It's been on market 70 days — a 6% lower offer ($870k) is reasonable based on typical stale-listing flexibility.
Risks & watch-outs
- Watch-outs: built in 1954 — expect roof / HVAC / electrical / plumbing capex.
- Climate carrying-cost: major flood risk; major wind risk, 71% chance of damaging wind over 30y; extreme-heat days projected 7→16/yr by 2055 (HVAC capex compounding) — expect insurance premiums to compound above CPI over the hold.
Questions for the listing agent
- What do current leases actually rent for vs. the listed asking? Can we see a recent rent roll and the last 12 months of T-12 income?
- It's been on market 70 days. Have you received any prior offers? Is the seller open to a 35% concession, seller financing, or rate buy-down credit?
- Built in 1954 — when were the roof, HVAC, electrical panel, plumbing, and water heater last replaced?
- Why hasn't it sold? Are there any deal-killer items the seller is aware of (foundation, flood, title, zoning, code violations)?
- Is there a deadline driving the sale (1031 exchange, divorce, estate, relocation)? That informs how much negotiation room exists.
- Schools are A-rated — typically a magnet for longer-tenancy family renters. What's the average tenant stay here, and is there a school-zone premium baked into asking?
- The area grade is low — what's the realistic commute time and amenity access for the typical tenant pool here? Any planned neighborhood developments (good or bad) we should know about?
- What's the average days-on-market for RENTAL listings here right now (not sales)? A rising rental-DOM trend means longer vacancies and softer asking-rent achievability than the comps imply.
- What's the recent tenant-quality profile in this submarket — average credit score on applications, eviction rate, late-payment / NSF rate, and stable-employment percentage? A property-management company in the area should have these aggregated.
- How much new for-sale + rental construction is in the pipeline within 1–3 miles? Heavy new supply typically softens prices + rents 12–24 months out; constrained supply supports both.
Investment metrics
- 1% rule
- 0.65% ✗
- Cap rate
- 4.59%
- Cash-on-cash
- -6.09%
- DSCR
- 0.73
- GRM
- 12.8
CMA / ARV
- ARV (on-the-fly)
- $1,448,692
- Comps found
- 8
Show comp detail 8 sales within ~0.75 mi
| Address | Dist | Beds/Ba | Sqft | Sold | Price | $/sf | Match |
|---|---|---|---|---|---|---|---|
| 63 Harmony Dr | 0.28mi | 5/4.0 (+1) | 3,200 (-4%) | 2mo | $1,500,000 | $469 | 67 |
| 41 Avoca Ave | 0.23mi | 5/3.0 (+1) | 3,200 (-4%) | 13mo | $1,389,000 | $434 | 65 |
| 136 Moore Ave | 0.50mi | 4/3.0 | 3,200 (-4%) | 11mo | $1,215,000 | $380 | 58 |
| 70 Lincoln Ave | 0.45mi | 5/3.0 (+1) | 3,400 (+2%) | 18mo | $1,499,000 | $441 | 54 |
| 135 Reiss Ave | 0.51mi | 4/3.0 | 3,150 (-6%) | 23mo | $1,200,000 | $381 | 46 |
| 20 Lake Ct | 0.50mi | 5/2.5 (+1) | 3,020 (-10%) | 13mo | $950,000 | $315 | 45 |
| 9 Suzanne B Ct | 0.57mi | 5/3.5 (+1) | 2,991 (-10%) | 6mo | $900,100 | $301 | 42 |
| 77 Sycamore St | 0.63mi | 5/3.5 (+1) | 2,993 (-10%) | 13mo | $1,500,000 | $501 | 33 |
Match score weights: distance 35% · size 25% · config 20% · recency 20%. Top-matched comps best support the ARV.
Projected returns pro-forma
-3.0% appreciation · 3.0% rent growth · sell at horizon
- IRR
- -26.8%
- Equity multiple
- 0.10×
- Total profit
- $-233,768
- Equity at exit
- $137,921
- IRR
- -24.4%
- Equity multiple
- -0.20×
- Total profit
- $-311,893
- Equity at exit
- $79,977
Cash invested: $259,000 (down + closing). Projections, not guarantees.
Landlord ↔ Tenant lean methodology
- Overall (STATE)
- 15 Strongly Tenant-Friendly
- State New York
- 15 Strongly Tenant-Friendly · D+10
- County
- — inherits STATE
- City
- — inherits STATE
ZIP-level market 11762
- Active inventory
- 84
- Price-to-rent
- 12.8×
Monthly cashflow live
- Estimated rent
- $6,000 medium interval (Pro) →
- Mortgage (P&I)
- −$4,851
- Tax from tax record
- −$819 /mo · $9,827/yr
- Insurance
- −$385
- HOA
- −$0
- Vacancy / Maint / Mgmt
- −$1,260
- Net cashflow
- $-1,315
Break-even live
UW: 25.0% down · 7.5% · 30yr · 1.5% tax · 5.0% vac · 8.0% maint · 8.0% mgmt
Financing live
Cash to close
- Down payment
- $231,250
- Closing costs
- $27,750
- Reserves months
- —
- Total cash needed
- —
Loan-product check · same deal, 3 products live
Conventional
25% down · 7.5% · 30yr
- Down + closing
- —
- Monthly P&I
- —
- Monthly cashflow
- —
- DSCR
- —
- Eligible?
- —
Personal DTI + credit; lowest rate.
DSCR
20% down · 8.5% · 30yr
- Down + closing
- —
- Monthly P&I
- —
- Monthly cashflow
- —
- DSCR
- —
- Eligible?
- —
No personal income docs; deal must DSCR.
Hard money
10% down · 12.0% · 12mo
- Down + closing
- —
- Monthly P&I
- —
- Monthly cashflow
- —
- DSCR
- —
- Eligible?
- —
Short-term bridge; refi at stabilization.
Rent comps 1 comps
| Address | Beds | Baths | Sqft | Rent | $/sqft | DOM | Units | Dist |
|---|---|---|---|---|---|---|---|---|
| 4025 Boston Ave Seaford, NY | 4.0 | 2.5 | 2658 | $6,000 | $2.26 | 1d | 1 | 1.39mi |
Listing history 14 events
-
2026-06-18days on market $925,000 Active 70 DOM
-
2026-06-17days on market $925,000 Active 69 DOM
-
2026-06-16days on market $925,000 Active 68 DOM
-
2026-06-15days on market $925,000 Active 67 DOM
-
2026-06-13days on market $925,000 Active 65 DOM
-
2026-06-12days on market $925,000 Active 64 DOM
-
2026-06-09days on market $925,000 Active 61 DOM
-
2026-06-08days on market $925,000 Active 60 DOM
-
2026-06-07days on market $925,000 Active 59 DOM
-
2026-06-04days on market $925,000 Active 55 DOM
-
2026-06-02days on market $925,000 Active 54 DOM
-
2026-06-01days on market $925,000 Active 53 DOM
-
2026-05-31days on market $925,000 Active 52 DOM
-
2026-04-01$925,000 Active 926-char remark
Show marketing remark (926 chars)
CASH ONLY BUYERS — SHOWINGS BY APPOINTMENT ONLY Spacious multi level home featuring a comfortable first floor layout with a living room, kitchen, and dining room, plus stair access to both upper and lower levels. Lower Level: • Large den • Laundry room • Boiler/utility room • Bonus bar room with pool table Upper Level: • Primary bedroom with full en suite bath • Two additional bedrooms and a second full bath • Upper-level addition includes an extra bedroom with walk in closet and a bonus den/flex room Outdoor Features: • Inground 20’ x 40’ gunite pool, recently updated with new coping, tile, electrical, and surrounding pavers • New 13’ x 15’ gazebo • Garage plus two driveways • Additional gated space for a boat or extra vehicle This property offers plenty of space, great bonus areas, and strong potential for the right cash buyer
ⓘ Source: listings_history table (triggers on properties + properties_extension) + one-shot
backfill from property_details.listing_events for pre-trigger history.
Tax reassessment forecast NY · Partial reset (capped growth)
- Current annual tax
- $9,827 · $819/mo
- Projected year-2 tax
- $12,730 · $1,061/mo
- Expected delta
- +$2,903/yr (+$242/mo · 29.5%)
ⓘ Screening estimate from a state-policy table — verify with the county assessor before closing.
Climate risk First Street
- Flood 6/10 Major FEMA zone X (unshaded) · 54% chance over 30 yrs
- Wildfire 3/10 Moderate
- Heat 5/10 Major 7 d/yr ≥94°F today · 16 d/yr by 30 yrs out
- Wind 6/10 Major 71% chance of damaging wind over 30 yrs
- Air quality 4/10 Moderate 3 unhealthy d/yr today · 5 by 30 yrs out
Nearby sold comps map
Loading sold comps map…
Walkable amenities ~0.75 mi
Loading nearby amenities…
Taxation est. · year 1
- Rental income
- $72,000
- − Mortgage interest
- −$51,814
- − Property taxes
- −$9,827
- − Insurance
- −$4,625
- − Repairs & maintenance
- −$5,760
- − Management
- −$5,760
- − Depreciation
- −$26,909
- Taxable loss
- −$32,696
- Est. tax savings @ 24.0%
- +$7,847
- After-tax cash flow
- $-7,935/yr
For passive investors: Depreciation is non-cash, so a rental often shows a tax loss while cash-flowing — sheltering income. Rental losses are passive: they offset passive income freely, and up to $25,000/yr can offset ordinary (W-2) income if you actively participate and your MAGI is under $100k (phasing out to $0 by $150k); unused losses carry forward. On sale, claimed depreciation is recaptured at up to 25%, and gains may owe capital-gains tax (a 1031 exchange can defer both). Figures are a year-1 estimate at your 24.0% rate — not tax advice; consult a CPA.
Schools (NCES district)
- District
- Massapequa Union Free School District
- NCES district ID
- 3618630
- Math proficiency
- 76% ▼ -3.00%
- Reading proficiency
- 83% ▲ 12.00%
- Median HH income
- $116,173
- Composite
- 73.55/100
- National rank
- #178
- State rank
- #39 of 590 in NY
Livability — Massapequa Park
- Score
- 82/100
- State rank
- #85
- US rank
- #1298
Category grades
Schools grade is shown separately in the Schools card above.
Census & demographics
- Census place
- Massapequa Park, NY
- City population
- 22,447
- Population (ZIP)
- 22,447
Population outlook (Nassau County) Hauer SSP2
- Today (2025)
- 1,409,302 people
- By 2030
- 1,431,482 · +1.6%
- By 2040
- 1,471,607 · +4.4%
- By 2050
- 1,502,845 · +6.6%
- By 2075
- 1,575,403 · +11.8%
- By 2100
- 1,554,356 · +10.3%
Race, ethnicity, and origin ACS 2023
- Neighborhood character
- Predominantly White (89%)
- Race & ethnicity
- White 89% Hispanic / Latino 5% Two or more races 5% Asian 2%
- Common ancestry
- Romanian 5% Scotch-Irish 2% Lithuanian 1%
- Foreign-born
- 4% · Canada
- Languages at home
- 95% English-only · Spanish 2% Other Indo-European 2%
Political lean MEDSL · Nassau
- 2024 margin
- Toss-up / Even · D 47.9% · R 52.1%
- 2008→2024 swing
- -12.6pp toward R · 2008: 8.4pp · 2024: -4.2pp
- All cycles
- 2024: R+4.2 2020: D+9.5 2016: D+5.3 2012: D+6.7 2008: D+8.4
Not yet ingested
- Civics
- —
Market trends
- HPI YoY
- ▼ -699.65%
- Current HPI
- 290.255
- Rent YoY
- —
- Metro
- —
- State GDP YoY
- ▲ 2.60%
- F500 in state
- 92
Industry mix (Fortune 500 HQ in NY)
| Industry | F500 HQs | Revenue |
|---|---|---|
| Financial Services | 10 | $950B |
|
||
| Consumer Goods | 9 | $162B |
|
||
| Insurance | 4 | $225B |
|
||
| Telecommunications | 2 | $144B |
|
||
| Pharmaceuticals | 2 | $112B |
|
||
| Media / Entertainment | 2 | $69B |
|
||
Price history
1 event — show timeline
- 2026-04-01 Listed $925,000 FSBO.com
Property tax history
-1.4%/yrLatest (2024): $9,827 · -50.5% YoY. Source: county tax records.
Cash-flow waterfall
monthlySold comps — $/sqft
last 12 mo · ≤1 miLoading sold comps…