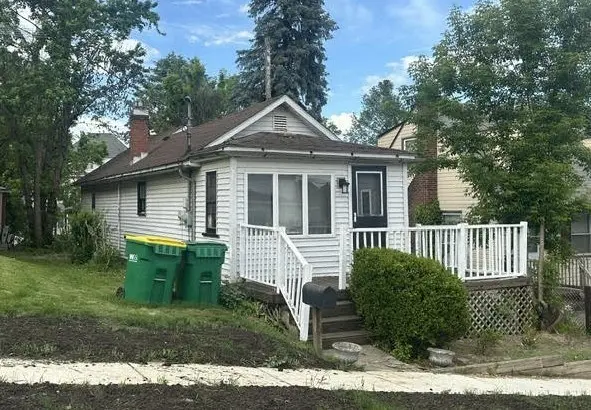
209 Penn Ave · Butler, PA
Flood risk 1/10 · Minimal
- FEMA flood zone
- X (unshaded)
- Chance of flooding over 30 yrs
- 0.0%
- Est. flood insurance / yr
- $473 – $860
Fire risk 1/10 · Minimal
- Est. fire insurance / yr
- $511 – $949
Heat risk 3/10 · Minor
- Hot days now (above 94°F)
- 7 days/yr
- Hot days in 30 yrs
- 18 days/yr
Wind risk 1/10 · Minimal
- Chance of severe wind over 30 yrs
- —
Air-quality risk 3/10 · Minor
- Unhealthy air days now
- 3 days/yr
- Unhealthy air days in 30 yrs
- 5 days/yr
Risk factors via First Street. Map © Google.
Why this score? — see what drove the C grade
The composite is a weighted blend of 9 inputs, each scored 0–100. Each bar is that input's sub-score; the figure is the points it added to the 100-point composite (weight × sub-score).
- Cash flow +21.5/30.0
- DSCR +6.9/10.0
- Appreciation +6.1/10.0
- ARV discount +5.8/15.0
- 1% rule +4.8/10.0
- Schools +4.3/10.0
- Livability +3.6/5.0
- Rent growth +2.5/5.0
- Condition / age +2.5/5.0
$89,900
🖨 Deal sheet 📄 Offer letter ✓ Due diligence
Listing remarks MLS
CHARMER INSIDE UPDATED NEWER KITCHEN LOTS OF WOODWORK -MUST SEE INSIDE - CONFIRM SHOW WITH OWNER - DOG
Key facts
- Two closets
- Walkout door
- Front porch
Tags
Property features AI
Exterior
- Parking: Off-street parking (1 space)
- Utilities: Public water; Public sewer
- Home design: Single-story; Resale property
- Construction: Vinyl siding; Asphalt roof
- Exterior features: 25 x 110 lot dimensions
Interior
- Kitchen: Stove; Refrigerator; Some gas appliances
- Bedrooms: Bedroom 2 on lower level; Total rooms: 7; Has basement
- Flooring: Hardwood; Vinyl
- Bathrooms: 1 full bathroom; 1 half bathroom
- Heating & cooling: Forced air heating (gas); Wall/window cooling units
- Interior features: Window treatments; Hardwood and vinyl flooring
- Laundry & utility: Washer; Dryer; Laundry room on lower level
Neighborhood map
What this means for you Summary
Snapshot
- This is a 2-bed/1.5-bath single-family listed at $90k.
Deal economics
- At list price, monthly cash flow is $135 ($2k/yr) — positive.
- The deal already cash-flows at list — no discount required.
- To meet the 1% rule (rent ≥ 1% of price), the offer needs to be $88k (1.6% below list).
- Recommended offer: $88k (1.6% below list) — sets the bar for 1% rule.
- Cap rate 8.1% vs local median 3.8% in Butler — top-decile yield for the area; either an underpriced asset or a hidden risk that comps aren't pricing in. Stress-test before assuming the spread holds.
Location & tenants
- Location reads 71/100 on livability (#705 in PA) — a middle-class / working-renter tenant base. Strengths: cost of living A+, health & safety A+, schools A-; Watch: crime D-, amenities F, commute F.
- Butler Area SD (town): math 41% / reading 59% proficiency, ranked #181 of 539 in PA (top 34%) — acceptable for families but not a draw, mixed tenant base, ~2y average lease.
- Market conditions: 11 active listings in the ZIP; 10 comparable units currently listed for rent nearby; rentals at typical pace (median 21d on market — plan ~3-4 weeks tenant-placement turnaround); 40% of comp listings sitting > 30 days — soft ceiling on asking rent; 987 units permitted in Butler County in 2024 (0 in 5+ unit buildings).
Forward outlook
- In year one you build about $3k of equity ($622 loan paydown + $2k appreciation (2.1% local appreciation)).
- Butler County population projected to shrink 5% by 2050 — rents likely to lag national; underwrite the cash flow, not the appreciation.
- At projected returns (2.1% appreciation + 3.0% rent growth), your $25k cash investment doubles in ~6 years — after that, you're playing with house money.
Negotiation context
- Only 14 days on market — expect competitive offers; lowballing is unlikely to land.
- 2 sale attempts since 24y ago with the ask held roughly flat each time — persistent listings suggest the price (not the market) is what's stuck; bring a comps-based counter.
- Current owner paid $59k; list at $90k implies a 52% gain — meaningful room to come down on a strong offer.
Questions for the listing agent
- Built in 1967 — when were the roof, HVAC, electrical panel, plumbing, and water heater last replaced?
- Is there a deadline driving the sale (1031 exchange, divorce, estate, relocation)? That informs how much negotiation room exists.
- Schools are A-rated — typically a magnet for longer-tenancy family renters. What's the average tenant stay here, and is there a school-zone premium baked into asking?
- Crime grade is D in this area — have there been break-ins, vandalism, or insurance claims at this property in the last 3 years? What carrier currently insures it and at what premium?
- What's the average days-on-market for RENTAL listings here right now (not sales)? A rising rental-DOM trend means longer vacancies and softer asking-rent achievability than the comps imply.
- What's the recent tenant-quality profile in this submarket — average credit score on applications, eviction rate, late-payment / NSF rate, and stable-employment percentage? A property-management company in the area should have these aggregated.
- How much new for-sale + rental construction is in the pipeline within 1–3 miles? Heavy new supply typically softens prices + rents 12–24 months out; constrained supply supports both.
Investment metrics
- 1% rule
- 0.98% ✗
- Cap rate
- 8.09%
- Cash-on-cash
- 6.42%
- DSCR
- 1.29
- GRM
- 8.5
CMA / ARV
- ARV (on-the-fly)
- $86,640
- Comps found
- 3
Show comp detail 3 sales within ~0.75 mi
| Address | Dist | Beds/Ba | Sqft | Sold | Price | $/sf | Match |
|---|---|---|---|---|---|---|---|
| 103 Whitestown Rd | 0.17mi | 2/2.0 | 722 (-5%) | 8mo | $82,250 | $114 | 75 |
| 157 Whitestown Rd | 0.23mi | 2/1.0 | 738 (-3%) | 11mo | $120,000 | $163 | 73 |
| 136 Whitestown Rd | 0.17mi | 2/1.0 | 840 (+10%) | 10mo | $60,000 | $71 | 64 |
Match score weights: distance 35% · size 25% · config 20% · recency 20%. Top-matched comps best support the ARV.
Projected returns pro-forma
2.12% appreciation · 3.0% rent growth · sell at horizon
- IRR
- 11.2%
- Equity multiple
- 1.61×
- Total profit
- $15,290
- Equity at exit
- $36,068
- IRR
- 14.0%
- Equity multiple
- 2.89×
- Total profit
- $47,676
- Equity at exit
- $52,411
Cash invested: $25,172 (down + closing). Projections, not guarantees.
Landlord ↔ Tenant lean methodology
- Overall (STATE)
- 62 Landlord-Friendly
- State Pennsylvania
- 62 Landlord-Friendly · EVEN
- County
- — inherits STATE
- City
- — inherits STATE
ZIP-level market 16045
- Home prices YoY
- 2.0%
- Active inventory
- 11
- Price-to-rent
- 8.5×
Monthly cashflow live
- Estimated rent
- $884 high interval (Pro) →
- Mortgage (P&I)
- −$471
- Tax from tax record
- −$55 /mo · $659/yr
- Insurance
- −$37
- HOA
- −$0
- Vacancy / Maint / Mgmt
- −$186
- Net cashflow
- $135
Break-even live
UW: 25.0% down · 7.5% · 30yr · 1.5% tax · 5.0% vac · 8.0% maint · 8.0% mgmt
Financing live
Cash to close
- Down payment
- $22,475
- Closing costs
- $2,697
- Reserves months
- —
- Total cash needed
- —
Loan-product check · same deal, 3 products live
Conventional
25% down · 7.5% · 30yr
- Down + closing
- —
- Monthly P&I
- —
- Monthly cashflow
- —
- DSCR
- —
- Eligible?
- —
Personal DTI + credit; lowest rate.
DSCR
20% down · 8.5% · 30yr
- Down + closing
- —
- Monthly P&I
- —
- Monthly cashflow
- —
- DSCR
- —
- Eligible?
- —
No personal income docs; deal must DSCR.
Hard money
10% down · 12.0% · 12mo
- Down + closing
- —
- Monthly P&I
- —
- Monthly cashflow
- —
- DSCR
- —
- Eligible?
- —
Short-term bridge; refi at stabilization.
Rent comps 10 comps
| Address | Beds | Baths | Sqft | Rent | $/sqft | DOM | Units | Dist |
|---|---|---|---|---|---|---|---|---|
| 17 Bessemer Ave Apt 10 Lyndora, PA | 1.0 | 1.0 | 525 | $750 | $1.43 | 4d | 1 | 0.14mi |
| 206 Litman Rd Butler, PA | 1.0–2.0 | 1.0 | 800 | $1,170 | $1.46 | 1d | 3 | 0.69mi |
| 305 American Ave Butler, PA | 2.0 | 1.0 | 986 | $995 | $1.01 | 43d | 1 | 1.00mi |
| 404 W Cunningham St Butler, PA | 2.0 | 1.0 | 800 | $850 | $1.06 | 43d | 1 | 1.07mi |
| 303 Wilson Ave Unit Wilson-313 Butler, PA | 3.0 | 1.0 | 894 | $1,005 | $1.12 | 16d | 1 | 1.17mi |
| 313 Wilson Ave Butler, PA | 3.0 | 1.0 | 894 | $1,005 | $1.12 | 16d | 1 | 1.19mi |
| 327 W Brady St Unit 2 Butler, PA | 2.0 | 1.0 | 900 | $850 | $0.94 | 21d | 1 | 1.24mi |
| 529 Federal St Unit 2 Butler, PA | 2.0 | 1.0 | 900 | $850 | $0.94 | 43d | 1 | 1.26mi |
| 139 Whitestown Vlg Unit B Butler, PA | 3.0 | 1.0 | 1000 | $1,100 | $1.10 | 3d | 1 | 1.35mi |
| 115 Spring St #1 Butler, PA | 2.0 | 1.0 | 800 | $800 | $1.00 | 43d | 1 | 1.46mi |
Listing history 10 events
-
2026-06-18days on market $89,900 Active 14 DOM
-
2026-06-17days on market $89,900 Active 13 DOM
-
2026-06-16days on market $89,900 Active 12 DOM
-
2026-06-15days on market $89,900 Active 11 DOM
-
2026-06-13days on market $89,900 Active 9 DOM
-
2026-06-13days on market $89,900 Active 8 DOM
-
2026-06-09days on market $89,900 Active 5 DOM
-
2026-06-08days on market $89,900 Active 4 DOM
-
2026-06-07remarks 699-char remark
-
2026-06-07$89,900 Active 3 DOM
ⓘ Source: listings_history table (triggers on properties + properties_extension) + one-shot
backfill from property_details.listing_events for pre-trigger history.
Tax reassessment forecast PA · Partial reset (capped growth)
- Current annual tax
- $659 · $55/mo
- Projected year-2 tax
- $1,040 · $87/mo
- Expected delta
- +$381/yr (+$32/mo · 57.7%)
ⓘ Screening estimate from a state-policy table — verify with the county assessor before closing.
Climate risk First Street
- Flood 1/10 Low FEMA zone X (unshaded) · 0% chance over 30 yrs
- Wildfire 1/10 Low
- Heat 3/10 Moderate 7 d/yr ≥94°F today · 18 d/yr by 30 yrs out
- Wind 1/10 Low
- Air quality 3/10 Moderate 3 unhealthy d/yr today · 5 by 30 yrs out
Nearby sold comps map
Loading sold comps map…
Walkable amenities ~0.75 mi
Loading nearby amenities…
Taxation est. · year 1
- Rental income
- $10,610
- − Mortgage interest
- −$5,036
- − Property taxes
- −$659
- − Insurance
- −$450
- − Repairs & maintenance
- −$849
- − Management
- −$849
- − Depreciation
- −$2,615
- Taxable income
- $152
- Est. tax owed @ 24.0%
- −$37
- After-tax cash flow
- $1,579/yr
For passive investors: Depreciation is non-cash, so a rental often shows a tax loss while cash-flowing — sheltering income. Rental losses are passive: they offset passive income freely, and up to $25,000/yr can offset ordinary (W-2) income if you actively participate and your MAGI is under $100k (phasing out to $0 by $150k); unused losses carry forward. On sale, claimed depreciation is recaptured at up to 25%, and gains may owe capital-gains tax (a 1031 exchange can defer both). Figures are a year-1 estimate at your 24.0% rate — not tax advice; consult a CPA.
Schools (NCES district)
- District
- Butler Area SD
- NCES district ID
- 4204590
- Math proficiency
- 41% ▼ -11.00%
- Reading proficiency
- 59% ▼ -10.00%
- Median HH income
- $49,348
- Composite
- 42.65/100
- National rank
- #3180
- State rank
- #181 of 539 in PA
Livability — Butler
- Score
- 71/100
- State rank
- #705
- US rank
- #6951
Category grades
Schools grade is shown separately in the Schools card above.
Census & demographics
- Census place
- Homeacre-Lyndora, PA
- City population
- 39,234
- Population (ZIP)
- 1,109
Population outlook (Butler County) Hauer SSP2
- Today (2025)
- 190,777 people
- By 2030
- 191,476 · +0.4%
- By 2040
- 189,474 · -0.7%
- By 2050
- 182,050 · -4.6%
- By 2075
- 159,526 · -16.4%
- By 2100
- 129,028 · -32.4%
Race, ethnicity, and origin ACS 2023
- Neighborhood character
- Predominantly White (95%)
- Race & ethnicity
- White 95% Black 4% Two or more races 1%
- Common ancestry
- Romanian 25% Lithuanian 10% Italian 4%
Political lean MEDSL · Butler
- 2024 margin
- Solid R (+32.2) · D 33.5% · R 65.7%
- 2008→2024 swing
- -4.8pp toward R · 2008: -27.4pp · 2024: -32.2pp
- All cycles
- 2024: R+32.2 2020: R+32.5 2016: R+37.5 2012: R+34.9 2008: R+27.4
Not yet ingested
- Civics
- —
Market trends
- HPI YoY
- ▲ 2.12%
- Current HPI
- 108.3087
- Rent YoY
- —
- Metro
- —
- State GDP YoY
- ▲ 1.68%
- F500 in state
- 34
Industry mix (Fortune 500 HQ in PA)
| Industry | F500 HQs | Revenue |
|---|---|---|
| Healthcare | 2 | $309B |
|
||
| Insurance | 2 | $27B |
|
||
| Telecommunications / Media | 1 | $124B |
|
||
| Industrial Distribution | 1 | $22B |
|
||
| Financial Services | 1 | $20B |
|
||
| Chemicals / Materials | 1 | $18B |
|
||
Price history
+49.8% since first listed4 events — show timeline
- 2026-06-03 Listed $89,900 West Penn MLS
- 2002-08-14 Sold (Public Records) $59,000 Public Records
- 2002-08-09 Sold (MLS) $59,000 West Penn MLS
- 2002-06-06 Listed $60,000 West Penn MLS
Property tax history
+1.2%/yrLatest (2026): $659 · +0.0% YoY. Source: county tax records.
Cash-flow waterfall
monthlySold comps — $/sqft
last 12 mo · ≤1 miLoading sold comps…