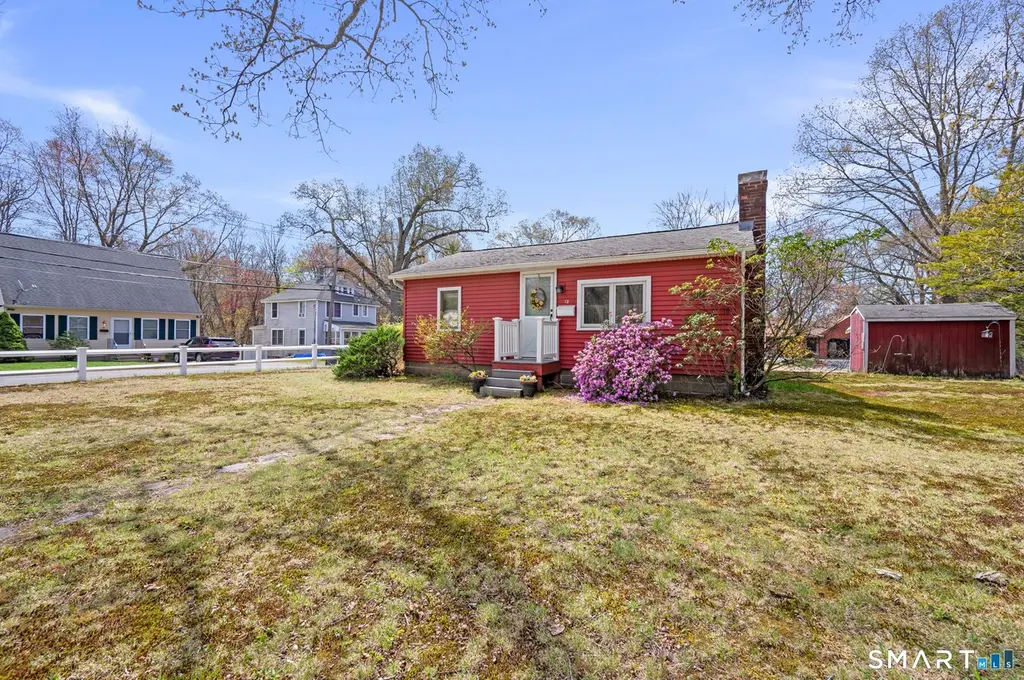
12 Booth Rd · Longmeadow, MA
Flood risk 1/10 · Minimal
- FEMA flood zone
- X (unshaded)
- Chance of flooding over 30 yrs
- 0.0%
- Est. flood insurance / yr
- $473 – $860
Fire risk 2/10 · Minimal
- Est. fire insurance / yr
- $829 – $1,539
Heat risk 4/10 · Minor
- Hot days now (above 98°F)
- 7 days/yr
- Hot days in 30 yrs
- 15 days/yr
Wind risk 6/10 · Moderate
- Chance of severe wind over 30 yrs
- 27.0%
Air-quality risk 3/10 · Minor
- Unhealthy air days now
- 2 days/yr
- Unhealthy air days in 30 yrs
- 3 days/yr
Risk factors via First Street. Map © Google.
Why this score? — see what drove the D+ grade
The composite is a weighted blend of 9 inputs, each scored 0–100. Each bar is that input's sub-score; the figure is the points it added to the 100-point composite (weight × sub-score).
- ARV discount +15.0/15.0
- Cash flow +13.6/30.0
- 1% rule +4.1/10.0
- DSCR +4.1/10.0
- Livability +4.0/5.0
- Rent growth +3.5/5.0
- Schools +3.0/10.0
- Condition / age +2.5/5.0
- Appreciation +0.0/10.0
$229,900
🖨 Deal sheet (PDF) 📄 Offer letter ✓ Due diligence
Listing remarks
* * * Multiple offers in. Highest, best, and final due Monday, May 4, at noon. Thank you! * * * Affordability without sacrificing condition, comfort, or location! Clean, meticulously cared for, and located on the corner of a quiet residential street in Enfield near the Massachusetts line, this 2-bed, 1-bath, move-in-ready, well-maintained, 880-square-foot ranch home proves you don't need huge square footage to live comfortably! Kitchen with a warm, functional layout with solid wood cabinets, plenty of storage, large pullout chopping board, and new refrigerator. Lots of natural custom pinewood details, newer Corinthian bathroom counter, and a spacious primary bedroom with plenty of room
Key facts
- Solid wood cabinets
- Plenty of storage
- New refrigerator
Tags
Property features AI
Finance
- Financial info: Assessed value $114,800
Exterior
- Utilities: Public water connected; Public sewer connected; Fuel tank located in the basement
- Home design: Single-family home
- Construction: Frame construction; Concrete foundation; Built (year not provided)
- Exterior features: Corner lot; Level lot; Vinyl siding; Asphalt shingle roof
Interior
- Kitchen: Oven/Range; Microwave; Refrigerator; Freezer; Dishwasher; Garbage disposal
- Bedrooms: 2 bedrooms
- Bathrooms: 1 full bathroom
- Heating & cooling: Hot air heat powered by oil; Oil hot water system
- Interior features: Full basement; One fireplace; Total of 4 rooms
- Laundry & utility: Washer and dryer included; Laundry located in the basement / lower level
Neighborhood map
What this means for you Summary
Snapshot
- This is a 2-bed/1.0-bath single-family listed at $230k.
Deal economics
- At list price, monthly cash flow is $13 ($153/yr) — positive.
- The deal already cash-flows at list — no discount required.
- To meet the 1% rule (rent ≥ 1% of price), the offer needs to be $208k (9.4% below list).
- Recommended offer: $208k (9.4% below list) — sets the bar for 1% rule.
- Cap rate 6.4% vs local median 3.6% in Longmeadow — top-decile yield for the area; either an underpriced asset or a hidden risk that comps aren't pricing in. Stress-test before assuming the spread holds.
Location & tenants
- Location reads 80/100 on livability (#38 in MA, #1,837 nationally) — a professional / high-income tenant draw. Strengths: schools A+, crime A+, commute A+; Watch: amenities F, cost of living F.
- Enfield School District (suburban): math 25% / reading 41% proficiency, ranked #114 of 153 in CT (top 74%) — families likely to look elsewhere, expect single-tenant / working-renter base with shorter leases.
- Market conditions: Rents rising (+3.9%/yr); 1 comparable units currently listed for rent nearby; solid renter incomes; 1,867 units permitted in Capitol Planning Region in 2024 (1,399 in 5+ unit buildings).
Forward outlook
- Local home prices are declining (-3.0%/yr); year-one equity from $2k of loan paydown is wiped out by about $7k of value loss. Plan a longer hold.
Negotiation context
- Only 11 days on market — expect competitive offers; lowballing is unlikely to land.
Risks & watch-outs
- Watch-outs: built in 1950 — expect roof / HVAC / electrical / plumbing capex.
- Climate carrying-cost: major wind risk, 27% chance of damaging wind over 30y — expect insurance premiums to compound above CPI over the hold.
Questions for the listing agent
- Built in 1950 — when were the roof, HVAC, electrical panel, plumbing, and water heater last replaced?
- Is there a deadline driving the sale (1031 exchange, divorce, estate, relocation)? That informs how much negotiation room exists.
- Schools are A-rated — typically a magnet for longer-tenancy family renters. What's the average tenant stay here, and is there a school-zone premium baked into asking?
- The area grade is low — what's the realistic commute time and amenity access for the typical tenant pool here? Any planned neighborhood developments (good or bad) we should know about?
- What's the average days-on-market for RENTAL listings here right now (not sales)? A rising rental-DOM trend means longer vacancies and softer asking-rent achievability than the comps imply.
- What's the recent tenant-quality profile in this submarket — average credit score on applications, eviction rate, late-payment / NSF rate, and stable-employment percentage? A property-management company in the area should have these aggregated.
- How much new for-sale + rental construction is in the pipeline within 1–3 miles? Heavy new supply typically softens prices + rents 12–24 months out; constrained supply supports both.
Investment metrics
- 1% rule
- 0.91% ✗
- Cap rate
- 6.36%
- Cash-on-cash
- 0.24%
- DSCR
- 1.01
- GRM
- 9.2
CMA / ARV
- ARV (median comp)
- $295,837
- List price
- $229,900
- Delta
- -22.29%
- Verdict
- UNDERPRICED
- Comps
- 20 within 1.0 mi
Show comp detail 12 sales within ~0.75 mi
| Address | Dist | Beds/Ba | Sqft | Sold | Price | $/sf | Match |
|---|---|---|---|---|---|---|---|
| 11 Willard Ave | 0.16mi | 2/1.0 | 860 (-2%) | 3mo | $240,000 | $279 | 86 |
| 4 Sword Ave | 0.23mi | 2/1.5 | 875 (-1%) | 15mo | $275,000 | $314 | 74 |
| 43 Sword Ave | 0.44mi | 2/1.0 | 970 (+10%) | 8mo | $270,000 | $278 | 56 |
| 79 Roosevelt Blvd | 0.45mi | 3/1.0 (+1) | 1,008 (+14%) | 3mo | $313,000 | $311 | 48 |
| 15 Booth St | 0.39mi | 3/2.0 (+1) | 1,008 (+14%) | 5mo | $320,000 | $317 | 44 |
| 10 Nevins Ave | 0.62mi | 3/1.0 (+1) | 1,008 (+14%) | 0mo | $315,000 | $313 | 41 |
| 30 Alban Rd | 0.64mi | 3/1.0 (+1) | 1,008 (+14%) | 5mo | $314,000 | $312 | 36 |
| 18 Marble Rd | 0.56mi | 3/1.0 (+1) | 1,008 (+14%) | 11mo | $265,000 | $263 | 36 |
| 13 Lancer Dr | 0.65mi | 3/1.0 (+1) | 1,008 (+14%) | 12mo | $325,000 | $322 | 30 |
| 10 Garnet Rd | 0.54mi | 3/1.0 (+1) | 1,008 (+14%) | 21mo | $331,000 | $328 | 28 |
| 23 Lancer Dr | 0.61mi | 3/1.0 (+1) | 1,008 (+14%) | 22mo | $295,000 | $293 | 24 |
| 3 Phyllis St | 0.68mi | 3/1.0 (+1) | 1,008 (+14%) | 22mo | $283,000 | $281 | 20 |
Match score weights: distance 35% · size 25% · config 20% · recency 20%. Top-matched comps best support the ARV.
Projected returns pro-forma
-3.0% appreciation · 3.9% rent growth · sell at horizon
- IRR
- -14.9%
- Equity multiple
- 0.46×
- Total profit
- $-34,479
- Equity at exit
- $34,279
- IRR
- -4.7%
- Equity multiple
- 0.68×
- Total profit
- $-20,785
- Equity at exit
- $19,878
Cash invested: $64,372 (down + closing). Projections, not guarantees.
Landlord ↔ Tenant lean methodology
- Overall (STATE)
- 20 Strongly Tenant-Friendly
- State Massachusetts
- 20 Strongly Tenant-Friendly · D+15
- County
- — inherits STATE
- City
- — inherits STATE
ZIP-level market 06082
- Rents YoY
- 3.9%
- Price-to-rent
- 9.2×
Monthly cashflow live
- Estimated rent
- $2,083 medium interval (Pro) →
- Mortgage (P&I)
- −$1,206
- Tax from tax record
- −$332 /mo · $3,978/yr
- Insurance
- −$96
- HOA
- −$0
- Vacancy / Maint / Mgmt
- −$437
- Net cashflow
- $13
Break-even live
Sensitivity live
| Price | -10% $143 | -5% $78 | +0% $13 | +5% $-52 | +10% $-117 |
|---|---|---|---|---|---|
| Rent | -10% $-152 | -5% $-70 | +0% $13 | +5% $95 | +10% $177 |
| Rate | -1.0pp $129 | -0.5pp $71 | base $13 | +0.5pp $-47 | +1.0pp $-107 |
UW: 25.0% down · 7.5% · 30yr · 1.5% tax · 5.0% vac · 8.0% maint · 8.0% mgmt
Financing live
Cash to close
- Down payment
- $57,475
- Closing costs
- $6,897
- Reserves months
- —
- Total cash needed
- —
Loan-product check · same deal, 3 products live
Conventional
25% down · 7.5% · 30yr
- Down + closing
- —
- Monthly P&I
- —
- Monthly cashflow
- —
- DSCR
- —
- Eligible?
- —
Personal DTI + credit; lowest rate.
DSCR
20% down · 8.5% · 30yr
- Down + closing
- —
- Monthly P&I
- —
- Monthly cashflow
- —
- DSCR
- —
- Eligible?
- —
No personal income docs; deal must DSCR.
Hard money
10% down · 12.0% · 12mo
- Down + closing
- —
- Monthly P&I
- —
- Monthly cashflow
- —
- DSCR
- —
- Eligible?
- —
Short-term bridge; refi at stabilization.
Rent comps 1 comps
| Address | Beds | Baths | Sqft | Rent | $/sqft | DOM | Units | Dist |
|---|---|---|---|---|---|---|---|---|
| 62 Till St Enfield, CT | 3.0 | 1.0 | 1008 | $2,800 | $2.78 | 24d | 1 | 0.69mi |
Listing history 2 events
-
2026-05-04status Under Contract 1486-char remark
-
2026-04-23$229,900 Active 1486-char remark
ⓘ Source: listings_history table (triggers on properties + properties_extension) + one-shot
backfill from property_details.listing_events for pre-trigger history.
Tax reassessment forecast MA · Partial reset (capped growth)
- Current annual tax
- $3,978 · $332/mo
- Projected year-2 tax
- $3,978 · $332/mo
- Expected delta
- $0/yr ($0/mo · 0.0%)
ⓘ Screening estimate from a state-policy table — verify with the county assessor before closing.
Climate risk First Street
- Flood 1/10 Low FEMA zone X (unshaded) · 0% chance over 30 yrs
- Wildfire 2/10 Low
- Heat 4/10 Moderate 7 d/yr ≥98°F today · 15 d/yr by 30 yrs out
- Wind 6/10 Major 27% chance of damaging wind over 30 yrs
- Air quality 3/10 Moderate 2 unhealthy d/yr today · 3 by 30 yrs out
Nearby sold comps map
Loading sold comps map…
Walkable amenities ~0.75 mi
Loading nearby amenities…
Taxation est. · year 1
- Rental income
- $24,998
- − Mortgage interest
- −$12,878
- − Property taxes
- −$3,978
- − Insurance
- −$1,150
- − Repairs & maintenance
- −$2,000
- − Management
- −$2,000
- − Depreciation
- −$6,688
- Taxable loss
- −$3,696
- Est. tax savings @ 24.0%
- +$887
- After-tax cash flow
- $1,040/yr
For passive investors: Depreciation is non-cash, so a rental often shows a tax loss while cash-flowing — sheltering income. Rental losses are passive: they offset passive income freely, and up to $25,000/yr can offset ordinary (W-2) income if you actively participate and your MAGI is under $100k (phasing out to $0 by $150k); unused losses carry forward. On sale, claimed depreciation is recaptured at up to 25%, and gains may owe capital-gains tax (a 1031 exchange can defer both). Figures are a year-1 estimate at your 24.0% rate — not tax advice; consult a CPA.
Schools (NCES district)
- District
- Enfield School District
- NCES district ID
- 0901470
- Math proficiency
- 25% ▼ -14.00%
- Reading proficiency
- 41% ▼ -10.00%
- Median HH income
- $68,750
- Composite
- 30.42/100
- National rank
- #6238
- State rank
- #114 of 153 in CT
Livability — Longmeadow
- Score
- 80/100
- State rank
- #38
- US rank
- #1837
Category grades
Schools grade is shown separately in the Schools card above.
Census & demographics
- County
- Hartford County
- City population
- 15,961
- Metro
- Hartford-East Hartford-Middletown, CT
- Population (ZIP)
- 41,090
- Household income
- $90,404
- Rent vs Own
- Severe rent burden
- 954.0
Population outlook (Capitol County) Hauer SSP2
- By 2040
- 1,063,519
Race, ethnicity, and origin ACS 2023
- Neighborhood character
- Predominantly White (76%)
- Race & ethnicity
- White 76% Hispanic / Latino 11% Two or more races 9% Black 5% Asian 2%
- Hispanic origin (detail)
- Mexican 1% Puerto Rican 7%
- Common ancestry
- Romanian 10% Lithuanian 9% Slovak 2%
- Foreign-born
- 6% · Canada, Jamaica
- Languages at home
- 89% English-only · Spanish 5% Other Indo-European 2% Russian/Polish/Slavic 1%
Political lean MEDSL · Capitol
- 2024 margin
- Strong D (+21.9) · D 60.1% · R 38.2% · Other 1.7%
- All cycles
- 2024: D+21.9
Not yet ingested
- Civics
- —
Market trends
- HPI YoY
- ▼ -494.72%
- Current HPI
- 192.4011
- Rent YoY
- ▲ 3.90%
- Metro
- Hartford-East Hartford-Middletown, CT
- State GDP YoY
- ▲ 2.28%
- F500 in state
- 38
Industry mix (Fortune 500 HQ in MA)
| Industry | F500 HQs | Revenue |
|---|---|---|
| Technology | 3 | $17B |
|
||
| Insurance | 2 | $84B |
|
||
| Retail | 2 | $76B |
|
||
| Life Sciences | 1 | $43B |
|
||
| Energy Technology | 1 | $31B |
|
||
| Aerospace / Defense | 1 | $18B |
|
||
Price history
2 events — show timeline
- 2026-05-04 Pending — Smart MLS
- 2026-04-23 Listed $229,900 Smart MLS
Property tax history
+2.2%/yrLatest (2025): $3,978 · +2.5% YoY. Source: county tax records.
Cash-flow waterfall
monthlySold comps — $/sqft
last 12 mo · ≤1 miLoading sold comps…