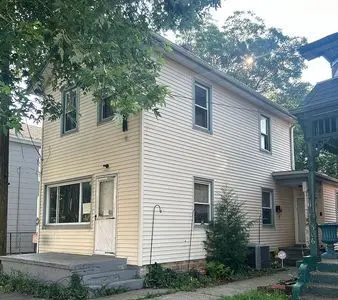
310 N 6th St · Hamilton, OH
Flood risk 1/10 · Minimal
- FEMA flood zone
- X (unshaded)
- Chance of flooding over 30 yrs
- 0.0%
- Est. flood insurance / yr
- $473 – $860
Fire risk 1/10 · Minimal
- Est. fire insurance / yr
- $713 – $1,323
Heat risk 4/10 · Minor
- Hot days now (above 103°F)
- 7 days/yr
- Hot days in 30 yrs
- 19 days/yr
Wind risk 2/10 · Minimal
- Chance of severe wind over 30 yrs
- 1.0%
Air-quality risk 3/10 · Minor
- Unhealthy air days now
- 2 days/yr
- Unhealthy air days in 30 yrs
- 3 days/yr
Risk factors via First Street. Map © Google.
Why this score? — see what drove the D+ grade
The composite is a weighted blend of 9 inputs, each scored 0–100. Each bar is that input's sub-score; the figure is the points it added to the 100-point composite (weight × sub-score).
- Cash flow +16.7/30.0
- ARV discount +10.5/15.0
- DSCR +5.2/10.0
- Livability +3.7/5.0
- Schools +3.6/10.0
- 1% rule +3.3/10.0
- Rent growth +3.2/5.0
- Condition / age +2.5/5.0
- Appreciation +0.0/10.0
$165,000
🖨 Deal sheet 📄 Offer letter ✓ Due diligence
Listing remarks MLS
Great rehab opportunity.Lender owned.As-Is Sale.MLS info deemed reliable,not guaranteed.Buyer rely on own inspections.Seller addendum executed after agreement.
Key facts
- Built 1905
- Listed 23 days
Neighborhood map
What this means for you Summary
Snapshot
- This is a 2-bed/1.5-bath single-family listed at $165k.
Deal economics
- At list price, monthly cash flow is $103 ($1k/yr) — positive.
- The deal already cash-flows at list — no discount required.
- To meet the 1% rule (rent ≥ 1% of price), the offer needs to be $138k (16.5% below list).
- Recommended offer: $138k (16.5% below list) — sets the bar for 1% rule.
- Cap rate 7.0% vs local median 4.6% in Hamilton — top-decile yield for the area; either an underpriced asset or a hidden risk that comps aren't pricing in. Stress-test before assuming the spread holds.
Location & tenants
- Location reads 73/100 on livability (#332 in OH) — a middle-class / working-renter tenant base. Strengths: cost of living A+, housing A+, schools B; Watch: crime C-, amenities C-, employment D.
- Hamilton City (suburban): math 42% / reading 45% proficiency, ranked #517 of 656 in OH (top 79%) — families likely to look elsewhere, expect single-tenant / working-renter base with shorter leases; 63% free/reduced lunch — lower-income household profile, screen leases tightly.
- Market conditions: Rents rising (+3.0%/yr); 196 active listings in the ZIP; 25 comparable units currently listed for rent nearby; rentals leasing fast (median 7d on market — plan ~1-2 weeks tenant-placement turnaround); solid renter incomes; 1,163 units permitted in Butler County in 2024 (356 in 5+ unit buildings).
- This rent is only 18% of the median local income ($92k/yr) — well below the 30% rent-burden line; pricing power to push rent on renewal without tenant pushback.
Forward outlook
- Local home prices are declining (-3.0%/yr); year-one equity from $1k of loan paydown is wiped out by about $5k of value loss. Plan a longer hold.
Negotiation context
- It's been on market 23 days — a 2% lower offer ($163k) is reasonable based on typical stale-listing flexibility.
- 5 sale attempts since 23y ago with the ask held roughly flat each time — persistent listings suggest the price (not the market) is what's stuck; bring a comps-based counter.
- Current owner paid $8k; list at $165k implies a 2100% gain — meaningful room to come down on a strong offer.
Risks & watch-outs
- Watch-outs: built in 1905 — expect roof / HVAC / electrical / plumbing capex.
Questions for the listing agent
- Built in 1905 — when were the roof, HVAC, electrical panel, plumbing, and water heater last replaced?
- Is there a deadline driving the sale (1031 exchange, divorce, estate, relocation)? That informs how much negotiation room exists.
- Schools are B-rated — typically a magnet for longer-tenancy family renters. What's the average tenant stay here, and is there a school-zone premium baked into asking?
- The area grade is low — what's the realistic commute time and amenity access for the typical tenant pool here? Any planned neighborhood developments (good or bad) we should know about?
- What's the average days-on-market for RENTAL listings here right now (not sales)? A rising rental-DOM trend means longer vacancies and softer asking-rent achievability than the comps imply.
- What's the recent tenant-quality profile in this submarket — average credit score on applications, eviction rate, late-payment / NSF rate, and stable-employment percentage? A property-management company in the area should have these aggregated.
- How much new for-sale + rental construction is in the pipeline within 1–3 miles? Heavy new supply typically softens prices + rents 12–24 months out; constrained supply supports both.
Investment metrics
- 1% rule
- 0.83% ✗
- Cap rate
- 7.04%
- Cash-on-cash
- 2.68%
- DSCR
- 1.12
- GRM
- 10.0
CMA / ARV
- ARV (on-the-fly)
- $176,900
- Comps found
- 12
Show comp detail 12 sales within ~0.75 mi
| Address | Dist | Beds/Ba | Sqft | Sold | Price | $/sf | Match |
|---|---|---|---|---|---|---|---|
| 922 Vine St | 0.32mi | 3/2.5 (+1) | 1,256 (+3%) | 0mo | $215,000 | $171 | 71 |
| 307 N Eighth St | 0.14mi | 2/1.0 | 1,120 (-8%) | 11mo | $162,000 | $145 | 69 |
| 1017 Campbell Ave | 0.38mi | 2/1.5 | 1,260 (+3%) | 10mo | $195,000 | $155 | 68 |
| 827 Greenwood Ave | 0.21mi | 2/1.0 | 1,072 (-12%) | 1mo | $155,000 | $145 | 67 |
| 518 Vine St | 0.19mi | 3/1.0 (+1) | 1,332 (+9%) | 3mo | $105,000 | $79 | 66 |
| 842 Heaton St | 0.23mi | 3/1.5 (+1) | 1,400 (+15%) | 4mo | $108,750 | $78 | 56 |
| 1303 Campbell Ave | 0.64mi | 2/1.0 | 1,136 (-7%) | 2mo | $180,000 | $158 | 55 |
| 1019 Buckeye St | 0.36mi | 3/1.0 (+1) | 1,398 (+15%) | 8mo | $112,900 | $81 | 46 |
| 712 S Fourth St | 0.73mi | 3/2.0 (+1) | 1,320 (+8%) | 2mo | $167,000 | $127 | 44 |
| 1103 Reservoir St | 0.47mi | 3/1.0 (+1) | 1,056 (-13%) | 7mo | $109,000 | $103 | 43 |
| 1416 Maple Ave | 0.75mi | 2/1.0 | 1,120 (-8%) | 8mo | $175,000 | $156 | 42 |
| 1161 Heaton St | 0.49mi | 3/1.0 (+1) | 1,050 (-14%) | 11mo | $163,000 | $155 | 38 |
Match score weights: distance 35% · size 25% · config 20% · recency 20%. Top-matched comps best support the ARV.
Projected returns pro-forma
-3.0% appreciation · 2.95% rent growth · sell at horizon
- IRR
- -12.2%
- Equity multiple
- 0.56×
- Total profit
- $-20,315
- Equity at exit
- $24,602
- IRR
- -3.2%
- Equity multiple
- 0.79×
- Total profit
- $-9,823
- Equity at exit
- $14,266
Cash invested: $46,200 (down + closing). Projections, not guarantees.
Landlord ↔ Tenant lean methodology
- Overall (STATE)
- 73 Landlord-Friendly
- State Ohio
- 73 Landlord-Friendly · R+6
- County
- — inherits STATE
- City
- — inherits STATE
ZIP-level market 45011
- Rents YoY
- 3.0%
- Active inventory
- 196
- Price-to-rent
- 10.0×
Monthly cashflow live
- Estimated rent
- $1,378 high interval (Pro) →
- Mortgage (P&I)
- −$865
- Tax from tax record
- −$51 /mo · $615/yr
- Insurance
- −$69
- HOA
- −$0
- Vacancy / Maint / Mgmt
- −$289
- Net cashflow
- $103
Break-even live
UW: 25.0% down · 7.5% · 30yr · 1.5% tax · 5.0% vac · 8.0% maint · 8.0% mgmt
Financing live
Cash to close
- Down payment
- $41,250
- Closing costs
- $4,950
- Reserves months
- —
- Total cash needed
- —
Loan-product check · same deal, 3 products live
Conventional
25% down · 7.5% · 30yr
- Down + closing
- —
- Monthly P&I
- —
- Monthly cashflow
- —
- DSCR
- —
- Eligible?
- —
Personal DTI + credit; lowest rate.
DSCR
20% down · 8.5% · 30yr
- Down + closing
- —
- Monthly P&I
- —
- Monthly cashflow
- —
- DSCR
- —
- Eligible?
- —
No personal income docs; deal must DSCR.
Hard money
10% down · 12.0% · 12mo
- Down + closing
- —
- Monthly P&I
- —
- Monthly cashflow
- —
- DSCR
- —
- Eligible?
- —
Short-term bridge; refi at stabilization.
Rent comps 25 comps
| Address | Beds | Baths | Sqft | Rent | $/sqft | DOM | Units | Dist |
|---|---|---|---|---|---|---|---|---|
| 906 Vine St Hamilton, OH | 3.0 | 2.0 | 1152 | $1,250 | $1.09 | 19d | 1 | 0.32mi |
| 1025 Heaton St Hamilton, OH | 2.0 | 1.0 | 1436 | $1,025 | $0.71 | 23d | 1 | 0.36mi |
| 829 Maple Ave Unit 3 Hamilton, OH | 3.0 | 1.0 | 1097 | $945 | $0.86 | 43d | 1 | 0.39mi |
| 829 Maple Ave Apt 1 Hamilton, OH | 1.0 | 1.0 | 731 | $755 | $1.03 | 23d | 1 | 0.39mi |
| 115 Dayton St Unit MAR-201 Hamilton, OH | 2.0 | 2.0 | 1040 | $1,775 | $1.71 | 4d | 1 | 0.44mi |
| 513 S 3rd St Unit 513 Hamilton, OH | 1.0 | 1.0 | 1000 | $850 | $0.85 | 10d | 1 | 0.68mi |
| 316 Main St Unit ROS-320 Hamilton, OH | 1.0 | 1.0 | 726 | $1,425 | $1.96 | 1d | 1 | 0.86mi |
| 316 Main St Unit ROS-113 Hamilton, OH | 1.0 | 1.0 | 800 | $1,350 | $1.69 | 19d | 1 | 0.86mi |
| 432 Park Ave Hamilton, OH | 3.0 | 1.0 | 1276 | $1,300 | $1.02 | 2d | 1 | 0.94mi |
| 969 Harmon Ave Hamilton, OH | 3.0 | 1.0 | 1350 | $1,695 | $1.26 | 43d | 1 | 1.01mi |
| 417 Franklin St Hamilton, OH | 3.0 | 1.0 | 1256 | $1,150 | $0.92 | 1d | 1 | 1.03mi |
| 1719 Shirley Ave Hamilton, OH | 3.0 | 1.0 | 1135 | $1,525 | $1.34 | 1d | 1 | 1.04mi |
| 967 Shuler Ave Hamilton, OH | 3.0 | 2.0 | 1466 | $1,795 | $1.22 | 43d | 1 | 1.05mi |
| 547 Rhea Ave Hamilton, OH | 3.0 | 2.5 | 1412 | $2,300 | $1.63 | 43d | 1 | 1.17mi |
| 901 Cleveland Ave Hamilton, OH | 3.0 | 1.5 | 1133 | $2,250 | $1.99 | 1d | 1 | 1.22mi |
| 217 Eaton Ave Unit Down Hamilton, OH | 1.0 | 1.0 | 1128 | $975 | $0.86 | 2d | 1 | 1.24mi |
| 221 Eaton Ave Unit Up Hamilton, OH | 2.0 | 1.0 | 750 | $1,100 | $1.47 | 2d | 1 | 1.24mi |
| 661 Franklin St Unit Up Hamilton, OH | 1.0 | 1.0 | 700 | $1,000 | $1.43 | 2d | 1 | 1.27mi |
| 350 Vista Dr Unit 2 Hamilton, OH | 1.0 | 1.0 | 700 | $875 | $1.25 | 1d | 1 | 1.34mi |
| 350 Vista Dr Apt 1 Hamilton, OH | 1.0 | 1.0 | 700 | $900 | $1.29 | 43d | 1 | 1.34mi |
| 1310 Shuler Ave Unit 2 Hamilton, OH | 2.0 | 1.0 | 976 | $895 | $0.92 | 23d | 1 | 1.35mi |
| 1118 Bonacker Ave Unit 1116 Hamilton, OH | 2.0 | 1.0 | 1000 | $1,195 | $1.20 | 43d | 1 | 1.35mi |
| 358 Hampshire Dr Hamilton, OH | 1.0–2.0 | 1.0 | 687 | $1,250 | $1.82 | 1d | 23 | 1.46mi |
| 358 Hampshire Dr Unit 1FNA-49401 Hamilton, OH | 2.0 | 1.0 | 788 | $1,200 | $1.52 | 7d | 1 | 1.46mi |
| 1344 Carriage Hill Ln Hamilton, OH | 1.0–2.0 | 1.0 | 730 | $1,204 | $1.65 | 1d | 6 | 1.48mi |
Listing history 22 events
-
2026-06-18days on market $165,000 Active 23 DOM
-
2026-06-17days on market $165,000 Active 22 DOM
-
2026-06-16days on market $165,000 Active 21 DOM
-
2026-06-15days on market $165,000 Active 20 DOM
-
2026-06-13days on market $165,000 Active 18 DOM
-
2026-06-13days on market $165,000 Active 17 DOM
-
2026-06-09days on market $165,000 Active 14 DOM
-
2026-06-08days on market $165,000 Active 13 DOM
-
2026-06-07days on market $165,000 Active 12 DOM
-
2026-06-03days on market $165,000 Active 8 DOM
-
2026-06-02days on market $165,000 Active 7 DOM
-
2026-06-01days on market $165,000 Active 6 DOM
-
2026-05-31days on market $165,000 Active 5 DOM
-
2026-05-26$165,000 Active
-
2012-02-13soldstatus $7,500 159-char remark
Show marketing remark (159 chars)
Great rehab opportunity.Lender owned.As-Is Sale.MLS info deemed reliable,not guaranteed.Buyer rely on own inspections.Seller addendum executed after agreement.
-
2011-10-31$9,900 159-char remark
Show marketing remark (159 chars)
Great rehab opportunity.Lender owned.As-Is Sale.MLS info deemed reliable,not guaranteed.Buyer rely on own inspections.Seller addendum executed after agreement.
-
2010-08-26historical
-
2010-02-26$19,900
-
2009-11-05historical
-
2009-05-04$34,900
-
2003-08-26historical
-
2003-03-24$54,900
ⓘ Source: listings_history table (triggers on properties + properties_extension) + one-shot
backfill from property_details.listing_events for pre-trigger history.
Tax reassessment forecast OH · Partial reset (capped growth)
- Current annual tax
- $615 · $51/mo
- Projected year-2 tax
- $1,595 · $133/mo
- Expected delta
- +$979/yr (+$82/mo · 159.2%)
ⓘ Screening estimate from a state-policy table — verify with the county assessor before closing.
Climate risk First Street
- Flood 1/10 Low FEMA zone X (unshaded) · 0% chance over 30 yrs
- Wildfire 1/10 Low
- Heat 4/10 Moderate 7 d/yr ≥103°F today · 19 d/yr by 30 yrs out
- Wind 2/10 Low 100% chance of damaging wind over 30 yrs
- Air quality 3/10 Moderate 2 unhealthy d/yr today · 3 by 30 yrs out
Nearby sold comps map
Loading sold comps map…
Walkable amenities ~0.75 mi
Loading nearby amenities…
Taxation est. · year 1
- Rental income
- $16,532
- − Mortgage interest
- −$9,243
- − Property taxes
- −$615
- − Insurance
- −$825
- − Repairs & maintenance
- −$1,323
- − Management
- −$1,323
- − Depreciation
- −$4,800
- Taxable loss
- −$1,596
- Est. tax savings @ 24.0%
- +$383
- After-tax cash flow
- $1,620/yr
For passive investors: Depreciation is non-cash, so a rental often shows a tax loss while cash-flowing — sheltering income. Rental losses are passive: they offset passive income freely, and up to $25,000/yr can offset ordinary (W-2) income if you actively participate and your MAGI is under $100k (phasing out to $0 by $150k); unused losses carry forward. On sale, claimed depreciation is recaptured at up to 25%, and gains may owe capital-gains tax (a 1031 exchange can defer both). Figures are a year-1 estimate at your 24.0% rate — not tax advice; consult a CPA.
Schools (NCES district)
- District
- Hamilton City
- NCES district ID
- 3904410
- Math proficiency
- 42% ▼ -13.00%
- Reading proficiency
- 45% ▼ -10.00%
- Median HH income
- $40,488
- Composite
- 36.48/100
- National rank
- #4656
- State rank
- #517 of 656 in OH
Livability — Hamilton
- Score
- 73/100
- State rank
- #332
- US rank
- #5467
Category grades
Schools grade is shown separately in the Schools card above.
Census & demographics
- Census place
- Hamilton, OH
- County
- Butler County · 381,674 people
- City population
- 140,900
- Metro
- Cincinnati, OH-KY-IN
- Population (ZIP)
- 75,864
- Household income
- $91,873
- Rent vs Own
- Severe rent burden
- 1795.0
Population outlook (Butler County) Hauer SSP2
- Today (2025)
- 387,706 people
- By 2030
- 392,028 · +1.1%
- By 2040
- 395,307 · +2.0%
- By 2050
- 391,116 · +0.9%
- By 2075
- 378,642 · -2.3%
- By 2100
- 343,248 · -11.5%
Race, ethnicity, and origin ACS 2023
- Neighborhood character
- Predominantly White (68%)
- Race & ethnicity
- White 68% Hispanic / Latino 12% Black 11% Two or more races 9% Asian 4%
- Hispanic origin (detail)
- Mexican 7%
- Common ancestry
- Romanian 2% Italian 2% Slovak 2%
- Foreign-born
- 11% · Canada, Vietnam, China
- Languages at home
- 86% English-only · Spanish 8% Other Indo-European 2% Vietnamese 1%
Political lean MEDSL · Butler
- 2024 margin
- Strong R (+26.3) · D 36.4% · R 62.7%
- 2008→2024 swing
- -3.6pp toward R · 2008: -22.6pp · 2024: -26.3pp
- All cycles
- 2024: R+26.3 2020: R+24.0 2016: R+28.3 2012: R+26.2 2008: R+22.6
Not yet ingested
- Civics
- —
Market trends
- HPI YoY
- ▼ -188.67%
- Current HPI
- 259.7868
- Rent YoY
- ▲ 2.95%
- Metro
- Cincinnati, OH-KY-IN
- State GDP YoY
- ▲ 1.98%
- F500 in state
- 48
Industry mix (Fortune 500 HQ in OH)
| Industry | F500 HQs | Revenue |
|---|---|---|
| Insurance | 3 | $145B |
|
||
| Industrial Machinery | 3 | $49B |
|
||
| Financial Services | 3 | $24B |
|
||
| Consumer Goods | 2 | $93B |
|
||
| Aerospace / Defense | 2 | $47B |
|
||
| Utilities | 2 | $33B |
|
||
Price history
+200.5% since first listed9 events — show timeline
- 2026-05-26 Listed $165,000 FSBO.com
- 2012-02-13 Sold (MLS) $7,500 Cincy MLS
- 2011-10-31 Listed $9,900 Cincy MLS
- 2010-08-26 Listing Removed — Cincy MLS
- 2010-02-26 Listed $19,900 Cincy MLS
- 2009-11-05 Listing Removed — Cincy MLS
- 2009-05-04 Listed $34,900 Cincy MLS
- 2003-08-26 Listing Removed — Cincy MLS
- 2003-03-24 Listed $54,900 Cincy MLS
Property tax history
+5.8%/yrLatest (2025): $615 · +0.4% YoY. Source: county tax records.
Cash-flow waterfall
monthlySold comps — $/sqft
last 12 mo · ≤1 miLoading sold comps…