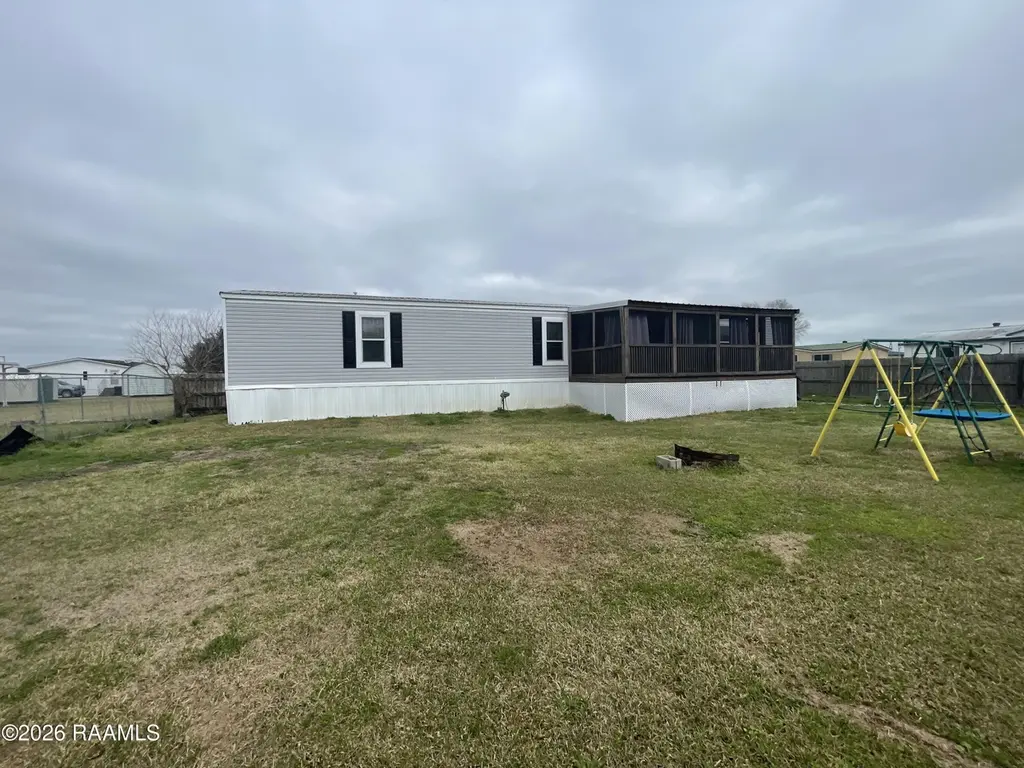
105 Windrose Ln · Youngsville, LA
Flood risk 8/10 · Major
- FEMA flood zone
- AE
- Chance of flooding over 30 yrs
- 0.99%
- Est. flood insurance / yr
- $1,737 – $8,500
Fire risk 1/10 · Minimal
- Est. fire insurance / yr
- $1,269 – $2,357
Heat risk 9/10 · Severe
- Hot days now (above 108°F)
- 7 days/yr
- Hot days in 30 yrs
- 21 days/yr
Wind risk 9/10 · Severe
- Chance of severe wind over 30 yrs
- 99.0%
Air-quality risk 1/10 · Minimal
- Unhealthy air days now
- 0 days/yr
- Unhealthy air days in 30 yrs
- 0 days/yr
Risk factors via First Street. Map © Google.
Why this score? — see what drove the B grade
The composite is a weighted blend of 9 inputs, each scored 0–100. Each bar is that input's sub-score; the figure is the points it added to the 100-point composite (weight × sub-score).
- Cash flow +30.0/30.0
- ARV discount +11.6/15.0
- DSCR +10.0/10.0
- 1% rule +9.6/10.0
- Livability +3.9/5.0
- Schools +3.6/10.0
- Rent growth +2.9/5.0
- Condition / age +2.5/5.0
- Appreciation +0.0/10.0
$134,000
🖨 Deal sheet 📄 Offer letter ✓ Due diligence
Listing remarks MLS
CASE# 221-317202 (IE) $275
Key facts
- Screened in porch
- Metal roof
- Fenced yard
Tags
Property features AI
Exterior
- Parking: Open parking
- Utilities: Public sewer; Electric service by Entergy
- Home design: Manufactured home; Paved road frontage
- Construction: Vinyl siding and frame construction; Metal roof
- Exterior features: Outdoor lighting; Covered, screened porch; Shed(s)
Interior
- Kitchen: Dishwasher; Refrigerator; Electric stove/oven
- Flooring: Vinyl plank
- Bathrooms: 2 full bathrooms
- Heating & cooling: Central heating (electric); Central air conditioning
- Interior features: Formica counters; Aluminum-framed windows
- Laundry & utility: Washer hookup; Electric dryer hookup
Neighborhood map
What this means for you Summary
Snapshot
- This is a 3-bed/2.0-bath manufactured listed at $134k.
Deal economics
- At list price, monthly cash flow is $299 ($4k/yr) — positive.
- The deal already cash-flows at list — no discount required.
- Meets the 1% rule at list price ($2k rent vs $134k).
- Recommended offer: $130k (3.0% below list) — sets the bar for market timing.
- Cap rate 12.8% vs local median 4.8% in Youngsville — top-decile yield for the area; either an underpriced asset or a hidden risk that comps aren't pricing in. Stress-test before assuming the spread holds.
Location & tenants
- Location reads 78/100 on livability (#8 in LA, #2,614 nationally) — a middle-class / working-renter tenant base. Strengths: employment A+, housing A+, health & safety A+; Watch: amenities F, commute F.
- Lafayette Parish (urban): math 38% / reading 46% proficiency, ranked #19 of 98 in LA (top 19%) — families likely to look elsewhere, expect single-tenant / working-renter base with shorter leases.
- Zoned schools: Ernest Gallet Elementary School (math 74% / reading 68%, grade A-, #23 of 646 statewide, top 4%, 702 students, 40% FRL); Youngsville Middle School (math 42% / reading 52%, grade D+, #37 of 218 statewide, top 18%, 646 students, 49% FRL); Southside High School (math 52% / reading 53%, grade C-, #30 of 265 statewide, top 12%, 1,910 students, 39% FRL).
- Zoned-school proficiency averages 57% at this address vs 42% district-wide (+15 pts) — the actual schools serving this property are materially stronger than the Lafayette Parish average implies; a family-tenant draw the district grade alone would hide.
- Market conditions: Rents rising (+1.6%/yr); 675 active listings in the ZIP; 10 comparable units currently listed for rent nearby; rentals at typical pace (median 21d on market — plan ~3-4 weeks tenant-placement turnaround); 40% of comp listings sitting > 30 days — soft ceiling on asking rent; solid renter incomes; 1,585 units permitted in Lafayette Parish in 2024 (10 in 5+ unit buildings).
Forward outlook
- Local home prices are declining (-3.0%/yr); year-one equity from $926 of loan paydown is wiped out by about $4k of value loss. Plan a longer hold.
- Lafayette County population projected at +34% by 2050 — long-run rental-demand tailwind backs the buy-and-hold thesis.
Negotiation context
- It's been on market 51 days — a 3% lower offer ($130k) is reasonable based on typical stale-listing flexibility.
- 5 sale attempts since 21y ago with the ask held roughly flat each time — persistent listings suggest the price (not the market) is what's stuck; bring a comps-based counter.
- Current owner paid $35k; list at $134k implies a 283% gain — meaningful room to come down on a strong offer.
Risks & watch-outs
- Watch-outs: flood insurance adds $427/mo.
- Climate carrying-cost: in FEMA flood zone AE (mandatory federal flood insurance); severe wind risk, 99% chance of damaging wind over 30y; extreme-heat days projected 7→21/yr by 2055 (HVAC capex compounding) — expect insurance premiums to compound above CPI over the hold.
Questions for the listing agent
- It's been on market 51 days. Have you received any prior offers? Is the seller open to a 3% concession, seller financing, or rate buy-down credit?
- What's the actual annual flood-insurance premium (NFIP or private), and is the property in a SFHA with mandatory coverage?
- Is there a deadline driving the sale (1031 exchange, divorce, estate, relocation)? That informs how much negotiation room exists.
- Schools are A-rated — typically a magnet for longer-tenancy family renters. What's the average tenant stay here, and is there a school-zone premium baked into asking?
- What's the average days-on-market for RENTAL listings here right now (not sales)? A rising rental-DOM trend means longer vacancies and softer asking-rent achievability than the comps imply.
- What's the recent tenant-quality profile in this submarket — average credit score on applications, eviction rate, late-payment / NSF rate, and stable-employment percentage? A property-management company in the area should have these aggregated.
- How much new for-sale + rental construction is in the pipeline within 1–3 miles? Heavy new supply typically softens prices + rents 12–24 months out; constrained supply supports both.
Investment metrics
- 1% rule
- 1.46% ✓
- Cap rate
- 12.79%
- Cash-on-cash
- 23.20%
- DSCR
- 2.03
- GRM
- 5.7
CMA / ARV
- ARV (median comp)
- $147,500
- List price
- $134,000
- Delta
- -9.15%
- Verdict
- FAIR
- Comps
- 1 within 2.0 mi
Show comp detail 1 sale within ~0.75 mi
| Address | Dist | Beds/Ba | Sqft | Sold | Price | $/sf | Match |
|---|---|---|---|---|---|---|---|
| 620 Chemin Metairie Rd | 0.68mi | 2/2.0 (-1) | 1,000 (-14%) | 16mo | $129,500 | $130 | 27 |
Match score weights: distance 35% · size 25% · config 20% · recency 20%. Top-matched comps best support the ARV.
Projected returns pro-forma
-3.0% appreciation · 1.65% rent growth · sell at horizon
- IRR
- -3.7%
- Equity multiple
- 0.86×
- Total profit
- $-5,079
- Equity at exit
- $19,980
- IRR
- 4.1%
- Equity multiple
- 1.28×
- Total profit
- $10,544
- Equity at exit
- $11,586
Cash invested: $37,520 (down + closing). Projections, not guarantees.
Landlord ↔ Tenant lean methodology
- Overall (STATE)
- 90 Strongly Landlord-Friendly
- State Louisiana
- 90 Strongly Landlord-Friendly · R+12
- County
- — inherits STATE
- City
- — inherits STATE
ZIP-level market 70592
- Home prices YoY
- -23.4%
- Rents YoY
- 1.6%
- Active inventory
- 675
- Price-to-rent
- 5.7×
Monthly cashflow live
- Estimated rent
- $1,950 high interval (Pro) →
- Mortgage (P&I)
- −$703
- Tax from tax record
- −$57 /mo · $680/yr
- Insurance
- −$56
- Flood insurance flood zone
- −$427 /mo · $5,118/yr
- HOA
- −$0
- Vacancy / Maint / Mgmt
- −$409
- Net cashflow
- $299
Break-even live
UW: 25.0% down · 7.5% · 30yr · 1.5% tax · 5.0% vac · 8.0% maint · 8.0% mgmt
Financing live
Cash to close
- Down payment
- $33,500
- Closing costs
- $4,020
- Reserves months
- —
- Total cash needed
- —
Loan-product check · same deal, 3 products live
Conventional
25% down · 7.5% · 30yr
- Down + closing
- —
- Monthly P&I
- —
- Monthly cashflow
- —
- DSCR
- —
- Eligible?
- —
Personal DTI + credit; lowest rate.
DSCR
20% down · 8.5% · 30yr
- Down + closing
- —
- Monthly P&I
- —
- Monthly cashflow
- —
- DSCR
- —
- Eligible?
- —
No personal income docs; deal must DSCR.
Hard money
10% down · 12.0% · 12mo
- Down + closing
- —
- Monthly P&I
- —
- Monthly cashflow
- —
- DSCR
- —
- Eligible?
- —
Short-term bridge; refi at stabilization.
Rent comps 10 comps
| Address | Beds | Baths | Sqft | Rent | $/sqft | DOM | Units | Dist |
|---|---|---|---|---|---|---|---|---|
| 118 Village Green Dr Youngsville, LA | 3.0 | 2.0 | 1410 | $1,800 | $1.28 | 13d | 1 | 0.28mi |
| 117 Harvey Cay Ln Youngsville, LA | 3.0 | 2.0 | 1499 | $1,950 | $1.30 | 43d | 1 | 0.48mi |
| 127 Santa Marta Dr Youngsville, LA | 3.0 | 2.0 | 1305 | $1,800 | $1.38 | 21d | 1 | 0.91mi |
| 119 Gadwall Dr Youngsville, LA | 2.0 | 2.5 | 1453 | $1,795 | $1.24 | 43d | 1 | 0.95mi |
| 105 Firethorn Dr Youngsville, LA | 2.0 | 2.5 | 1453 | $1,695 | $1.17 | 21d | 1 | 0.99mi |
| 201 Prescott Blvd Youngsville, LA | 1.0–2.0 | 1.0–2.0 | 829 | $1,956 | $2.36 | 13d | 14 | 1.15mi |
| 502 Chemin Metairie Rd Unit B Youngsville, LA | 2.0 | 1.5 | 1100 | $995 | $0.90 | 43d | 1 | 1.17mi |
| 1931 Chemin Metairie Pkwy Youngsville, LA | 1.0–3.0 | 1.0–2.0 | 1132 | $1,899 | $1.68 | 13d | 69 | 1.34mi |
| 130 Windermere Cir Youngsville, LA | 3.0 | 2.0 | 1493 | $4,500 | $3.01 | 43d | 1 | 1.39mi |
| 200 Crick Point WAY Youngsville, LA | 2.0–3.0 | 2.0 | 1134 | $2,040 | $1.80 | 13d | 6 | 1.49mi |
Listing history 24 events
-
2026-06-18days on market $134,000 Active 51 DOM
-
2026-06-17days on market $134,000 Active 50 DOM
-
2026-06-16days on market $134,000 Active 49 DOM
-
2026-06-15days on market $134,000 Active 48 DOM
-
2026-06-14days on market $134,000 Active 46 DOM
-
2026-06-13days on market $134,000 Active 45 DOM
-
2026-06-10days on market $134,000 Active 43 DOM
-
2026-06-09days on market $134,000 Active 42 DOM
-
2026-06-08days on market $134,000 Active 41 DOM
-
2026-06-07days on market $134,000 Active 40 DOM
-
2026-06-05days on market $134,000 Active 37 DOM
-
2026-06-03days on market $134,000 Active 36 DOM
-
2026-06-02days on market $134,000 Active 35 DOM
-
2026-06-01days on market $134,000 Active 34 DOM
-
2026-05-31days on market $134,000 Active 33 DOM
-
2026-05-30days on market $134,000 Active 32 DOM
-
2026-05-09status Active 760-char remark
-
2026-04-30historical Contingent (Show) 760-char remark
-
2026-04-28$134,000 Active 760-char remark
-
2026-02-16$139,500 Active
-
2006-03-24soldstatus
-
2005-09-19soldstatus $35,000
Show marketing remark (26 chars)
CASE# 221-317202 (IE) $275
-
2005-07-14$38,880
Show marketing remark (26 chars)
CASE# 221-317202 (IE) $275
-
2005-05-12$48,000
ⓘ Source: listings_history table (triggers on properties + properties_extension) + one-shot
backfill from property_details.listing_events for pre-trigger history.
Tax reassessment forecast LA · Resets to sale price
- Current annual tax
- $680 · $57/mo
- Projected year-2 tax
- $737 · $61/mo
- Expected delta
- +$57/yr (+$5/mo · 8.4%)
ⓘ Screening estimate from a state-policy table — verify with the county assessor before closing.
Climate risk First Street
- Flood 8/10 Severe FEMA zone AE · 99% chance over 30 yrs
- Wildfire 1/10 Low
- Heat 9/10 Extreme 7 d/yr ≥108°F today · 21 d/yr by 30 yrs out
- Wind 9/10 Extreme 99% chance of damaging wind over 30 yrs
- Air quality 1/10 Low 0 unhealthy d/yr today · 0 by 30 yrs out
Nearby sold comps map
Loading sold comps map…
Walkable amenities ~0.75 mi
Loading nearby amenities…
Taxation est. · year 1
- Rental income
- $23,399
- − Mortgage interest
- −$7,506
- − Property taxes
- −$680
- − Insurance
- −$5,788
- − Repairs & maintenance
- −$1,872
- − Management
- −$1,872
- − Depreciation
- −$3,898
- Taxable income
- $1,783
- Est. tax owed @ 24.0%
- −$428
- After-tax cash flow
- $3,157/yr
For passive investors: Depreciation is non-cash, so a rental often shows a tax loss while cash-flowing — sheltering income. Rental losses are passive: they offset passive income freely, and up to $25,000/yr can offset ordinary (W-2) income if you actively participate and your MAGI is under $100k (phasing out to $0 by $150k); unused losses carry forward. On sale, claimed depreciation is recaptured at up to 25%, and gains may owe capital-gains tax (a 1031 exchange can defer both). Figures are a year-1 estimate at your 24.0% rate — not tax advice; consult a CPA.
Schools (NCES district)
- District
- Lafayette Parish
- NCES district ID
- 2200870
- Math proficiency
- 38% ▼ -32.00%
- Reading proficiency
- 46% ▼ -24.00%
- Median HH income
- $50,238
- Composite
- 36.15/100
- National rank
- #4741
- State rank
- #19 of 98 in LA
Livability — Youngsville
- Score
- 78/100
- State rank
- #8
- US rank
- #2614
Category grades
Schools grade is shown separately in the Schools card above.
Census & demographics
- County
- Lafayette Parish · 207,544 people
- City population
- 32,167
- Metro
- Lafayette, LA
- Population (ZIP)
- 32,167
- Household income
- $93,204
- Rent vs Own
- Severe rent burden
- 424.0
Population outlook (Lafayette County) Hauer SSP2
- Today (2025)
- 280,930 people
- By 2030
- 301,092 · +7.2%
- By 2040
- 339,456 · +20.8%
- By 2050
- 375,156 · +33.5%
- By 2075
- 451,672 · +60.8%
- By 2100
- 497,203 · +77.0%
Race, ethnicity, and origin ACS 2023
- Neighborhood character
- Predominantly White (82%)
- Race & ethnicity
- White 82% Black 10% Two or more races 5% Hispanic / Latino 4% Asian 1%
- Common ancestry
- Lithuanian 24% Romanian 3% Italian 1%
- Foreign-born
- 3% · Canada
- Languages at home
- 94% English-only · French/Haitian/Cajun 3% Spanish 2%
Political lean MEDSL · Lafayette
- 2024 margin
- Solid R (+31.4) · D 33.5% · R 64.8% · Other 1.7%
- 2008→2024 swing
- -0.1pp no change · 2008: -31.3pp · 2024: -31.4pp
- All cycles
- 2024: R+31.4 2020: R+28.7 2016: R+33.6 2012: R+33.7 2008: R+31.3
Not yet ingested
- Civics
- —
Market trends
- HPI YoY
- ▼ -41.24%
- Current HPI
- 135.2825
- Rent YoY
- ▲ 1.65%
- Metro
- Lafayette, LA
- State GDP YoY
- ▲ 3.29%
- F500 in state
- 10
Industry mix (Fortune 500 HQ in LA)
| Industry | F500 HQs | Revenue |
|---|---|---|
| Telecommunications | 2 | $23B |
|
||
| Utilities | 1 | $12B |
|
||
| Wholesale / Distribution | 1 | $5B |
|
||
| Advertising | 1 | $2B |
|
||
Price history
+179.2% since first listed8 events — show timeline
- 2026-05-09 Relisted — AcadianaMLS
- 2026-04-30 Contingent — AcadianaMLS
- 2026-04-28 Listed $134,000 AcadianaMLS
- 2026-02-16 Listed $139,500 AcadianaMLS
- 2006-03-24 Sold (Public Records) — Public Records
- 2005-09-19 Sold (MLS) $35,000 AcadianaMLS
- 2005-07-14 Listed $38,880 AcadianaMLS
- 2005-05-12 Listed $48,000 AcadianaMLS
Property tax history
+1.7%/yrLatest (2025): $680 · -1.3% YoY. Source: county tax records.
Cash-flow waterfall
monthlySold comps — $/sqft
last 12 mo · ≤1 miLoading sold comps…