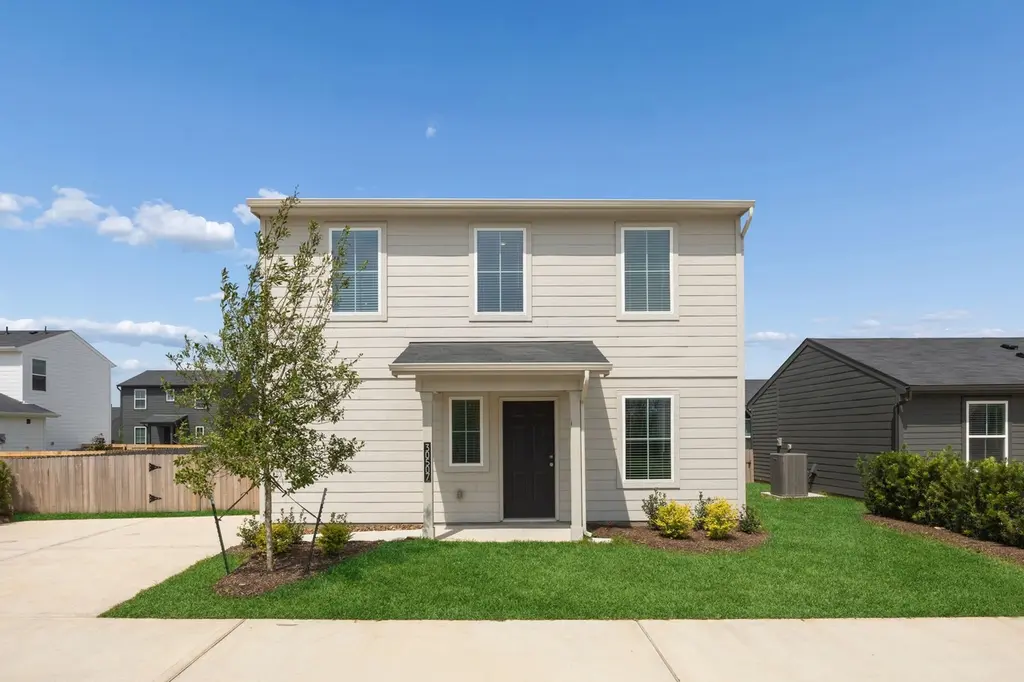
30507 Bladnoch Ln · Houston, TX
Flood risk No data
- FEMA flood zone
- —
- Chance of flooding over 30 yrs
- —
- Est. flood insurance / yr
- —
Fire risk No data
- Est. fire insurance / yr
- —
Heat risk No data
- Hot days now (above threshold)
- —
- Hot days in 30 yrs
- —
Wind risk No data
- Chance of severe wind over 30 yrs
- —
Air-quality risk No data
- Unhealthy air days now
- —
- Unhealthy air days in 30 yrs
- —
Risk factors via First Street. Map © Google.
Why this score? — see what drove the D grade
The composite is a weighted blend of 9 inputs, each scored 0–100. Each bar is that input's sub-score; the figure is the points it added to the 100-point composite (weight × sub-score).
- Cash flow +11.2/30.0
- ARV discount +7.8/15.0
- Condition / age +4.0/5.0
- 1% rule +3.9/10.0
- Livability +3.7/5.0
- DSCR +3.3/10.0
- Appreciation +2.9/10.0
- Schools +2.9/10.0
- Rent growth +1.6/5.0
$196,495
🖨 Deal sheet (PDF) 📄 Offer letter ✓ Due diligence
Listing remarks MLS
READY NOW. Growing families appreciate the strategic design of our two-story Chester plan by Centex. Enjoy the convenience of a main-level primary bedroom complete with a spacious walk-in closet, while two additional bedrooms upstairs provide flexible space for children, guests, or a dedicated home office. The open concept living, dining, and kitchen areas make entertaining as special as you are.
Key facts
- Community pool
- Built 2026
- Listed 106 days
Tags
Neighborhood map
What this means for you Summary
Snapshot
- This is a 3-bed/2.5-bath single-family listed at $196k. Condition is rated good.
Deal economics
- At list price, monthly cash flow is $-75 ($-896/yr) — negative.
- To cash-flow at today's rent, offer at most $186k (5.5% below list).
- To meet the 1% rule (rent ≥ 1% of price), the offer needs to be $174k (11.4% below list).
- Recommended offer: $174k (11.4% below list) — sets the bar for 1% rule.
- Cap rate 5.8% vs local median 3.1% in Houston — top-decile yield for the area; either an underpriced asset or a hidden risk that comps aren't pricing in. Stress-test before assuming the spread holds.
Location & tenants
- Location reads 74/100 on livability (#184 in TX, #4,771 nationally) — a middle-class / working-renter tenant base. Strengths: amenities A+, cost of living A+, housing A+; Watch: crime F.
- Waller ISD (rural): math 30% / reading 35% proficiency, ranked #532 of 826 in TX (top 64%) — families likely to look elsewhere, expect single-tenant / working-renter base with shorter leases.
- Zoned schools: Fields Store El (math 47% / reading 43%, grade D-, #1,133 of 4,322 statewide, top 27%, 663 students, 63% FRL); Schultz J H (math 31% / reading 37%, grade F, #892 of 1,662 statewide, top 55%, 1,120 students, 65% FRL); Waller H S (math 25% / reading 40%, grade F, #1,029 of 1,632 statewide, top 64%, 2,639 students, 62% FRL) — zoned schools at 63% FRL track the district average.
- Market conditions: Rents falling (-3.8%/yr); 1196 active listings in the ZIP; solid renter incomes; 29,883 units permitted in Harris County in 2024 (8,621 in 5+ unit buildings).
Forward outlook
- Local home prices are declining (-3.0%/yr); year-one equity from $1k of loan paydown is wiped out by about $6k of value loss. Plan a longer hold.
- Harris County population projected at +47% by 2050 — long-run rental-demand tailwind backs the buy-and-hold thesis.
Negotiation context
- It's been on market 106 days — a 9% lower offer ($179k) is reasonable based on typical stale-listing flexibility.
- 2 sale attempts; this cycle's ask has dropped $18k (8%) from the opening price — seller is motivated, your offer sets the floor, not the list.
Questions for the listing agent
- What do current leases actually rent for vs. the listed asking? Can we see a recent rent roll and the last 12 months of T-12 income?
- It's been on market 106 days. Have you received any prior offers? Is the seller open to a 11% concession, seller financing, or rate buy-down credit?
- What does the HOA fee cover, when was the last increase, and are there any pending special assessments or reserve-fund shortfalls?
- Why hasn't it sold? Are there any deal-killer items the seller is aware of (foundation, flood, title, zoning, code violations)?
- Is there a deadline driving the sale (1031 exchange, divorce, estate, relocation)? That informs how much negotiation room exists.
- Schools are D-rated, which usually means shorter tenancies and higher turnover. Who's the typical renter profile here, and what's been the actual vacancy rate?
- Crime grade is F in this area — have there been break-ins, vandalism, or insurance claims at this property in the last 3 years? What carrier currently insures it and at what premium?
- The area grade is low — what's the realistic commute time and amenity access for the typical tenant pool here? Any planned neighborhood developments (good or bad) we should know about?
- What's the average days-on-market for RENTAL listings here right now (not sales)? A rising rental-DOM trend means longer vacancies and softer asking-rent achievability than the comps imply.
- What's the recent tenant-quality profile in this submarket — average credit score on applications, eviction rate, late-payment / NSF rate, and stable-employment percentage? A property-management company in the area should have these aggregated.
- How much new for-sale + rental construction is in the pipeline within 1–3 miles? Heavy new supply typically softens prices + rents 12–24 months out; constrained supply supports both.
Investment metrics
- 1% rule
- 0.89% ✗
- Cap rate
- 5.84%
- Cash-on-cash
- -1.63%
- DSCR
- 0.93
- GRM
- 9.4
CMA / ARV
- ARV (median comp)
- $197,850
- List price
- $196,495
- Delta
- -0.68%
- Verdict
- FAIR
- Comps
- 20 within 1.0 mi
Show comp detail 12 sales within ~0.75 mi
| Address | Dist | Beds/Ba | Sqft | Sold | Price | $/sf | Match |
|---|---|---|---|---|---|---|---|
| 30524 Wolfburn St | 0.04mi | 3/2.5 | 1,256 (0%) | 2mo | $195,035 | $155 | 96 |
| 23107 Daftmill Dr | 0.09mi | 3/2.0 | 1,204 (-4%) | 1mo | $239,230 | $199 | 86 |
| 30505 Bladnoch Ln | 0.27mi | 3/2.5 | 1,256 (0%) | 3mo | $217,780 | $173 | 85 |
| 30531 Bladnoch Ln | 0.27mi | 3/2.5 | 1,256 (0%) | 7mo | $196,460 | $156 | 82 |
| 30509 Bladnoch Ln | 0.01mi | 3/2.0 | 1,118 (-11%) | 1mo | $198,405 | $177 | 79 |
| 30514 Wolfburn St | 0.03mi | 3/2.0 | 1,118 (-11%) | 0mo | $192,295 | $172 | 78 |
| 30522 Wolfburn St | 0.05mi | 3/2.0 | 1,118 (-11%) | 2mo | $189,795 | $170 | 76 |
| 30530 Wolfburn St | 0.06mi | 3/2.0 | 1,118 (-11%) | 4mo | $197,295 | $176 | 73 |
| 30525 Bladnoch Ln | 0.05mi | 3/2.0 | 1,118 (-11%) | 6mo | $187,295 | $168 | 72 |
| 30507 Longmorn Glass Ln | 0.31mi | 3/2.0 | 1,204 (-4%) | 8mo | $220,240 | $183 | 70 |
| 30533 Bladnoch Ln | 0.27mi | 3/2.0 | 1,118 (-11%) | 4mo | $198,720 | $178 | 64 |
| 30517 Bladnoch Ln | 0.31mi | 3/2.0 | 1,118 (-11%) | 7mo | $197,295 | $176 | 59 |
Match score weights: distance 35% · size 25% · config 20% · recency 20%. Top-matched comps best support the ARV.
Projected returns pro-forma
-3.0% appreciation · 0.0% rent growth · sell at horizon
- IRR
- -22.6%
- Equity multiple
- 0.24×
- Total profit
- $-41,614
- Equity at exit
- $29,298
- IRR
- -28.1%
- Equity multiple
- -0.12×
- Total profit
- $-61,739
- Equity at exit
- $16,989
Cash invested: $55,019 (down + closing). Projections, not guarantees.
Landlord ↔ Tenant lean methodology
- Overall (STATE)
- 87 Strongly Landlord-Friendly
- State Texas
- 87 Strongly Landlord-Friendly · R+5
- County
- — inherits STATE
- City
- — inherits STATE
ZIP-level market 77484
- Home prices YoY
- -1.0%
- Rents YoY
- -3.8%
- Active inventory
- 1196
- Price-to-rent
- 9.4×
Monthly cashflow live
- Estimated rent
- $1,741 medium interval (Pro) →
- Mortgage (P&I)
- −$1,030
- Tax est. 1.5%
- −$246 /mo · $2,947/yr
- Insurance
- −$82
- HOA
- −$92
- Vacancy / Maint / Mgmt
- −$366
- Net cashflow
- $-75
Break-even live
Sensitivity live
| Price | -10% $61 | -5% $-7 | +0% $-75 | +5% $-143 | +10% $-210 |
|---|---|---|---|---|---|
| Rent | -10% $-212 | -5% $-143 | +0% $-75 | +5% $-6 | +10% $63 |
| Rate | -1.0pp $24 | -0.5pp $-25 | base $-75 | +0.5pp $-126 | +1.0pp $-177 |
UW: 25.0% down · 7.5% · 30yr · 1.5% tax · 5.0% vac · 8.0% maint · 8.0% mgmt
Financing live
Cash to close
- Down payment
- $49,124
- Closing costs
- $5,895
- Reserves months
- —
- Total cash needed
- —
Loan-product check · same deal, 3 products live
Conventional
25% down · 7.5% · 30yr
- Down + closing
- —
- Monthly P&I
- —
- Monthly cashflow
- —
- DSCR
- —
- Eligible?
- —
Personal DTI + credit; lowest rate.
DSCR
20% down · 8.5% · 30yr
- Down + closing
- —
- Monthly P&I
- —
- Monthly cashflow
- —
- DSCR
- —
- Eligible?
- —
No personal income docs; deal must DSCR.
Hard money
10% down · 12.0% · 12mo
- Down + closing
- —
- Monthly P&I
- —
- Monthly cashflow
- —
- DSCR
- —
- Eligible?
- —
Short-term bridge; refi at stabilization.
HOA detail
- Monthly dues
- $92 · $1,104/yr
Listing history 19 events
-
2026-06-21days on market $196,495 Active 106 DOM
-
2026-06-18days on market $196,495 Active 103 DOM
-
2026-06-17days on market $196,495 Active 102 DOM
-
2026-06-16days on market $196,495 Active 101 DOM
-
2026-06-15days on market $196,495 Active 100 DOM
-
2026-06-13days on market $196,495 Active 98 DOM
-
2026-06-09days on market $196,495 Active 94 DOM
-
2026-06-08days on market $196,495 Active 93 DOM
-
2026-06-07days on market $196,495 Active 92 DOM
-
2026-06-04days on market $196,495 Active 89 DOM
-
2026-06-03days on market $196,495 Active 88 DOM
-
2026-06-02days on market $196,495 Active 87 DOM
-
2026-06-01days on market $196,495 Active 86 DOM
-
2026-05-31days on market $196,495 Active 85 DOM
-
2026-05-16price $196,495 399-char remark
Show marketing remark (399 chars)
READY NOW. Growing families appreciate the strategic design of our two-story Chester plan by Centex. Enjoy the convenience of a main-level primary bedroom complete with a spacious walk-in closet, while two additional bedrooms upstairs provide flexible space for children, guests, or a dedicated home office. The open concept living, dining, and kitchen areas make entertaining as special as you are.
-
2026-05-14price $206,495 399-char remark
Show marketing remark (399 chars)
READY NOW. Growing families appreciate the strategic design of our two-story Chester plan by Centex. Enjoy the convenience of a main-level primary bedroom complete with a spacious walk-in closet, while two additional bedrooms upstairs provide flexible space for children, guests, or a dedicated home office. The open concept living, dining, and kitchen areas make entertaining as special as you are.
-
2026-03-07$214,715 Active 399-char remark
Show marketing remark (399 chars)
READY NOW. Growing families appreciate the strategic design of our two-story Chester plan by Centex. Enjoy the convenience of a main-level primary bedroom complete with a spacious walk-in closet, while two additional bedrooms upstairs provide flexible space for children, guests, or a dedicated home office. The open concept living, dining, and kitchen areas make entertaining as special as you are.
-
2025-06-20historical
-
2025-05-14$224,615 Active
ⓘ Source: listings_history table (triggers on properties + properties_extension) + one-shot
backfill from property_details.listing_events for pre-trigger history.
Nearby sold comps map
Loading sold comps map…
Walkable amenities ~0.75 mi
Loading nearby amenities…
Taxation est. · year 1
- Rental income
- $20,890
- − Mortgage interest
- −$11,007
- − Property taxes
- −$2,947
- − Insurance
- −$982
- − Repairs & maintenance
- −$1,671
- − Management
- −$1,671
- − HOA
- −$1,104
- − Depreciation
- −$5,716
- Taxable loss
- −$4,209
- Est. tax savings @ 24.0%
- +$1,010
- After-tax cash flow
- $114/yr
For passive investors: Depreciation is non-cash, so a rental often shows a tax loss while cash-flowing — sheltering income. Rental losses are passive: they offset passive income freely, and up to $25,000/yr can offset ordinary (W-2) income if you actively participate and your MAGI is under $100k (phasing out to $0 by $150k); unused losses carry forward. On sale, claimed depreciation is recaptured at up to 25%, and gains may owe capital-gains tax (a 1031 exchange can defer both). Figures are a year-1 estimate at your 24.0% rate — not tax advice; consult a CPA.
Condition & rehab AI · 12 photos
This two-story home is in excellent condition with modern finishes and a well-maintained exterior. It is move-in ready and would benefit from minor updates to further enhance its value.
Value-add opportunities
- Both Painting the exterior and interior walls — Fresh paint enhances curb appeal and interior aesthetics.
- Both Landscaping improvements — Enhanced landscaping can increase both resale and rental value.
- Both Adding smart home features — Smart home features can increase both resale and rental value by making the home more modern and convenient.
Renovation cost estimate screening
Value-add ROI direction
- Both Painting the exterior and interior walls — Fresh paint enhances curb appeal and interior aesthetics. ↑
- Both Landscaping improvements — Enhanced landscaping can increase both resale and rental value. ↑
- Both Adding smart home features — Smart home features can increase both resale and rental value by making the home more modern and convenient. ↑
ⓘ Cost ranges are severity-bucket heuristics (US national rule-of-thumb). Get contractor quotes + a written scope before underwriting a rehab budget.
Schools (NCES district)
- District
- Waller ISD
- NCES district ID
- 4844430
- Math proficiency
- 30% ▼ -23.00%
- Reading proficiency
- 35% ▼ -11.00%
- Median HH income
- $58,911
- Composite
- 29.12/100
- National rank
- #6593
- State rank
- #532 of 826 in TX
Livability — Houston
- Score
- 74/100
- State rank
- #184
- US rank
- #4771
Category grades
Schools grade is shown separately in the Schools card above.
Census & demographics
- County
- Harris County · 4,702,590 people
- City population
- 3,226,434
- Metro
- Houston-The Woodlands-Sugar Land, TX
- Population (ZIP)
- 14,348
- Household income
- $81,250
- Rent vs Own
- Severe rent burden
- 270.0
Population outlook (Harris County) Hauer SSP2
- Today (2025)
- 5,571,493 people
- By 2030
- 6,089,821 · +9.3%
- By 2040
- 7,142,806 · +28.2%
- By 2050
- 8,185,864 · +46.9%
- By 2075
- 10,574,329 · +89.8%
- By 2100
- 12,109,958 · +117.4%
Race, ethnicity, and origin ACS 2023
- Neighborhood character
- Diverse neighborhood (Simpson 0.66)
- Race & ethnicity
- White 47% Hispanic / Latino 31% Two or more races 16% Black 15%
- Hispanic origin (detail)
- Mexican 30%
- Common ancestry
- Slovak 2% Serbian 2% Iranian 1%
- Foreign-born
- 13% · Canada
- Languages at home
- 73% English-only · Spanish 24% Arabic 2%
Political lean MEDSL · Harris
- 2024 margin
- Lean D (+5.5) · D 52.0% · R 46.4% · Other 1.6%
- 2008→2024 swing
- +3.9pp toward D · 2008: 1.6pp · 2024: 5.5pp
- All cycles
- 2024: D+5.5 2020: D+13.3 2016: D+12.4 2012: D+0.1 2008: D+1.6
Not yet ingested
- Civics
- —
Market trends
- HPI YoY
- ▼ -4.17%
- Current HPI
- 397.85
- Rent YoY
- ▼ -3.77%
- Metro
- Houston-The Woodlands-Sugar Land, TX
- State GDP YoY
- ▲ 3.95%
- F500 in state
- 110
Industry mix (Fortune 500 HQ in TX)
| Industry | F500 HQs | Revenue |
|---|---|---|
| Energy | 16 | $1,198B |
|
||
| Technology | 5 | $198B |
|
||
| Engineering / Construction | 4 | $72B |
|
||
| Energy Services | 3 | $60B |
|
||
| Utilities | 3 | $41B |
|
||
| Healthcare | 2 | $330B |
|
||
Price history
-12.5% since first listed5 events — show timeline
- 2026-05-16 Price Changed $196,495 HARMLS
- 2026-05-14 Price Changed $206,495 HARMLS
- 2026-03-07 Listed $214,715 HARMLS
- 2025-06-20 Listing Removed — HARMLS
- 2025-05-14 Listed $224,615 HARMLS
Cash-flow waterfall
monthlySold comps — $/sqft
last 12 mo · ≤1 miLoading sold comps…