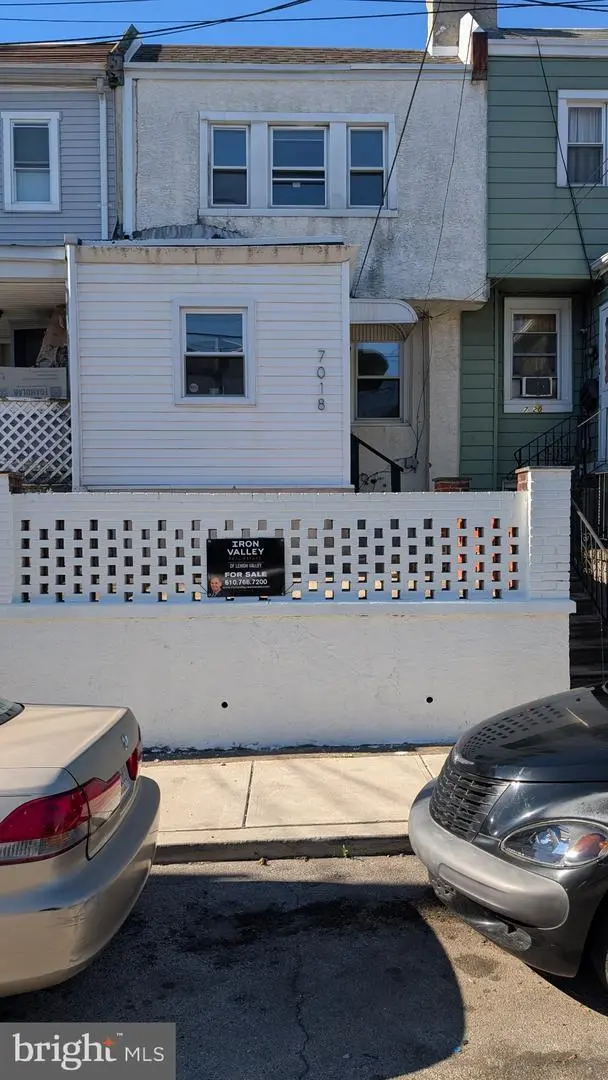
7018 Atlantic Ave · Upper Darby, PA
Flood risk 1/10 · Minimal
- FEMA flood zone
- X (unshaded)
- Chance of flooding over 30 yrs
- 0.0%
- Est. flood insurance / yr
- $473 – $860
Fire risk 1/10 · Minimal
- Est. fire insurance / yr
- $511 – $949
Heat risk 6/10 · Moderate
- Hot days now (above 103°F)
- 7 days/yr
- Hot days in 30 yrs
- 15 days/yr
Wind risk 6/10 · Moderate
- Chance of severe wind over 30 yrs
- 27.0%
Air-quality risk 4/10 · Minor
- Unhealthy air days now
- 3 days/yr
- Unhealthy air days in 30 yrs
- 6 days/yr
Risk factors via First Street. Map © Google.
Why this score? — see what drove the D- grade
The composite is a weighted blend of 9 inputs, each scored 0–100. Each bar is that input's sub-score; the figure is the points it added to the 100-point composite (weight × sub-score).
- Cash flow +15.0/30.0
- ARV discount +4.9/15.0
- DSCR +4.6/10.0
- 1% rule +4.4/10.0
- Rent growth +2.9/5.0
- Livability +2.5/5.0
- Condition / age +2.5/5.0
- Schools +2.4/10.0
- Appreciation +0.0/10.0
$169,900
🖨 Deal sheet (PDF) 📄 Offer letter ✓ Due diligence
Listing remarks
Welcome to 7018 Atlantic Ave! This beautifully renovated 3-bedroom, 1-bathroom home in Upper Darby is packed with features you'll love. The main level offers a bright and inviting living room, dining room, and kitchen, all filled with natural light and enhanced by brand-new luxury vinyl plank flooring throughout. The stunning custom kitchen is the centerpiece of the home, featuring custom cabinetry, quartz countertops, stainless steel appliances, and a stylish tile backsplash. Upstairs, you'll find two spacious bedrooms and a full bathroom, providing comfortable living space and ample storage. The lower level features a legal third bedroom with its own private rear entrance, offering flexib
Key facts
- Built 1927
Property features AI
Exterior
- Parking: On-street parking
- Utilities: Public water; Public sewer
- Home design: End-of-row townhouse; Fee simple ownership; Finished area above grade recorded by assessor
- Construction: Frame and masonry construction; Stone foundation
- Exterior features: Lot dimensions approximately 16 x 60
Interior
- Bedrooms: Two bedrooms on the first upper level; One bedroom on the first lower level
- Bathrooms: One full bathroom
- Heating & cooling: Hot water heating; Natural gas heating and natural gas hot water
- Interior features: Partially finished basement
Neighborhood map
What this means for you Summary
Snapshot
- This is a 3-bed/1.0-bath townhouse listed at $170k.
Deal economics
- At list price, monthly cash flow is $54 ($651/yr) — positive.
- The deal already cash-flows at list — no discount required.
- To meet the 1% rule (rent ≥ 1% of price), the offer needs to be $160k (5.9% below list).
- Recommended offer: $160k (5.9% below list) — sets the bar for 1% rule.
Location & tenants
- Location reads: area grade D — affects rentability + tenant quality, not the cash-flow math above.
- Upper Darby SD (suburban): math 18% / reading 36% proficiency, ranked #453 of 539 in PA (top 84%) — low school quality limits family demand, transient renter base, plan for 1-2y turnover.
- Market conditions: Rents rising (+1.6%/yr); 129 active listings in the ZIP; 27 comparable units currently listed for rent nearby; rentals at typical pace (median 25d on market — plan ~3-4 weeks tenant-placement turnaround); 299 units permitted in Delaware County in 2024 (5 in 5+ unit buildings).
- This rent runs 34% of the median local income ($57k/yr) — at the standard rent-burdened threshold; future hikes will face affordability resistance.
Forward outlook
- Local home prices are declining (-3.0%/yr); year-one equity from $1k of loan paydown is wiped out by about $5k of value loss. Plan a longer hold.
Negotiation context
- Only 2 days on market — expect competitive offers; lowballing is unlikely to land.
- 2 sale attempts since 22y ago with the ask held roughly flat each time — persistent listings suggest the price (not the market) is what's stuck; bring a comps-based counter.
- Current owner paid $75k; list at $170k implies a 127% gain — meaningful room to come down on a strong offer.
Risks & watch-outs
- Watch-outs: built in 1927 — expect roof / HVAC / electrical / plumbing capex.
- Climate carrying-cost: major wind risk, 27% chance of damaging wind over 30y; extreme-heat days projected 7→15/yr by 2055 (HVAC capex compounding) — expect insurance premiums to compound above CPI over the hold.
Questions for the listing agent
- Built in 1927 — when were the roof, HVAC, electrical panel, plumbing, and water heater last replaced?
- Is there a deadline driving the sale (1031 exchange, divorce, estate, relocation)? That informs how much negotiation room exists.
- The area grade is low — what's the realistic commute time and amenity access for the typical tenant pool here? Any planned neighborhood developments (good or bad) we should know about?
- What's the average days-on-market for RENTAL listings here right now (not sales)? A rising rental-DOM trend means longer vacancies and softer asking-rent achievability than the comps imply.
- What's the recent tenant-quality profile in this submarket — average credit score on applications, eviction rate, late-payment / NSF rate, and stable-employment percentage? A property-management company in the area should have these aggregated.
- How much new for-sale + rental construction is in the pipeline within 1–3 miles? Heavy new supply typically softens prices + rents 12–24 months out; constrained supply supports both.
Investment metrics
- 1% rule
- 0.94% ✗
- Cap rate
- 6.68%
- Cash-on-cash
- 1.37%
- DSCR
- 1.06
- GRM
- 8.9
CMA / ARV
- ARV (on-the-fly)
- $160,544
- Comps found
- 12
Show comp detail 12 sales within ~0.75 mi
| Address | Dist | Beds/Ba | Sqft | Sold | Price | $/sf | Match |
|---|---|---|---|---|---|---|---|
| 7042 Clinton Rd | 0.26mi | 2/1.0 (-1) | 902 (-3%) | 2mo | $135,000 | $150 | 77 |
| 7023 Guilford Rd | 0.34mi | 2/1.0 (-1) | 868 (-6%) | 2mo | $100,000 | $115 | 67 |
| 641 Copley Rd | 0.34mi | 3/1.0 | 818 (-12%) | 4mo | $162,000 | $198 | 61 |
| 6993 Guilford Rd | 0.32mi | 2/1.5 (-1) | 840 (-10%) | 2mo | $100,000 | $119 | 61 |
| 614 Littlecroft Rd | 0.36mi | 3/1.5 | 818 (-12%) | 2mo | $163,000 | $199 | 60 |
| 7043 Radbourne Rd | 0.23mi | 3/2.0 | 1,060 (+14%) | 2mo | $227,500 | $215 | 60 |
| 7273 Guilford Rd | 0.51mi | 2/1.0 (-1) | 876 (-6%) | 3mo | $131,000 | $150 | 59 |
| 7046 Radbourne Rd | 0.21mi | 4/1.5 (+1) | 1,060 (+14%) | 3mo | $183,000 | $173 | 57 |
| 312 Wiltshire Rd | 0.68mi | 2/1.0 (-1) | 896 (-3%) | 2mo | $155,000 | $173 | 56 |
| 513 Woodcliffe Rd | 0.49mi | 2/1.0 (-1) | 841 (-9%) | 2mo | $136,500 | $162 | 55 |
| 54 Springton Rd | 0.60mi | 3/1.0 | 1,040 (+12%) | 0mo | $180,000 | $173 | 52 |
| 6643 Church Ln | 0.70mi | 2/1.0 (-1) | 832 (-10%) | 2mo | $160,000 | $192 | 43 |
Match score weights: distance 35% · size 25% · config 20% · recency 20%. Top-matched comps best support the ARV.
Projected returns pro-forma
-3.0% appreciation · 1.62% rent growth · sell at horizon
- IRR
- -15.7%
- Equity multiple
- 0.45×
- Total profit
- $-26,219
- Equity at exit
- $25,333
- IRR
- -9.9%
- Equity multiple
- 0.43×
- Total profit
- $-26,935
- Equity at exit
- $14,690
Cash invested: $47,572 (down + closing). Projections, not guarantees.
Landlord ↔ Tenant lean methodology
- Overall (STATE)
- 62 Landlord-Friendly
- State Pennsylvania
- 62 Landlord-Friendly · EVEN
- County
- — inherits STATE
- City
- — inherits STATE
ZIP-level market 19082
- Home prices YoY
- -32.1%
- Rents YoY
- 1.6%
- Active inventory
- 129
- Price-to-rent
- 8.9×
Monthly cashflow live
- Estimated rent
- $1,598 high interval (Pro) →
- Mortgage (P&I)
- −$891
- Tax from tax record
- −$247 /mo · $2,960/yr
- Insurance
- −$71
- HOA
- −$0
- Vacancy / Maint / Mgmt
- −$336
- Net cashflow
- $54
Break-even live
Sensitivity live
| Price | -10% $150 | -5% $102 | +0% $54 | +5% $6 | +10% $-42 |
|---|---|---|---|---|---|
| Rent | -10% $-72 | -5% $-9 | +0% $54 | +5% $117 | +10% $181 |
| Rate | -1.0pp $140 | -0.5pp $97 | base $54 | +0.5pp $10 | +1.0pp $-35 |
UW: 25.0% down · 7.5% · 30yr · 1.5% tax · 5.0% vac · 8.0% maint · 8.0% mgmt
Financing live
Cash to close
- Down payment
- $42,475
- Closing costs
- $5,097
- Reserves months
- —
- Total cash needed
- —
Loan-product check · same deal, 3 products live
Conventional
25% down · 7.5% · 30yr
- Down + closing
- —
- Monthly P&I
- —
- Monthly cashflow
- —
- DSCR
- —
- Eligible?
- —
Personal DTI + credit; lowest rate.
DSCR
20% down · 8.5% · 30yr
- Down + closing
- —
- Monthly P&I
- —
- Monthly cashflow
- —
- DSCR
- —
- Eligible?
- —
No personal income docs; deal must DSCR.
Hard money
10% down · 12.0% · 12mo
- Down + closing
- —
- Monthly P&I
- —
- Monthly cashflow
- —
- DSCR
- —
- Eligible?
- —
Short-term bridge; refi at stabilization.
Rent comps 27 comps
| Address | Beds | Baths | Sqft | Rent | $/sqft | DOM | Units | Dist |
|---|---|---|---|---|---|---|---|---|
| 7116 Seaford Rd Upper Darby, PA | 2.0 | 1.0 | 996 | $1,600 | $1.61 | 44d | 1 | 0.11mi |
| 7111 Greenwood Ave Upper Darby, PA | 3.0 | 1.5 | 1064 | $1,800 | $1.69 | 44d | 1 | 0.18mi |
| 7139 Greenwood Ave Upper Darby, PA | 3.0 | 1.0 | 1064 | $1,600 | $1.50 | 25d | 1 | 0.20mi |
| 7026 Clinton Rd Upper Darby, PA | 2.0 | 1.5 | 902 | $1,650 | $1.83 | 44d | 1 | 0.28mi |
| 6965 Clinton Rd Upper Darby, PA | 2.0 | 1.0 | 986 | $1,675 | $1.70 | 44d | 1 | 0.29mi |
| 702 Copley Rd Upper Darby, PA | 3.0 | 1.0 | 1044 | $1,750 | $1.68 | 25d | 1 | 0.29mi |
| 7050 Clinton Rd Upper Darby, PA | 2.0 | 1.0 | 977 | $1,550 | $1.59 | 44d | 1 | 0.29mi |
| 124 Lexington Ave Unit 2 Lansdowne, PA | 2.0 | 1.0 | 1000 | $1,500 | $1.50 | 3d | 1 | 0.33mi |
| 671 Long Ln Unit B Upper Darby Township, PA | 2.0 | 1.5 | 850 | $1,300 | $1.53 | 25d | 1 | 0.38mi |
| 7147 Radbourne Rd Upper Darby, PA | 3.0 | 1.0 | 1096 | $1,850 | $1.69 | 13d | 1 | 0.52mi |
| 444 Timberlake Rd Upper Darby, PA | 2.0 | 1.0 | 864 | $1,400 | $1.62 | 6d | 1 | 0.55mi |
| 411 Timberlake Rd Upper Darby, PA | 2.0 | 1.0 | 864 | $1,400 | $1.62 | 21d | 1 | 0.59mi |
| 430 Glendale Rd Upper Darby, PA | 3.0 | 1.0 | 1090 | $1,650 | $1.51 | 22d | 1 | 0.59mi |
| 608 Yeadon Ave Unit 2nd Floor Yeadon, PA | 2.0 | 1.0 | 1000 | $1,400 | $1.40 | 13d | 1 | 0.65mi |
| 608 Yeadon Ave Unit 1st Floor Yeadon, PA | 2.0 | 1.0 | 1000 | $1,400 | $1.40 | 18d | 1 | 0.65mi |
| 16 N Rigby Ave Unit 3 Lansdowne, PA | 2.0 | 1.0 | 656 | $1,245 | $1.90 | 44d | 1 | 0.76mi |
| 826 Guenther Ave Lansdowne, PA | 2.0 | 1.0–2.0 | 800 | $1,699 | $2.12 | 25d | 1 | 0.86mi |
| 35 Elberon Ave Unit 2 Lansdowne, PA | 2.0 | 1.0 | 900 | $1,695 | $1.88 | 25d | 1 | 0.94mi |
| 810 Rundale Ave Lansdowne, PA | 2.0 | 1.0 | 868 | $1,500 | $1.73 | 25d | 1 | 0.97mi |
| 130 Garrett Rd Upper Darby, PA | 2.0 | 1.0 | 675 | $999 | $1.48 | 6d | 2 | 1.10mi |
| 5 W Plumstead Ave Unit 1 Lansdowne, PA | 2.0 | 1.0 | 1100 | $1,550 | $1.41 | 25d | 1 | 1.15mi |
| 504 S Lansdowne Ave Lansdowne, PA | 2.0 | 1.0 | 815 | $1,555 | $1.91 | 2d | 4 | 1.24mi |
| 101 W Baltimore Ave Unit H4 Lansdowne, PA | 2.0 | 1.0 | 925 | $1,449 | $1.57 | 22d | 1 | 1.25mi |
| 101 W Baltimore Ave Unit B04 Lansdowne, PA | 2.0 | 1.0 | 925 | $1,469 | $1.59 | 25d | 1 | 1.25mi |
| 7100 W Chester Pike Upper Darby Township, PA | 1.0–2.0 | 1.0 | 770 | $1,315 | $1.71 | 25d | 5 | 1.27mi |
| 37 Concord Rd Darby, PA | 3.0 | 1.0 | 1120 | $1,795 | $1.60 | 44d | 1 | 1.41mi |
| 83 S State Rd Unit B502 Upper Darby Township, PA | 2.0 | 1.0 | 800 | $1,289 | $1.61 | 2d | 1 | 1.47mi |
Listing history 3 events
-
2026-06-18days on market $169,900 Active 2 DOM
-
2026-06-17remarks 699-char remark
-
2026-06-17$169,900 Active 1 DOM
ⓘ Source: listings_history table (triggers on properties + properties_extension) + one-shot
backfill from property_details.listing_events for pre-trigger history.
Tax reassessment forecast PA · Partial reset (capped growth)
- Current annual tax
- $2,960 · $247/mo
- Projected year-2 tax
- $2,960 · $247/mo
- Expected delta
- $0/yr ($0/mo · 0.0%)
ⓘ Screening estimate from a state-policy table — verify with the county assessor before closing.
Climate risk First Street
- Flood 1/10 Low FEMA zone X (unshaded) · 0% chance over 30 yrs
- Wildfire 1/10 Low
- Heat 6/10 Major 7 d/yr ≥103°F today · 15 d/yr by 30 yrs out
- Wind 6/10 Major 27% chance of damaging wind over 30 yrs
- Air quality 4/10 Moderate 3 unhealthy d/yr today · 6 by 30 yrs out
Nearby sold comps map
Loading sold comps map…
Walkable amenities ~0.75 mi
Loading nearby amenities…
Taxation est. · year 1
- Rental income
- $19,181
- − Mortgage interest
- −$9,517
- − Property taxes
- −$2,960
- − Insurance
- −$850
- − Repairs & maintenance
- −$1,534
- − Management
- −$1,534
- − Depreciation
- −$4,943
- Taxable loss
- −$2,158
- Est. tax savings @ 24.0%
- +$518
- After-tax cash flow
- $1,169/yr
For passive investors: Depreciation is non-cash, so a rental often shows a tax loss while cash-flowing — sheltering income. Rental losses are passive: they offset passive income freely, and up to $25,000/yr can offset ordinary (W-2) income if you actively participate and your MAGI is under $100k (phasing out to $0 by $150k); unused losses carry forward. On sale, claimed depreciation is recaptured at up to 25%, and gains may owe capital-gains tax (a 1031 exchange can defer both). Figures are a year-1 estimate at your 24.0% rate — not tax advice; consult a CPA.
Schools (NCES district)
- District
- Upper Darby SD
- NCES district ID
- 4224320
- Math proficiency
- 18% ▼ -8.00%
- Reading proficiency
- 36% ▼ -10.00%
- Median HH income
- $50,341
- Composite
- 23.68/100
- National rank
- #7837
- State rank
- #453 of 539 in PA
Livability — Upper Darby
No livability data for this city. (Only ~50 U.S. cities are tracked.)
Census & demographics
- County
- Delaware County · 399,863 people
- City population
- 41,541
- Metro
- Philadelphia-Camden-Wilmington, PA-NJ-DE-MD
- Population (ZIP)
- 41,541
- Household income
- $57,108
- Rent vs Own
- Severe rent burden
- 2416.0
Population outlook (Delaware County) Hauer SSP2
- Today (2025)
- 577,490 people
- By 2030
- 581,243 · +0.6%
- By 2040
- 584,700 · +1.2%
- By 2050
- 586,581 · +1.6%
- By 2075
- 598,706 · +3.7%
- By 2100
- 590,823 · +2.3%
Race, ethnicity, and origin ACS 2023
- Neighborhood character
- Highly diverse neighborhood (Simpson 0.71)
- Race & ethnicity
- Black 44% White 21% Asian 17% Hispanic / Latino 13% Two or more races 5%
- Hispanic origin (detail)
- Mexican 3% Puerto Rican 2%
- Common ancestry
- Hispanic 2% Swiss 2% Romanian 1%
- Foreign-born
- 34% · Canada, Vietnam, South Korea
- Languages at home
- 62% English-only · Spanish 11% Other Indo-European 10% French/Haitian/Cajun 5%
Political lean MEDSL · Delaware
- 2024 margin
- Strong D (+23.7) · D 61.4% · R 37.6% · Other 1.0%
- 2008→2024 swing
- +2.3pp toward D · 2008: 21.4pp · 2024: 23.7pp
- All cycles
- 2024: D+23.7 2020: D+26.7 2016: D+22.0 2012: D+21.8 2008: D+21.4
Not yet ingested
- Civics
- —
Market trends
- HPI YoY
- ▼ -161.05%
- Current HPI
- 341.2957
- Rent YoY
- ▲ 1.62%
- Metro
- Philadelphia-Camden-Wilmington, PA-NJ-DE-MD
- State GDP YoY
- ▲ 1.68%
- F500 in state
- 34
Industry mix (Fortune 500 HQ in PA)
| Industry | F500 HQs | Revenue |
|---|---|---|
| Healthcare | 2 | $309B |
|
||
| Insurance | 2 | $27B |
|
||
| Telecommunications / Media | 1 | $124B |
|
||
| Industrial Distribution | 1 | $22B |
|
||
| Financial Services | 1 | $20B |
|
||
| Chemicals / Materials | 1 | $18B |
|
||
Price history
+553.5% since first listed5 events — show timeline
- 2026-06-16 Listed $169,900 BRIGHT MLS
- 2021-10-05 Sold (Public Records) $75,000 Public Records
- 2004-06-10 Listing Removed — BRIGHT MLS
- 2004-04-08 Listed $68,500 BRIGHT MLS
- 1981-10-13 Sold (Public Records) $26,000 Public Records
Property tax history
+4.2%/yrLatest (2026): $2,960 · +7.7% YoY. Source: county tax records.
Cash-flow waterfall
monthlySold comps — $/sqft
last 12 mo · ≤1 miLoading sold comps…